
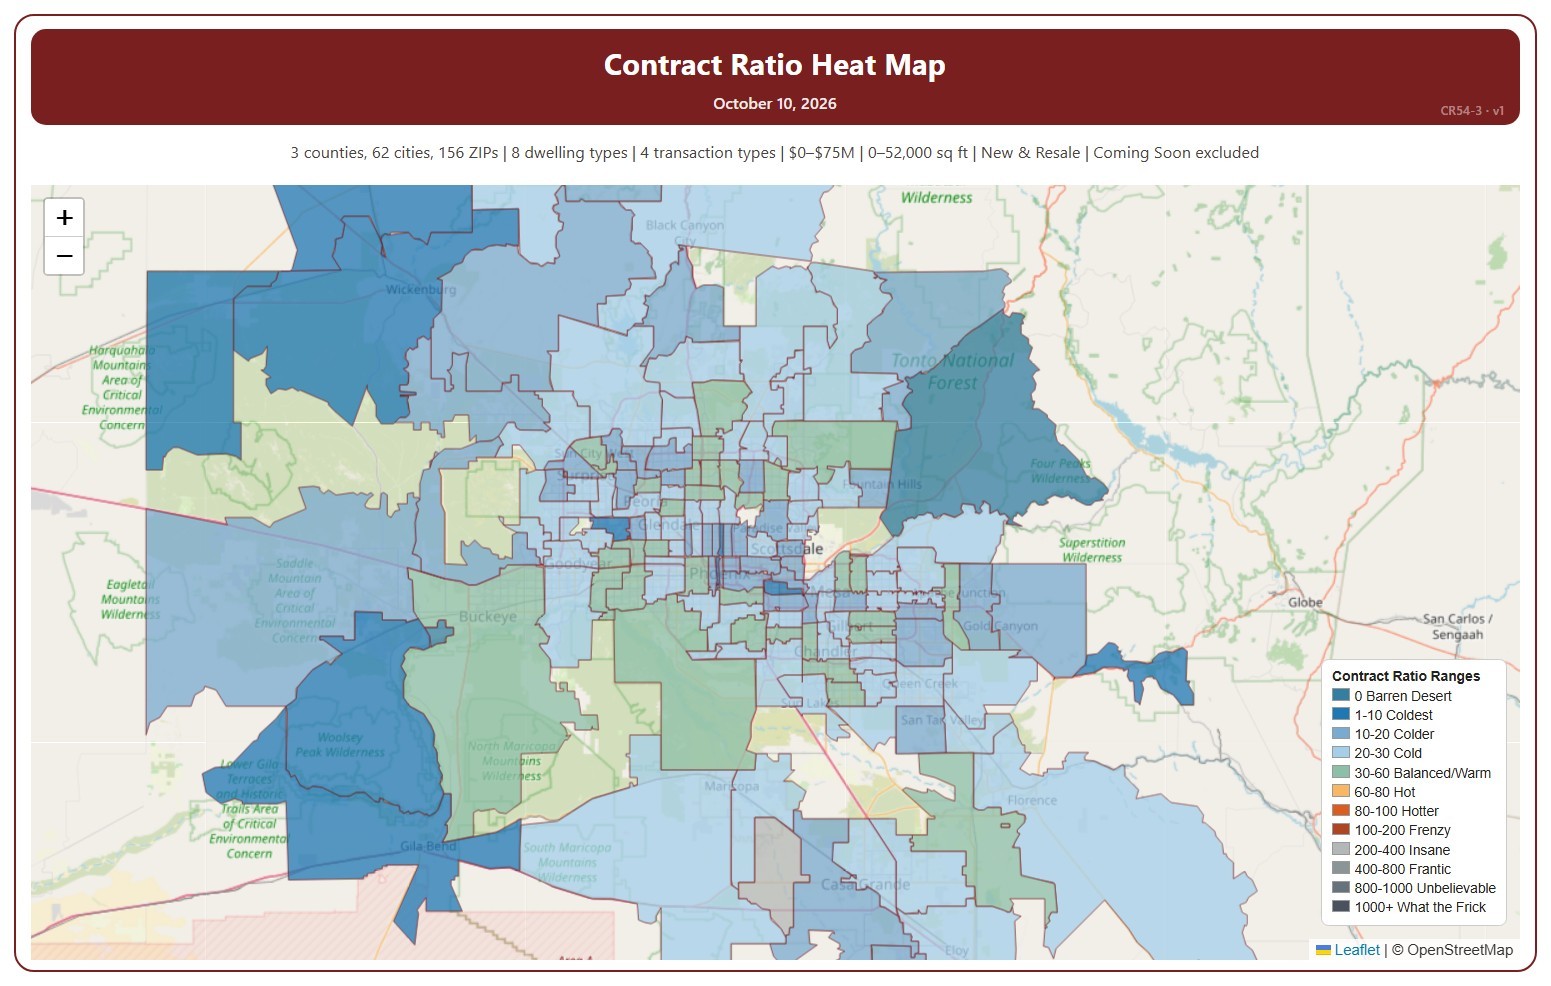
About this chart
This map shades each ZIP code by its Contract Ratio on one Saturday: the number of listings under contract (pending, plus UCB and CCBS) for every 100 active listings, measured on Saturdays. The ranges run from 0 Barren Desert (nothing under contract) to 1000+. Click a range in the legend to show only that range, click more ranges to add them, and click Show all ranges to see every range again.
It opens on the latest Saturday. Use the controls under the map to step a week at a time, pick any Saturday back to January 2011, or drag the slider. Press play to step through the weeks as a slide show at the speed you choose. ZIP codes with no active listings that week are left unshaded. The map is updated every week.
It opens on the Greater Phoenix area: the counties, cities, and ZIP codes that make it up are ticked to start with. Tick or untick any of them to change the area, including counties beyond Greater Phoenix. Narrow it further with the Dwelling Type, Transaction Type, and New / Resale boxes and the list price and home size sliders. Tick Count Coming Soon as Active to add Coming Soon listings to the active count.
Hover over a ZIP code to see its ratio, its range, and the numbers of listings under contract and active.