
About this chart
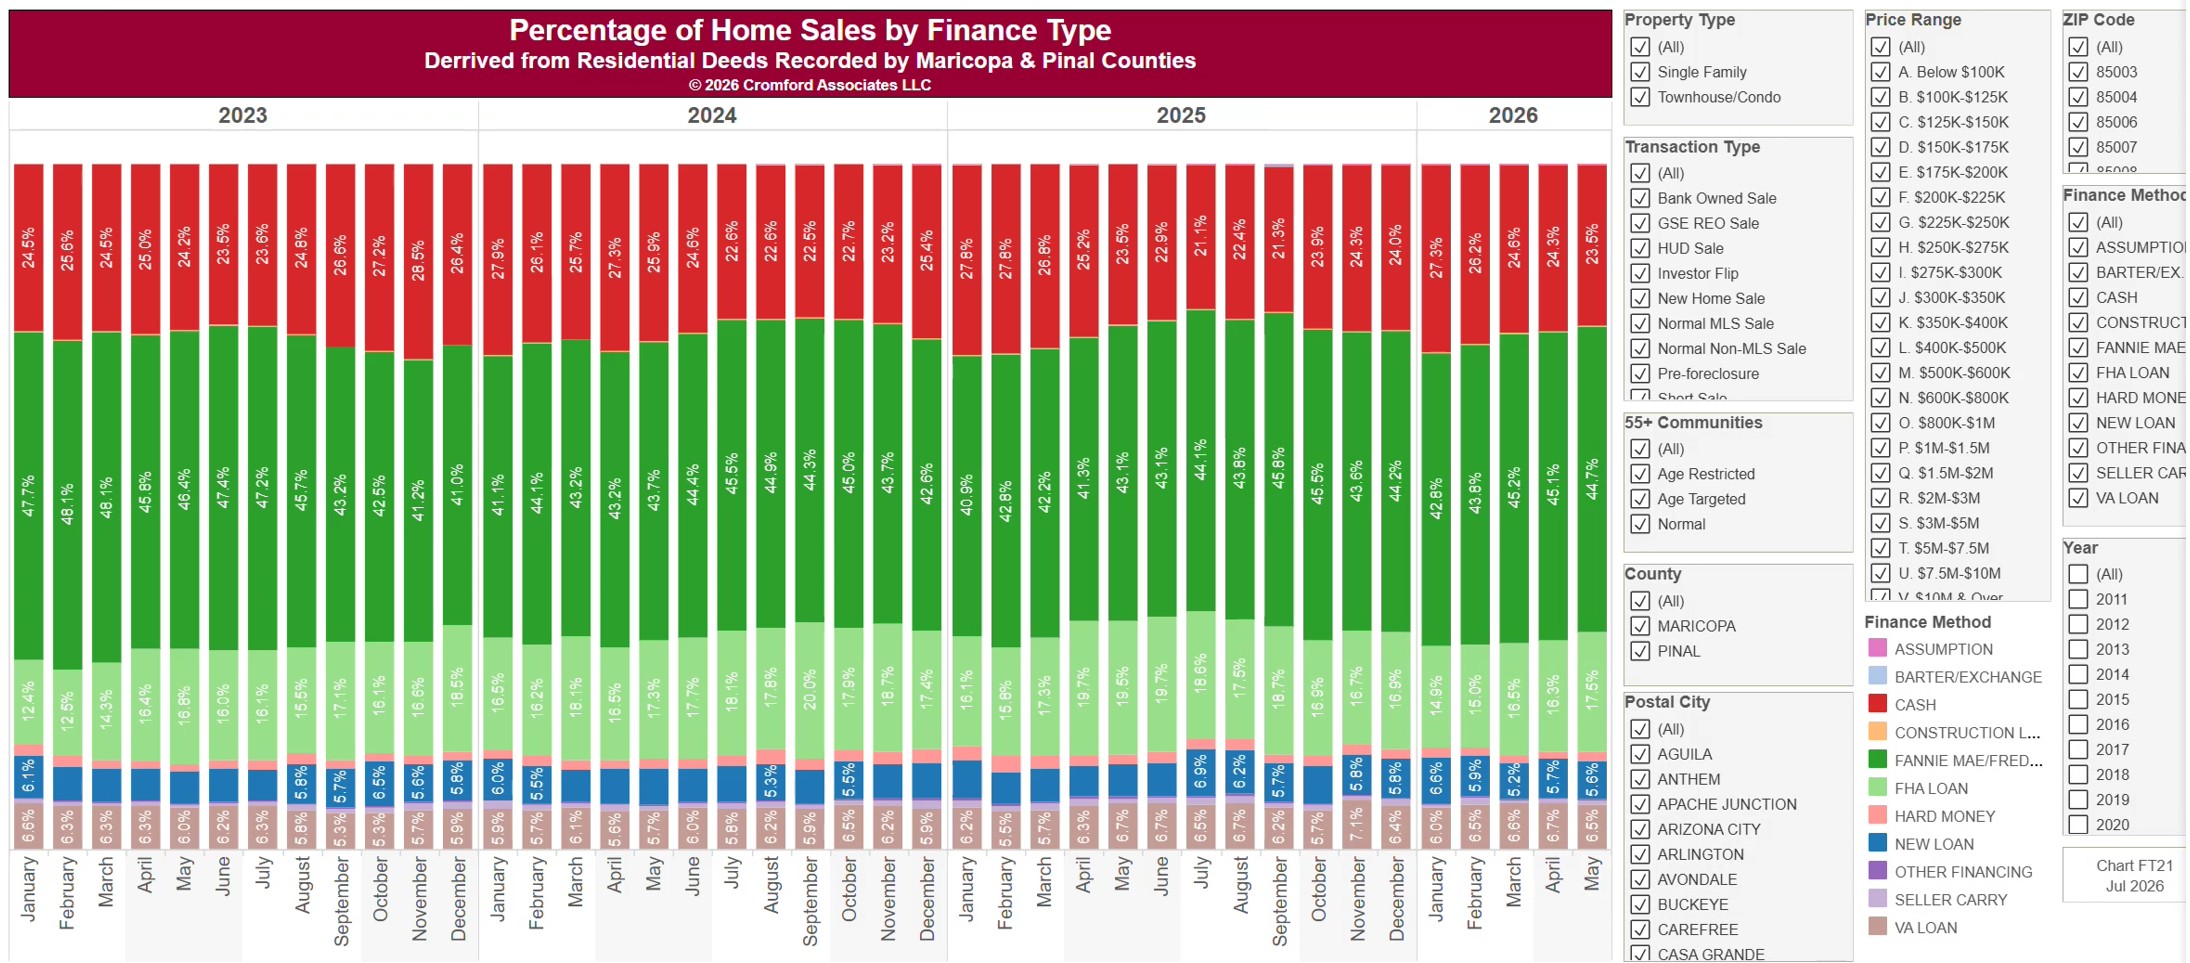
This chart shows how homes were paid for, one bar per calendar month since January 2011, from residential deeds recorded by Maricopa and Pinal Counties. Each bar adds up to 100% and is split by finance method: cash, Fannie Mae / Freddie Mac, FHA, VA, other new loans, hard money, seller carry, assumptions, construction loans, and other financing. It is about the mix, not the volume, so a quiet month and a busy month are the same height.
It opens on Maricopa and Pinal Counties with everything included. Narrow it with the County, City, and ZIP panels, the Finance Method, Transaction Type, Property Type, and 55+ Communities boxes, and the sale price slider. Untick years in the Year panel to drop them from the chart.
The records run to the end of last month and are updated monthly. Hover over a bar to see each share for that month.