Contract Ratio Monthly

About this chart

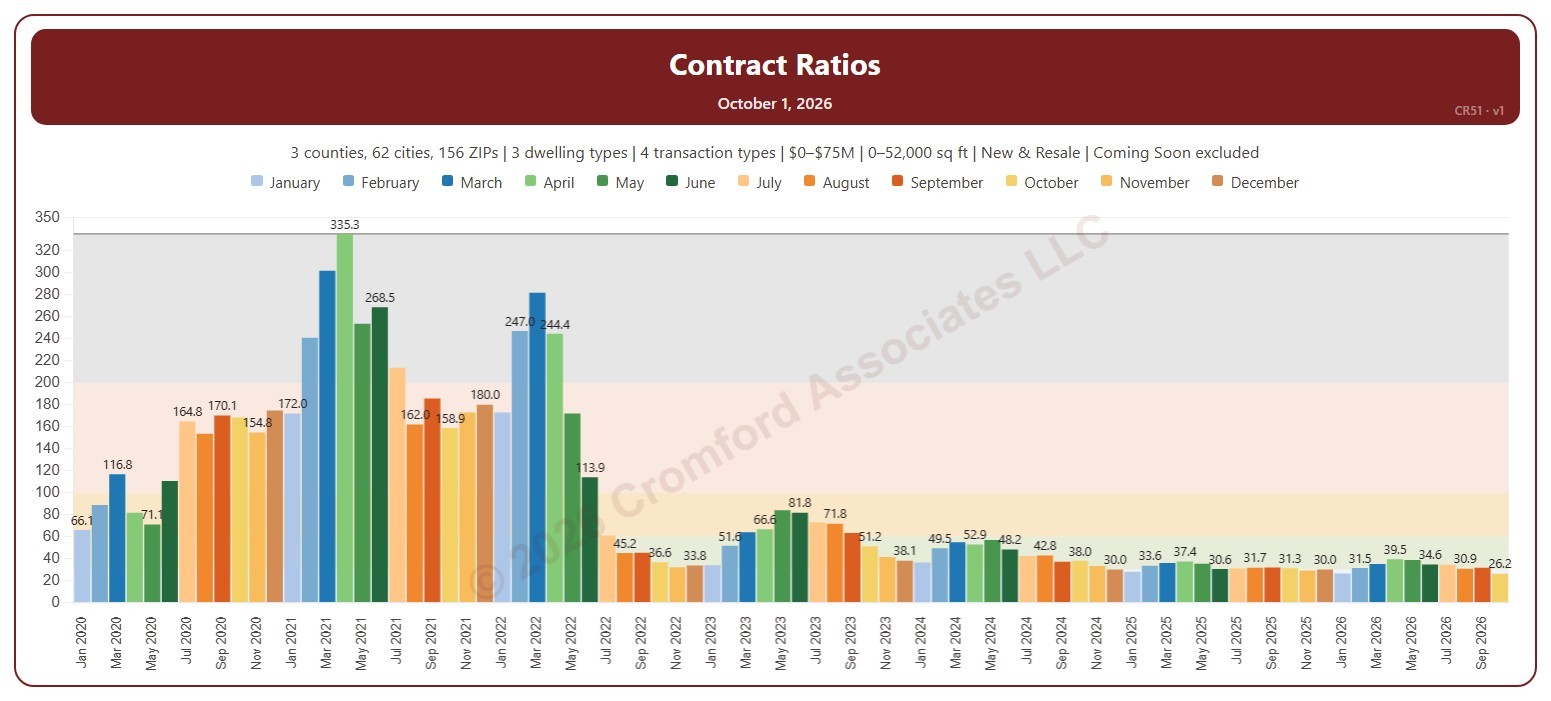
This chart shows the Contract Ratio for each month: the number of listings under contract (pending, plus UCB and CCBS) for every 100 active listings, measured on the first day of the month. Each bar is one month, colored by month. The shaded bands mark a Cool market (below 30), Warm (30 to 60), Hot (60 to 100), Frenzy! (100 to 200), and Insanity!! (above 200), and the line marks the highest month shown.

It opens on January 2020 to date. Drag the handles of the date slider under the chart to choose the months shown, as far back as April 2010. Click a month in the legend to hide or show it. A new month appears once its first-day figures are in.

It opens on the Greater Phoenix area: the counties, cities, and ZIP codes that make it up are ticked to start with. Tick or untick any of them to change the area, including counties beyond Greater Phoenix. Narrow it further with the Dwelling Type, Transaction Type, and New / Resale boxes and the list price and home size sliders. Tick Count Coming Soon as Active to add Coming Soon listings to the active count.

Hover over a bar to see the ratio and the numbers of listings under contract and active that day.
Contract Ratios

About this chart

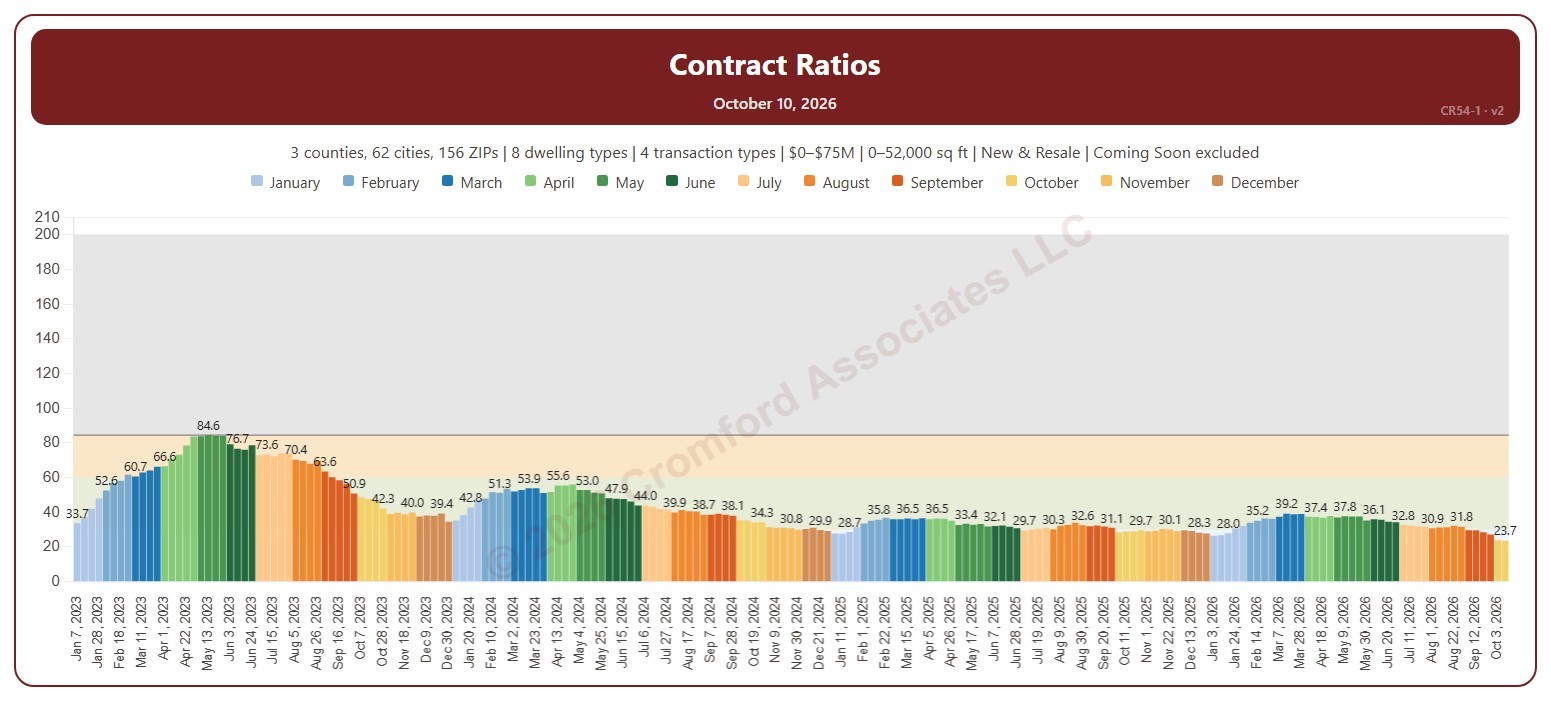
This chart shows the Contract Ratio for each week: the number of listings under contract (pending, plus UCB and CCBS) for every 100 active listings, measured on Saturdays. Each bar is one Saturday, colored by month. The shaded bands mark a Cool market (below 30), Warm (30 to 60), Hot (60 to 100), Frenzy! (100 to 200), and Insanity!! (above 200), and the line marks the highest week shown.

It opens on January 2023 to date. Drag the handles of the date slider under the chart to choose the weeks shown, as far back as January 2011. Click a month in the legend to hide or show its weeks. The chart is updated every week.

It opens on the Greater Phoenix area: the counties, cities, and ZIP codes that make it up are ticked to start with. Tick or untick any of them to change the area, including counties beyond Greater Phoenix. Narrow it further with the Dwelling Type, Transaction Type, and New / Resale boxes and the list price and home size sliders. Tick Count Coming Soon as Active to add Coming Soon listings to the active count.

Hover over a bar to see the ratio and the numbers of listings under contract and active that week.

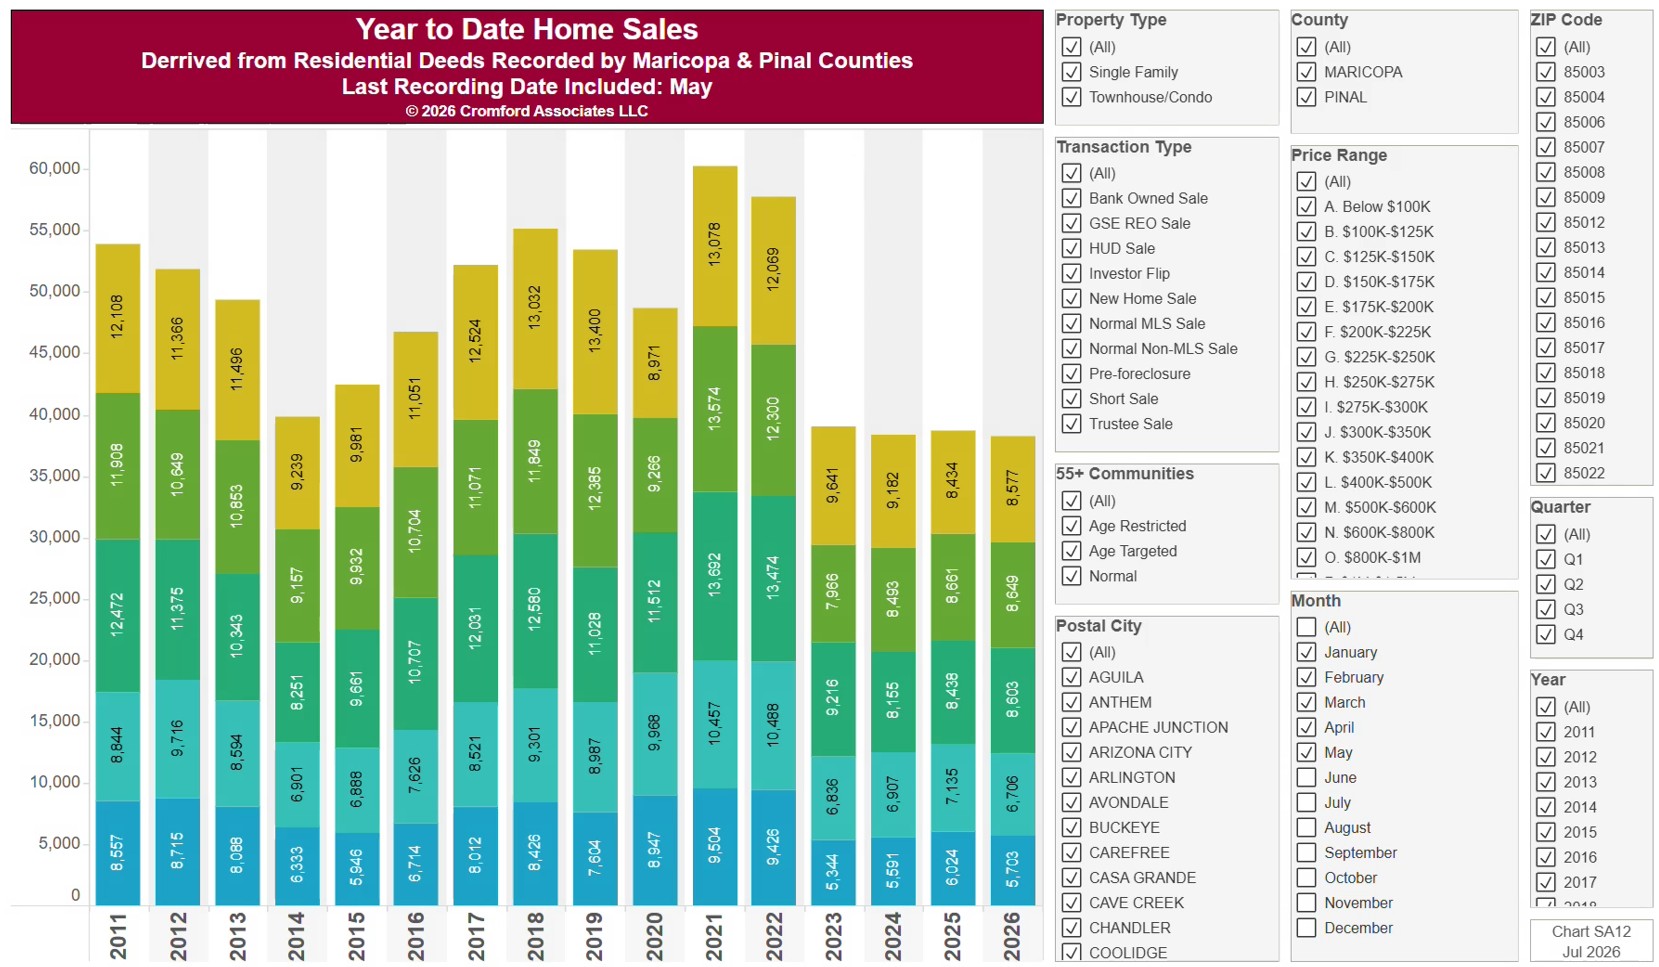
Home Sales Year-to-Date

About this chart

This chart counts the homes sold each year since 2011, from residential deeds recorded by Maricopa and Pinal Counties, with every year cut to the same months (January to the latest month recorded), so the current year can be compared fairly with earlier ones. Because it is built from recorded deeds, it covers every recorded sale, not just homes listed on ARMLS: new homes, private sales, and investor deals are all included.

It opens on Maricopa and Pinal Counties with everything included. Narrow it with the County, City, and ZIP panels, the Transaction Type, Property Type, and 55+ Communities boxes, and the sale price slider.

The records run to the end of last month and are updated monthly. Hover over a bar to see the exact figure for that year.

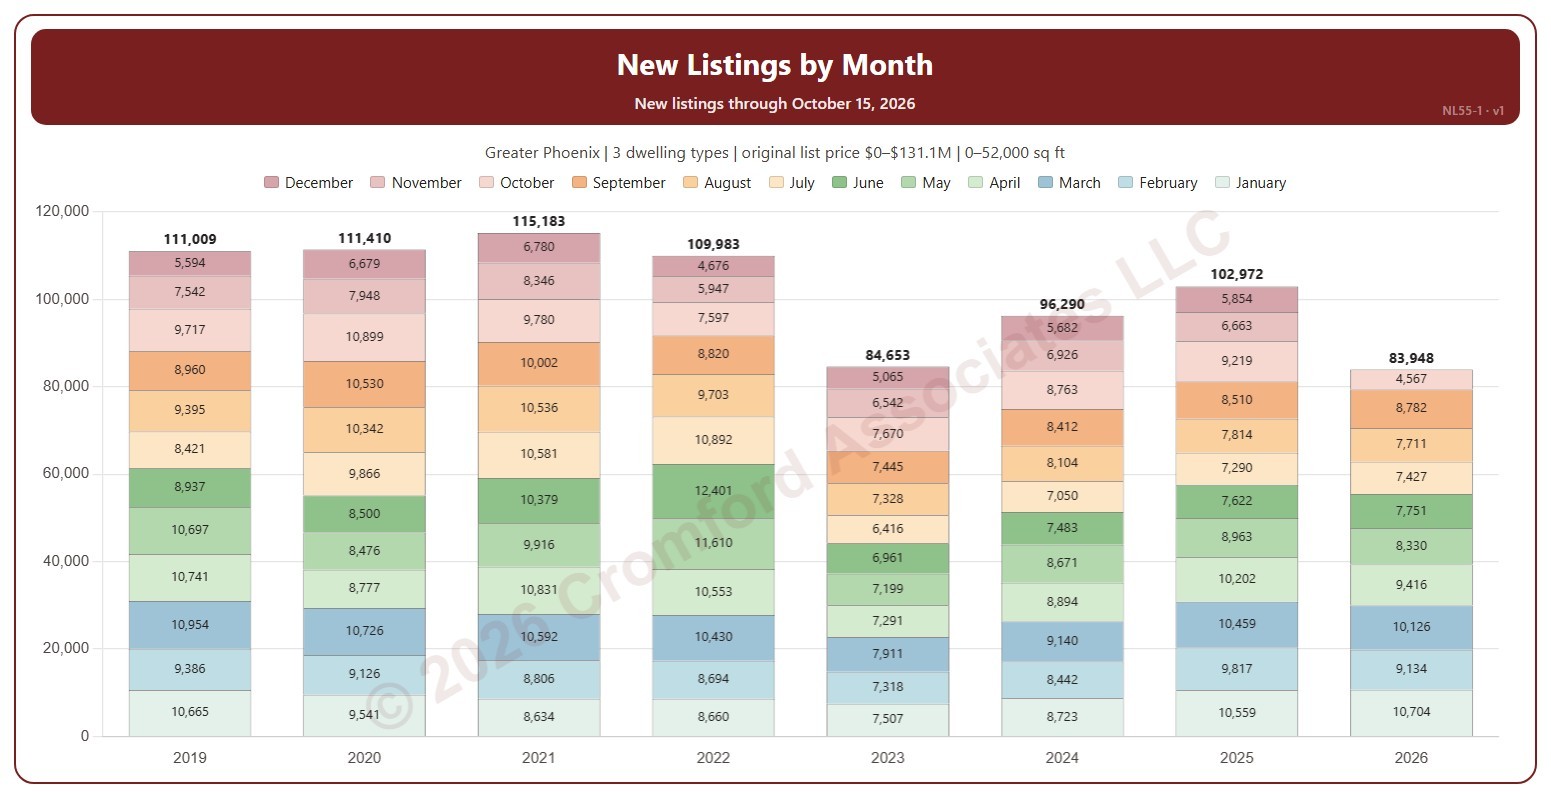
New Listings by Month

About this chart

This chart shows the number of new listings each year, each bar split into the 12 months, with each month’s count and the year’s total labeled. A new listing is any listing on ARMLS, counted on the date it was listed, whatever happened to it afterwards (sold, expired, cancelled, or still for sale).

It opens on the latest 8 years; tick other years in the Year box to go back as far as 2001. The current year is the year so far. The chart is updated every day.

It opens on the Greater Phoenix area: the counties, cities, and ZIP codes that make it up are ticked to start with. Tick or untick any of them to change the area, including counties beyond Greater Phoenix. Narrow it further with the Dwelling Type, Transaction Type, and New / Resale boxes and the original list price, home size, and year built sliders.

Hover over a bar to see each month and the year’s total.