Flip Sales – Median Measures by City

About this chart

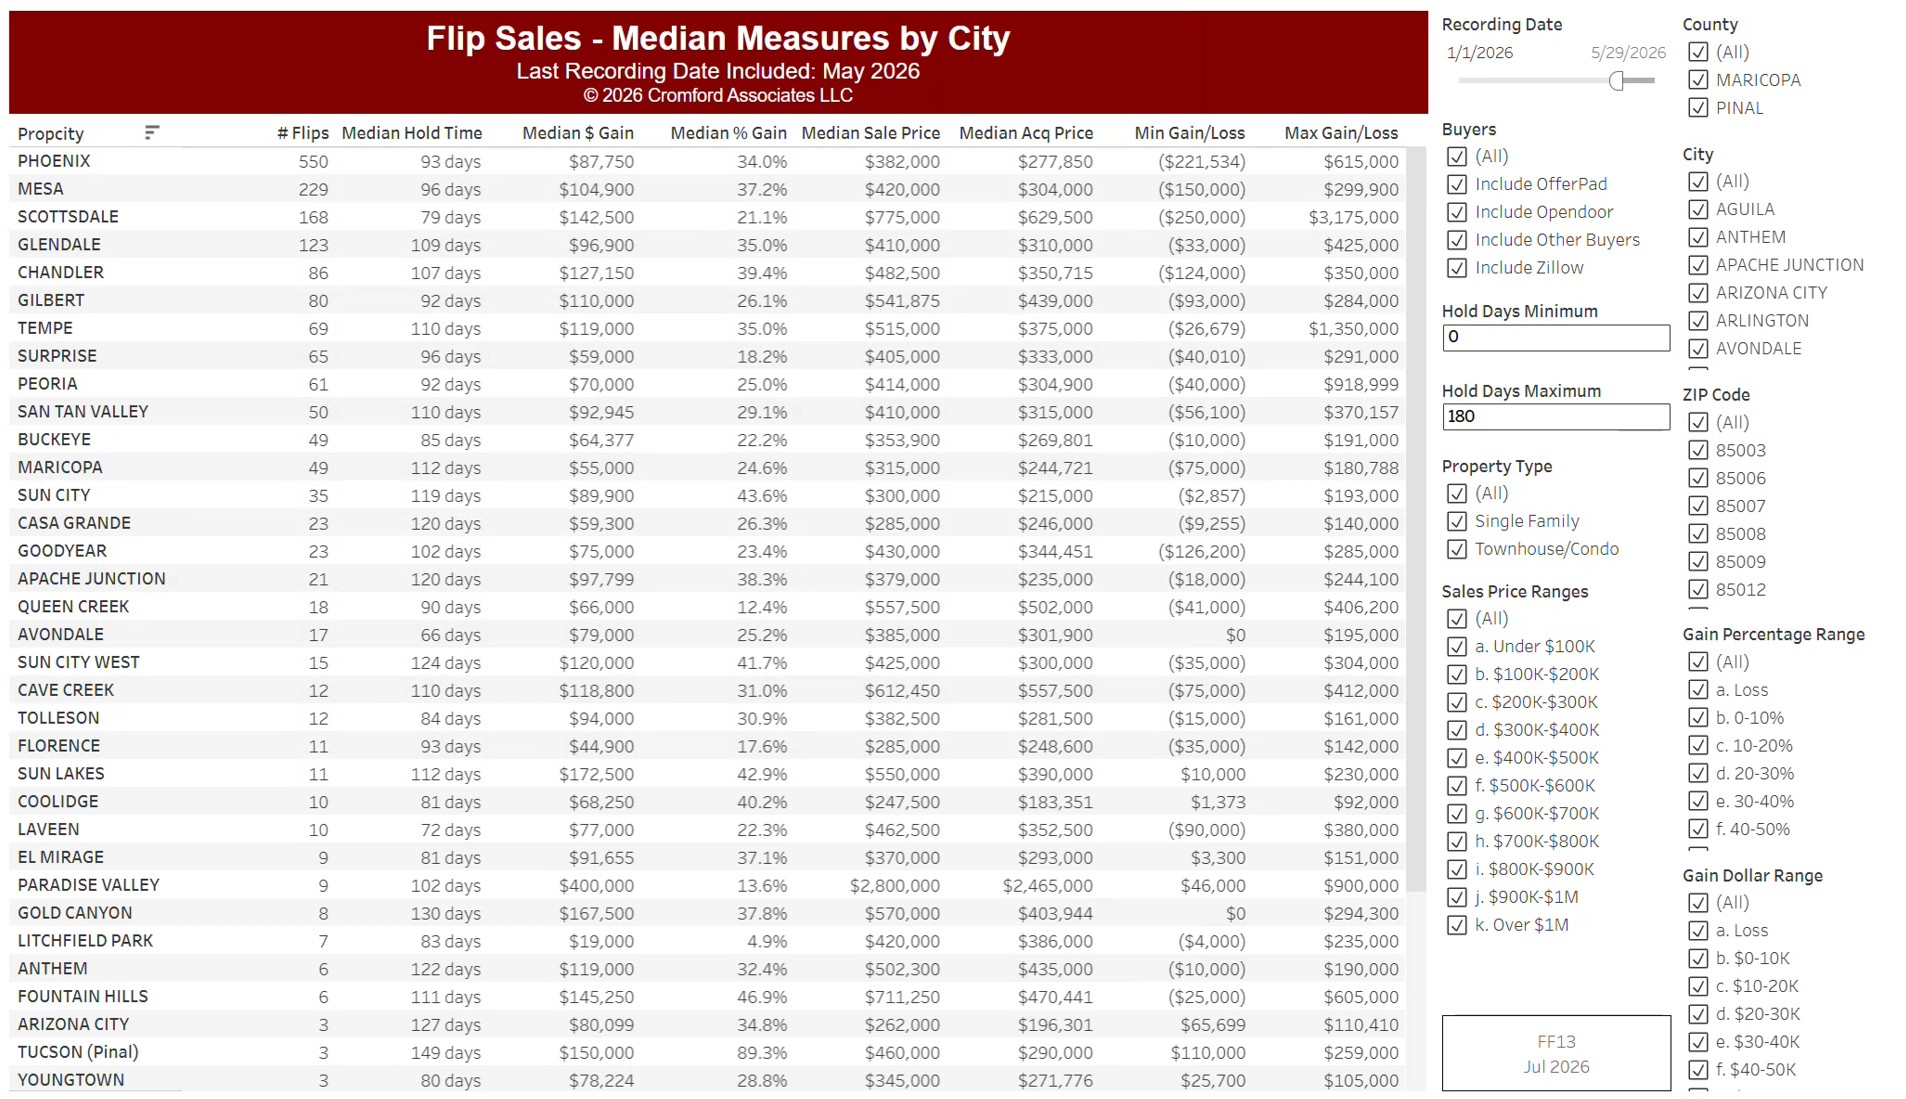
This table compares fix-and-flip sales by city, from residential deeds recorded by Maricopa and Pinal Counties: homes bought and resold by an investor. Each row is a city, with the number of flips, the median hold time in days, the median gross profit in dollars and as a percentage, the median sale and purchase prices, and the smallest and largest gross profit.

It opens on the months recorded so far this year; use the Recording Month slider to choose the period. It is sorted by the number of flips. Narrow it with the County, City, and ZIP panels, the Buyers and Property Type boxes, and the sale price, hold days, gross profit, and gross profit % sliders.

Gross profit is the difference between the purchase and resale prices, before renovation and selling costs.
Flip Sales – Median Acquisition and Sales Prices

About this chart

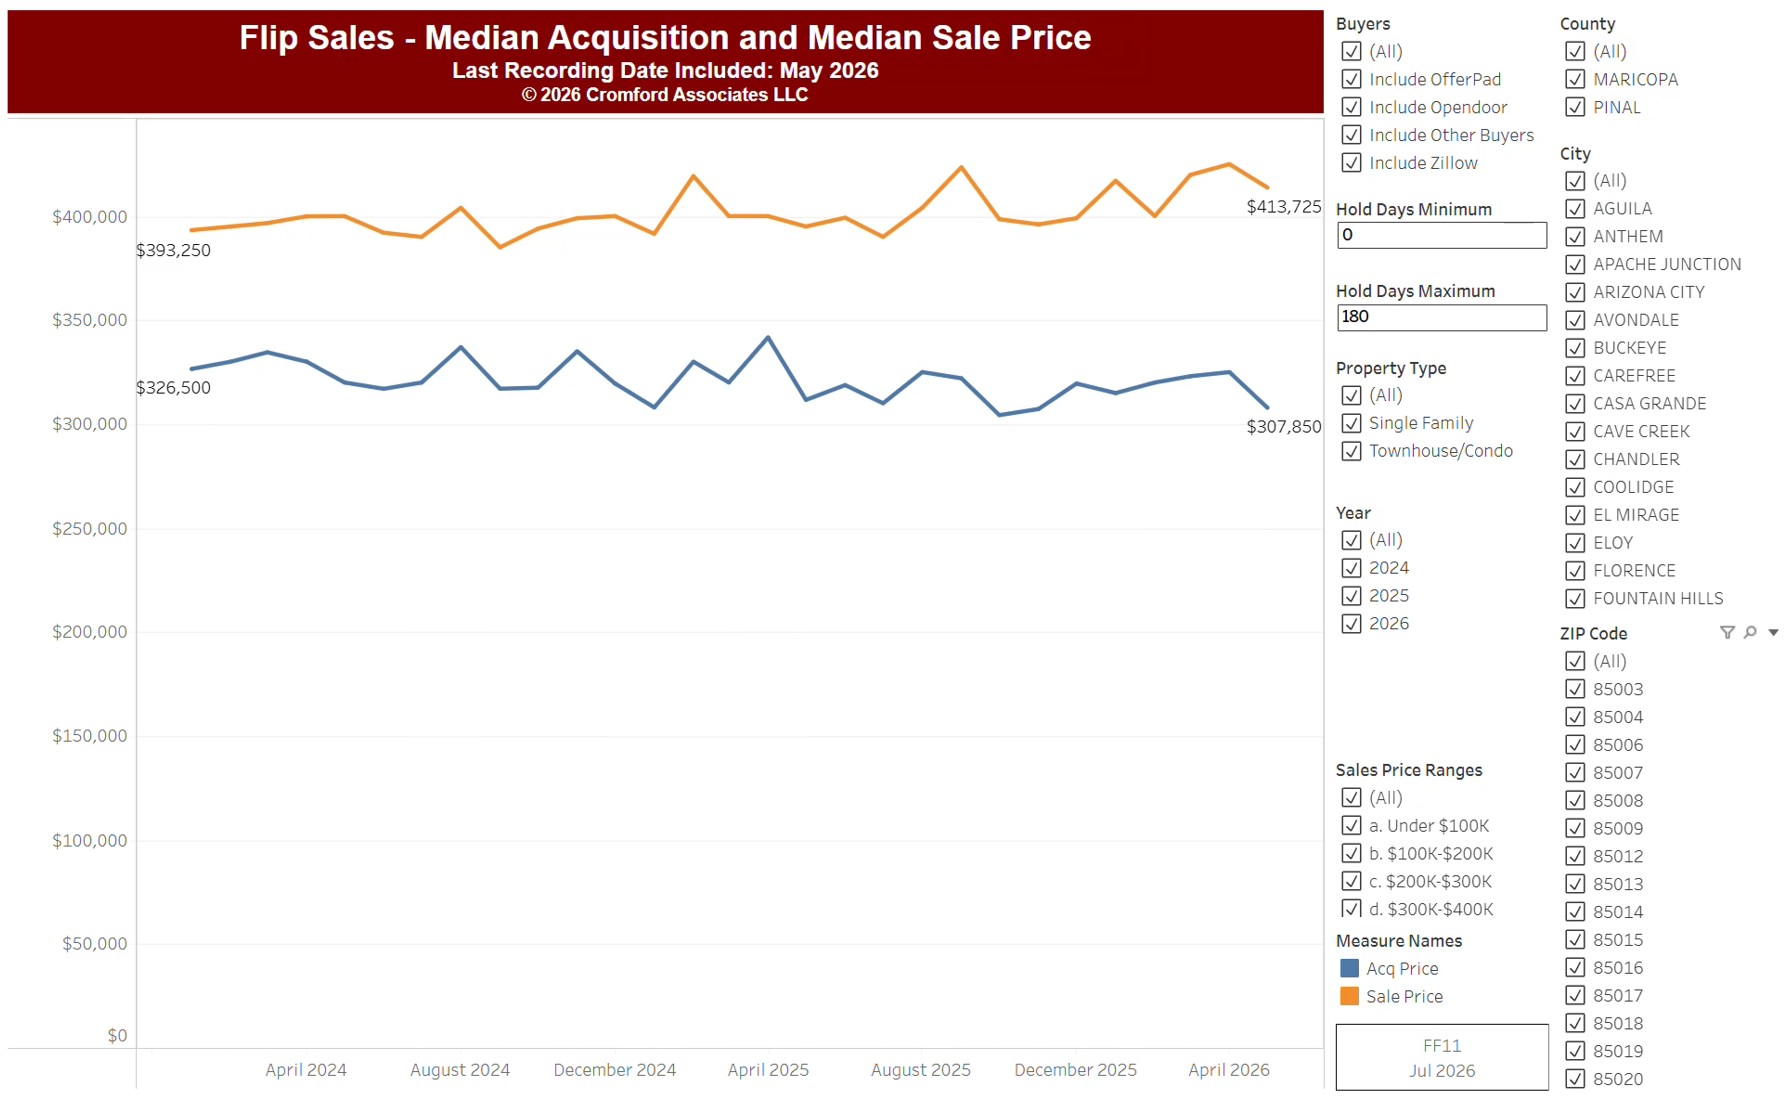
This chart follows fix-and-flip sales, from residential deeds recorded by Maricopa and Pinal Counties: homes bought and resold by an investor. Its two lines show, by calendar month since January 2014, the median price flippers paid and the median price they resold for. The gap between the lines is the typical gross margin on a flip, before renovation and selling costs.
It opens on every month since January 2014, with Maricopa and Pinal Counties and all buyers included, Opendoor, OfferPad, Zillow, and Homes2X among them; untick them under Buyers to leave them out. Choose the period with the Recording Month slider, and narrow it with the County, City, and ZIP panels, the Property Type boxes, and the sale price and hold days sliders.

The records run to the end of last month and are updated monthly. Hover over the chart to see the figures for that month.

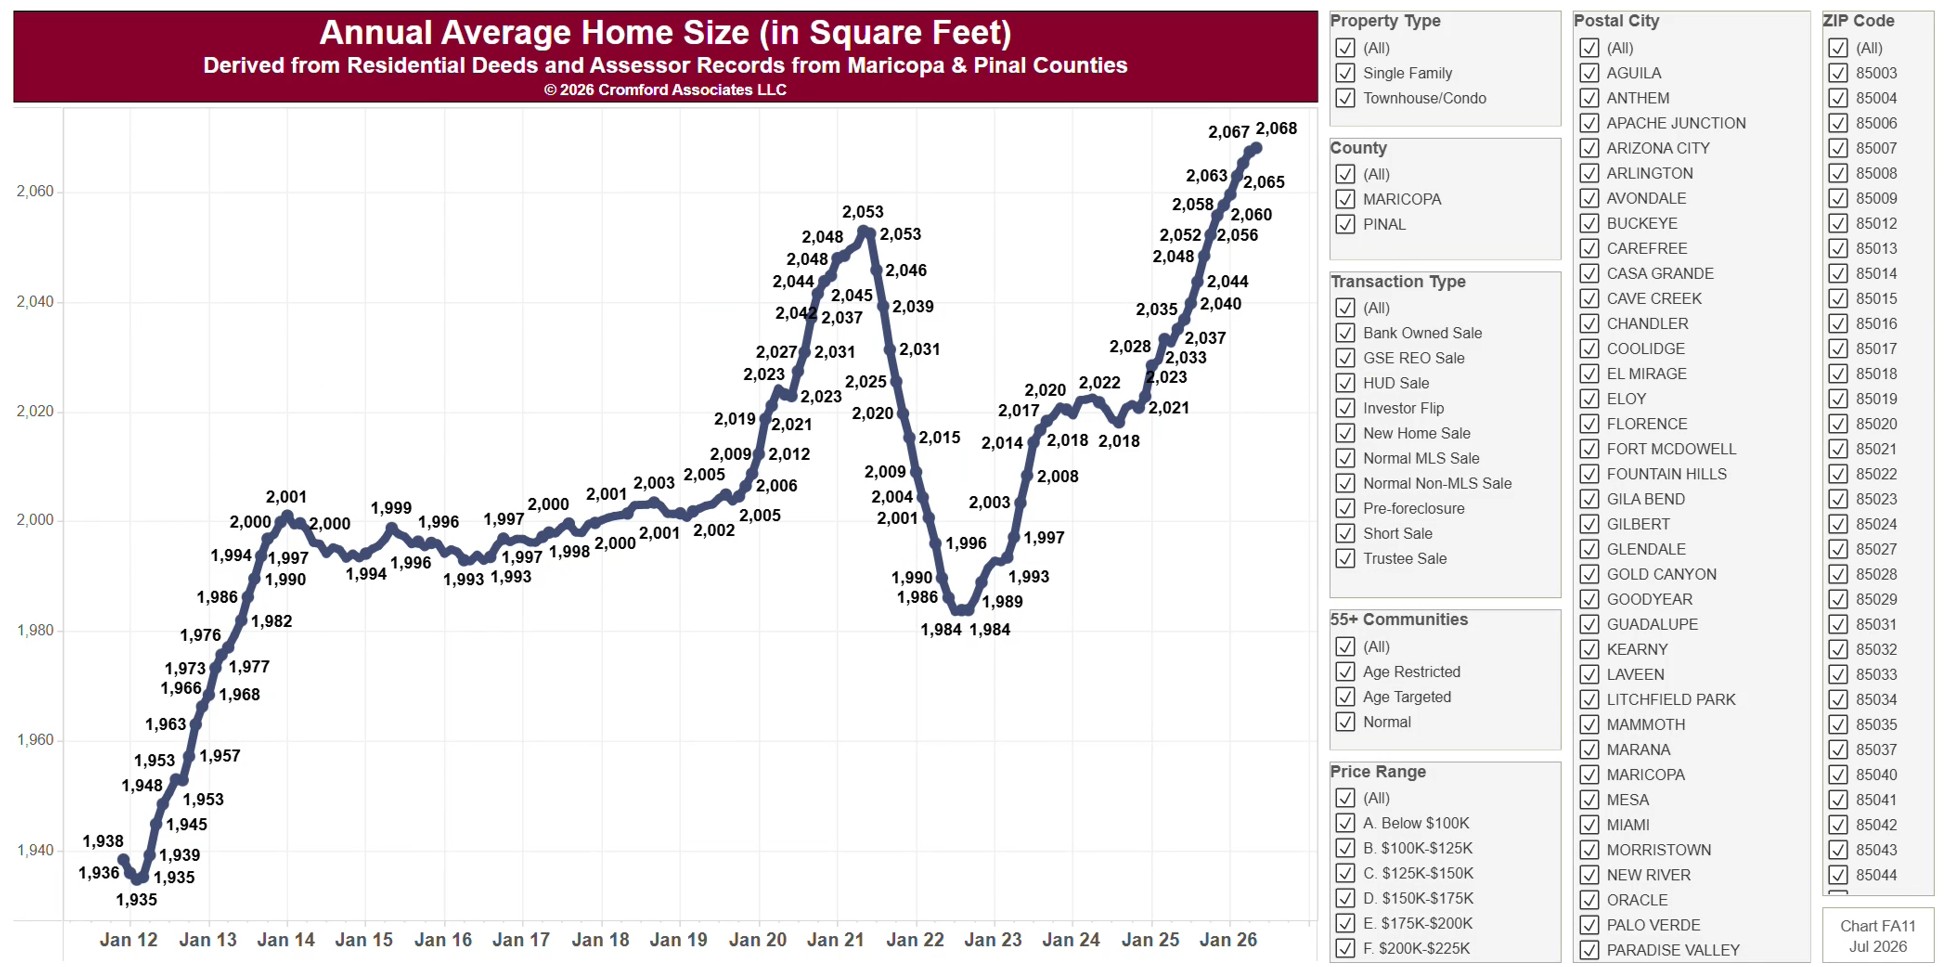
Annual Average Home Size (in Square Feet)

About this chart

This chart shows the 12-month moving average size, in square feet, of the homes sold, by month since 2011, from residential deeds recorded by Maricopa and Pinal Counties. The square footage is the county assessor’s figure. Because it is built from recorded deeds, it covers every recorded sale, not just homes listed on ARMLS: new homes, private sales, and investor deals are all included.

It opens on Maricopa and Pinal Counties with everything included. Narrow it with the County, City, and ZIP panels, the Transaction Type, Property Type, and 55+ Communities boxes, and the sale price slider.

The records run to the end of last month and are updated monthly. Hover over the line to see the exact figure for that month.

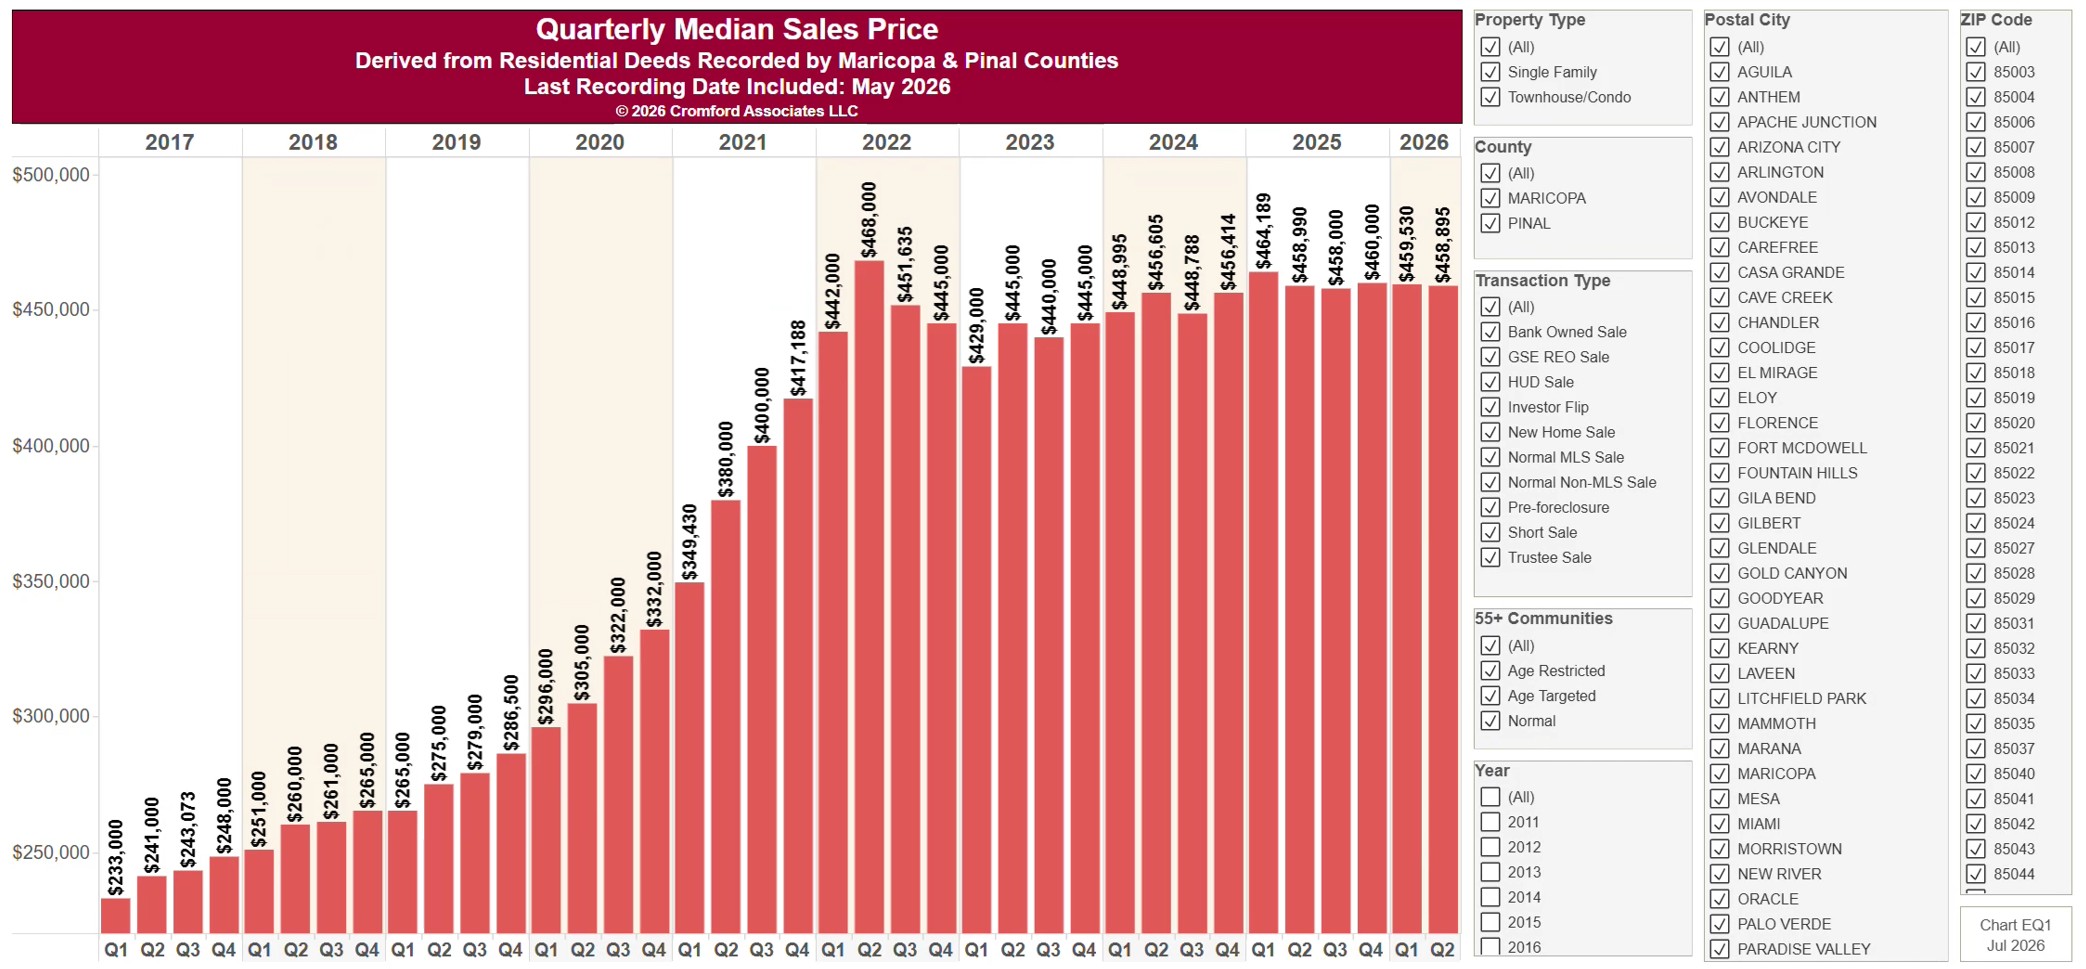
Quarterly Median Sales Price

About this chart

This chart shows the median sale price of homes, one bar per calendar quarter since 2011, from residential deeds recorded by Maricopa and Pinal Counties. The median is the price in the middle: half sold for more and half for less. Because it is built from recorded deeds, it covers every recorded sale, not just homes listed on ARMLS: new homes, private sales, and investor deals are all included.

It opens on Maricopa and Pinal Counties with everything included. Narrow it with the County, City, and ZIP panels, the Transaction Type, Property Type, and 55+ Communities boxes, and the sale price and home size sliders. Untick years in the Year panel to drop them from the chart.

The newest quarter is usually only part of a quarter, because the records run to the end of last month. Hover over a bar to see the exact figure for that quarter.

Monthly Median Sales Price

About this chart

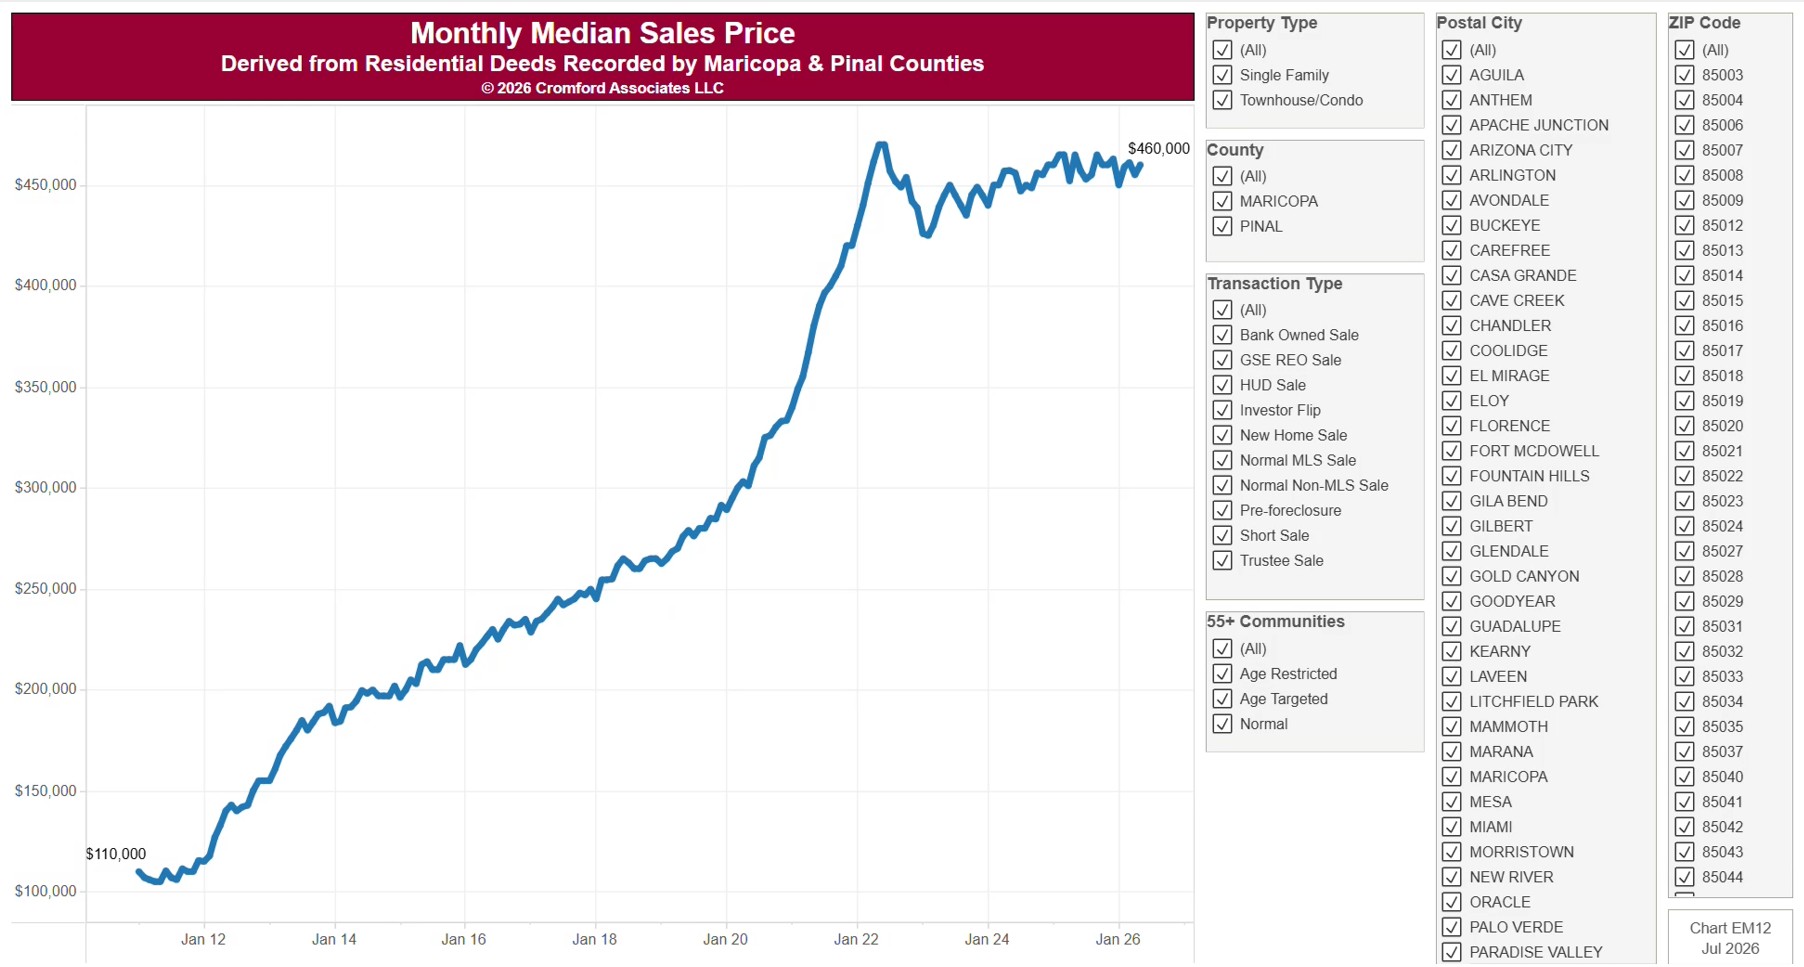
This chart shows the median sale price of homes as a line by calendar month since January 2011, from residential deeds recorded by Maricopa and Pinal Counties. It is the same series as EM11, drawn as a line to show the trend. The median is the price in the middle: half sold for more and half for less. Because it is built from recorded deeds, it covers every recorded sale, not just homes listed on ARMLS: new homes, private sales, and investor deals are all included.

It opens on Maricopa and Pinal Counties with everything included. Narrow it with the County, City, and ZIP panels, the Transaction Type, Property Type, and 55+ Communities boxes, and the sale price and home size sliders.

The records run to the end of last month and are updated monthly. Hover over the line to see the exact figure for that month.

Monthly Median Sales Price

About this chart

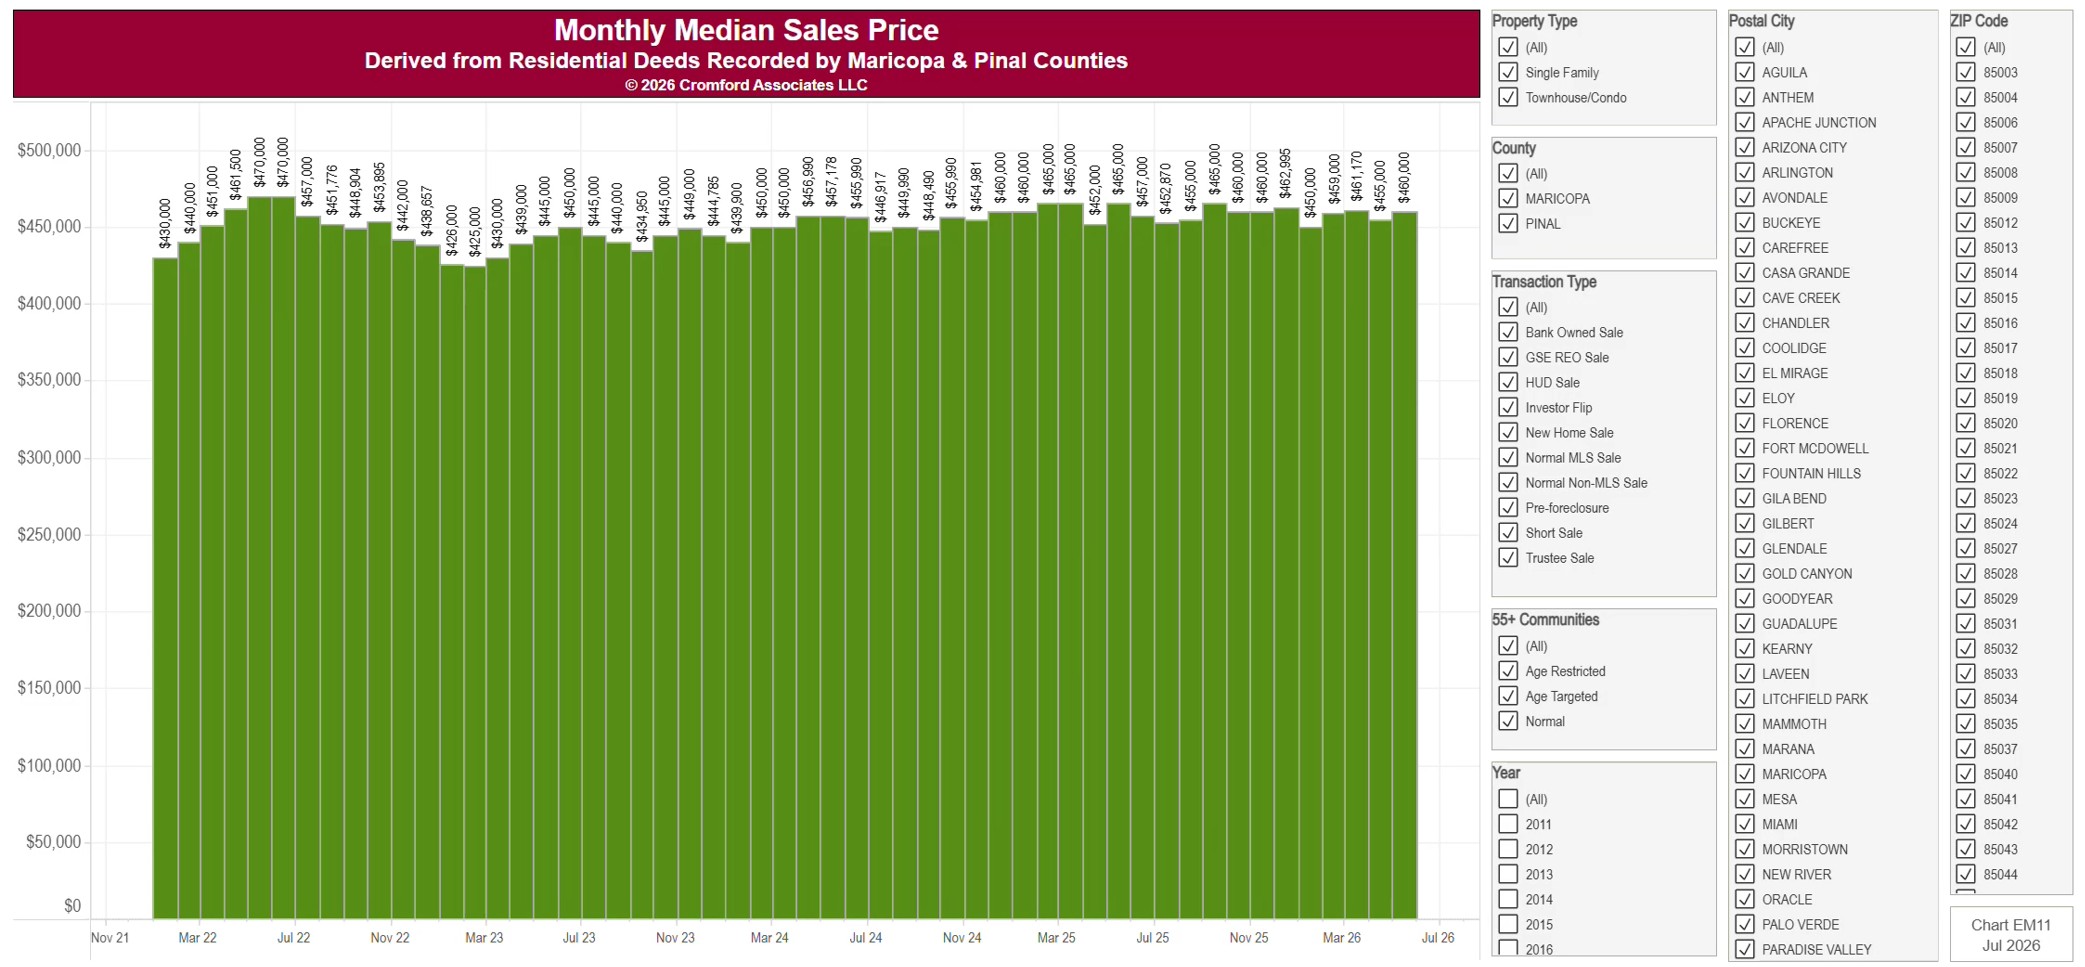
This chart shows the median sale price of homes, one bar per calendar month since January 2011, from residential deeds recorded by Maricopa and Pinal Counties. The median is the price in the middle: half sold for more and half for less. Because it is built from recorded deeds, it covers every recorded sale, not just homes listed on ARMLS: new homes, private sales, and investor deals are all included.

It opens on Maricopa and Pinal Counties with everything included. Narrow it with the County, City, and ZIP panels, the Transaction Type, Property Type, and 55+ Communities boxes, and the sale price slider. Untick years in the Year panel to drop them from the chart.

The records run to the end of last month and are updated monthly. Hover over a bar to see the exact figure for that month.

Annual Median Sales Price

About this chart

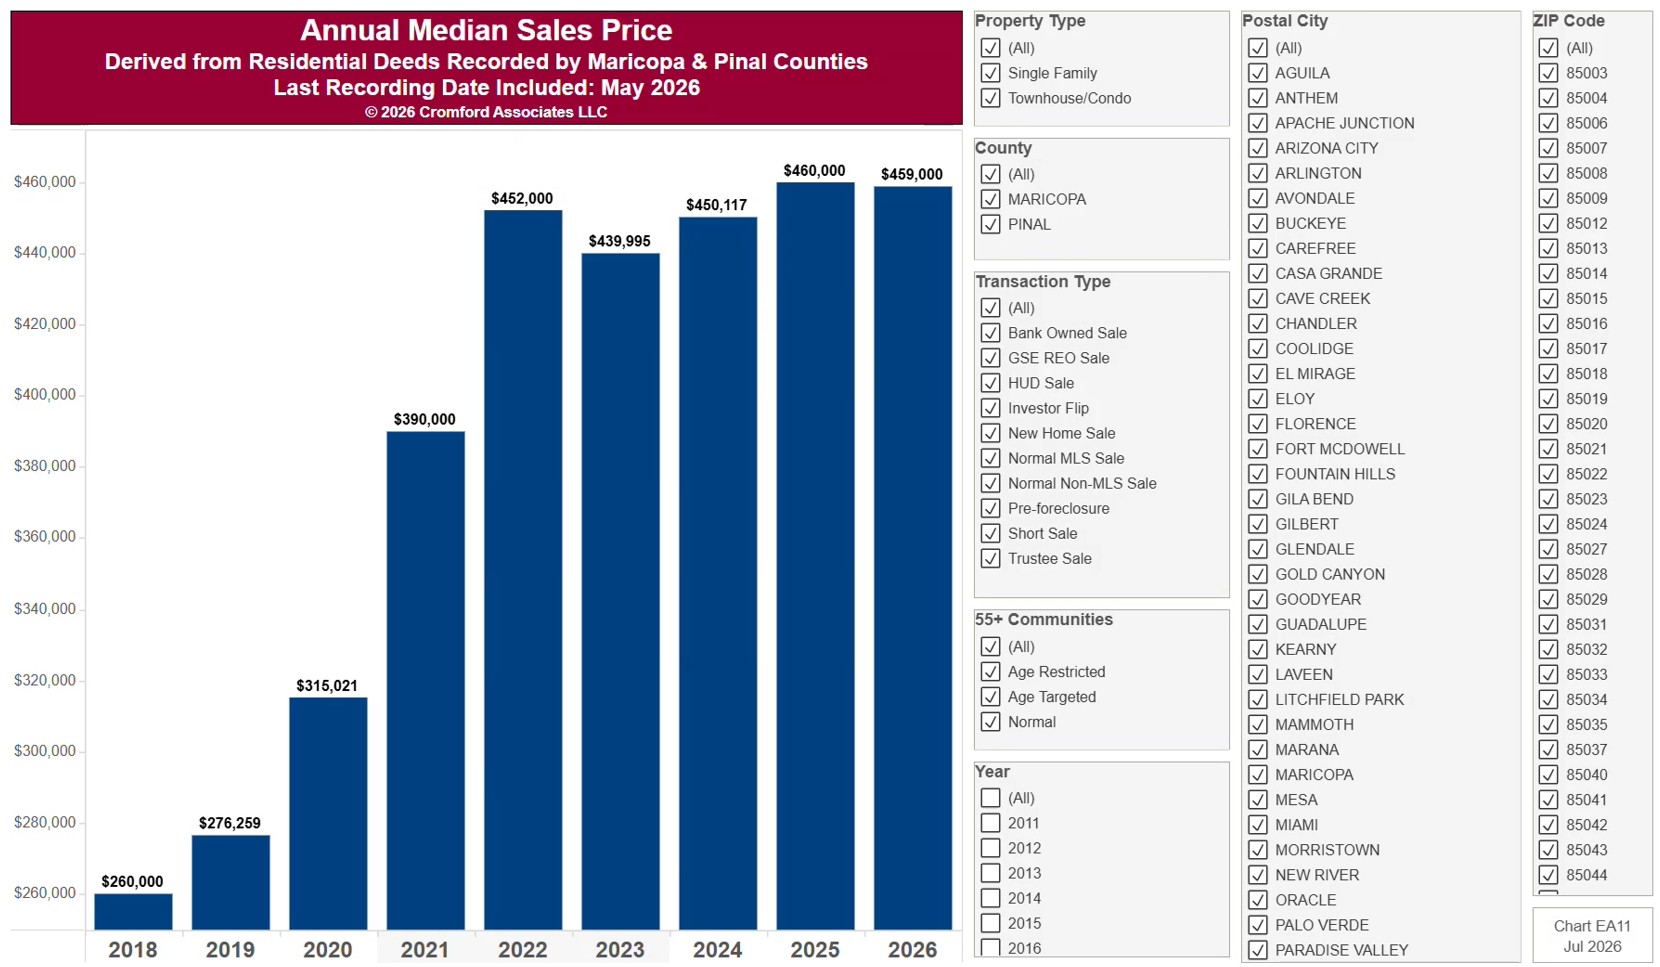
This chart shows the median sale price of homes, one bar per calendar year, from residential deeds recorded by Maricopa and Pinal Counties. The median is the price in the middle: half sold for more and half for less. Because it is built from recorded deeds, it covers every recorded sale, not just homes listed on ARMLS: new homes, private sales, and investor deals are all included.

It opens on Maricopa and Pinal Counties with everything included. Narrow it with the County, City, and ZIP panels, the Transaction Type, Property Type, and 55+ Communities boxes, and the sale price slider. The years since 2018 are ticked to start with; tick any year back to 2011 in the Year panel.

The current year’s bar covers only the months recorded so far. Hover over a bar to see the exact figure for that year.

Annual Dollar Volume

About this chart

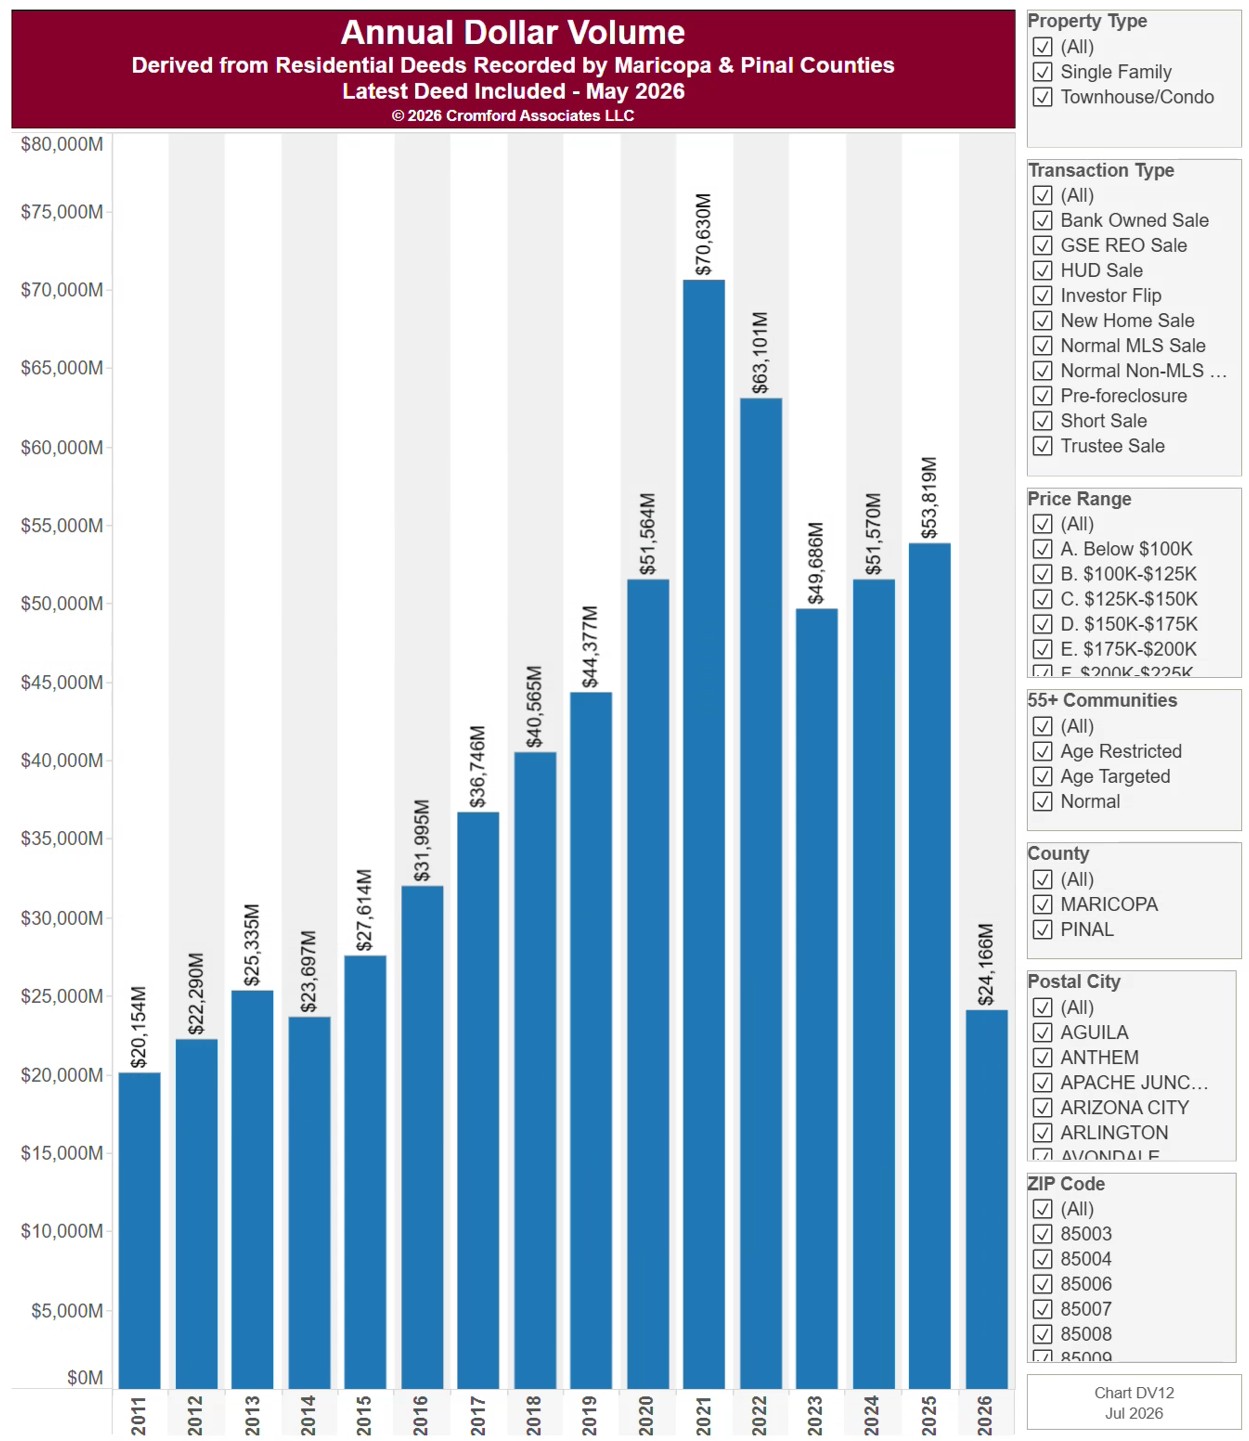
This chart shows dollar volume: the total value of the homes sold each calendar year since 2011, from residential deeds recorded by Maricopa and Pinal Counties. Because it is built from recorded deeds, it covers every recorded sale, not just homes listed on ARMLS: new homes, private sales, and investor deals are all included.

It opens on Maricopa and Pinal Counties with everything included. Narrow it with the County, City, and ZIP panels, the Transaction Type, Property Type, and 55+ Communities boxes, and the sale price slider.

The current year’s bar covers only the months recorded so far. DV13 compares every year over the same months. Hover over a bar to see the exact figure for that year.

Dollar Volume by City

About this chart

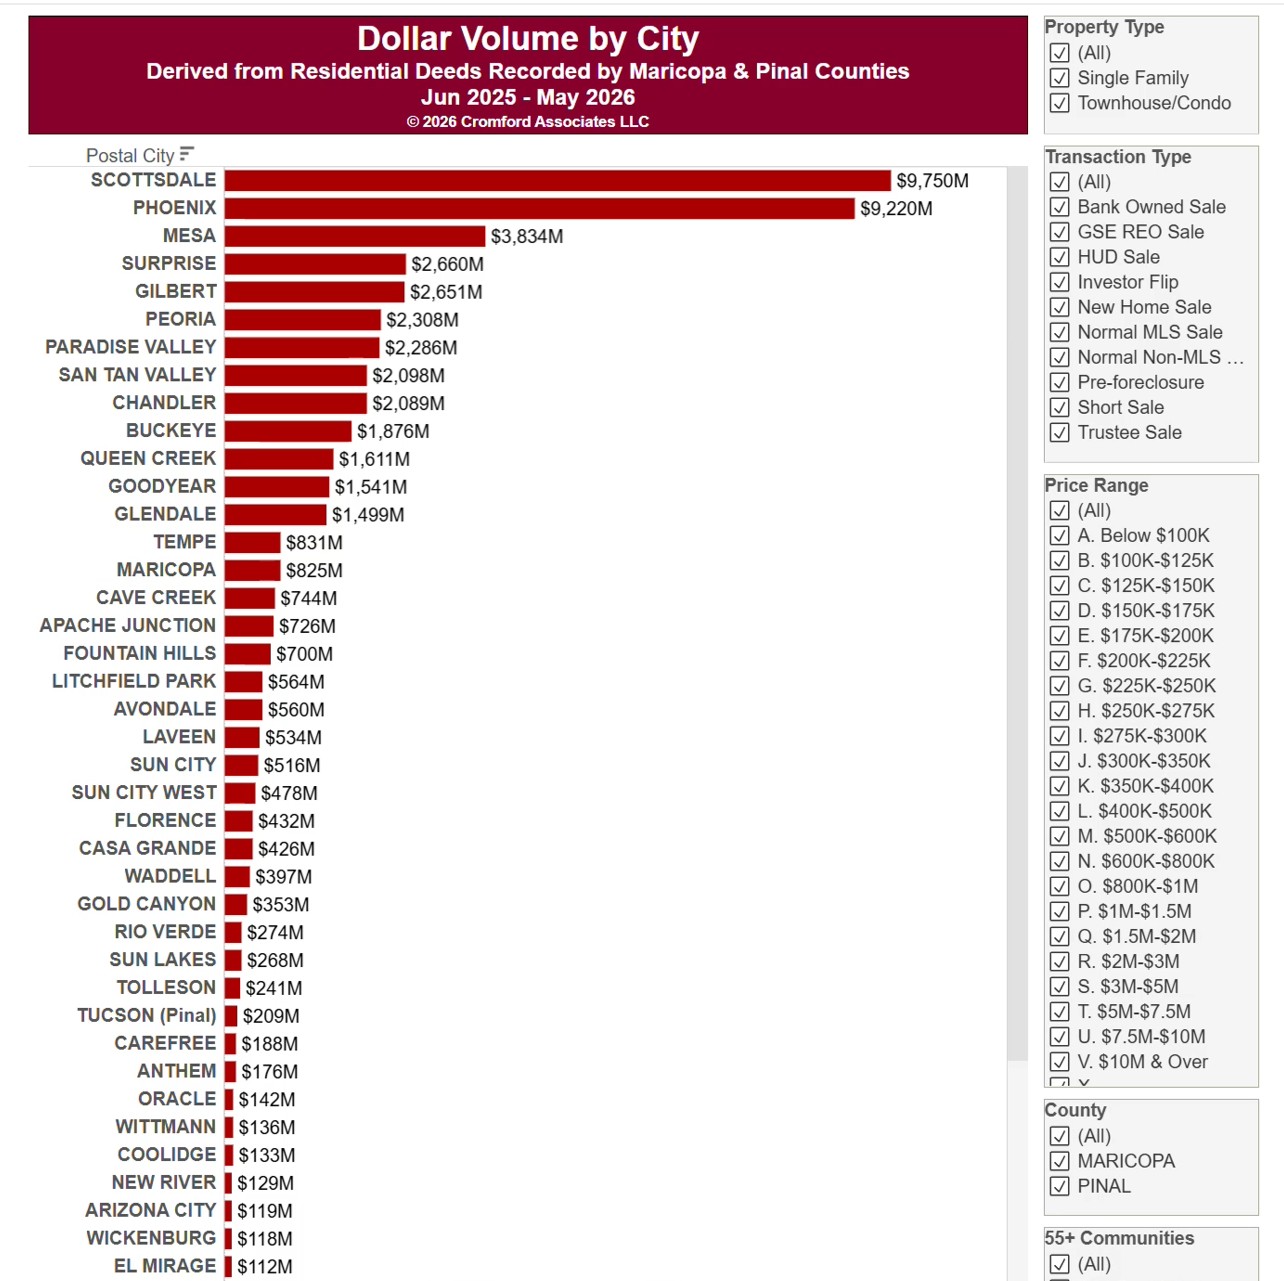
This chart ranks cities by dollar volume, the total value of the homes sold, from residential deeds recorded by Maricopa and Pinal Counties. Because it is built from recorded deeds, it covers every recorded sale, not just homes listed on ARMLS: new homes, private sales, and investor deals are all included.

It opens on the last 12 months of records; use the Recording Month slider to choose the months covered. The list scrolls.

It opens on Maricopa and Pinal Counties with everything included. Narrow it with the County and City panels, the Transaction Type, Property Type, and 55+ Communities boxes, and the sale price slider.

Hover over a bar to see the exact figure for that city.

Multi-Family Permits – Quarterly Counts

About this chart

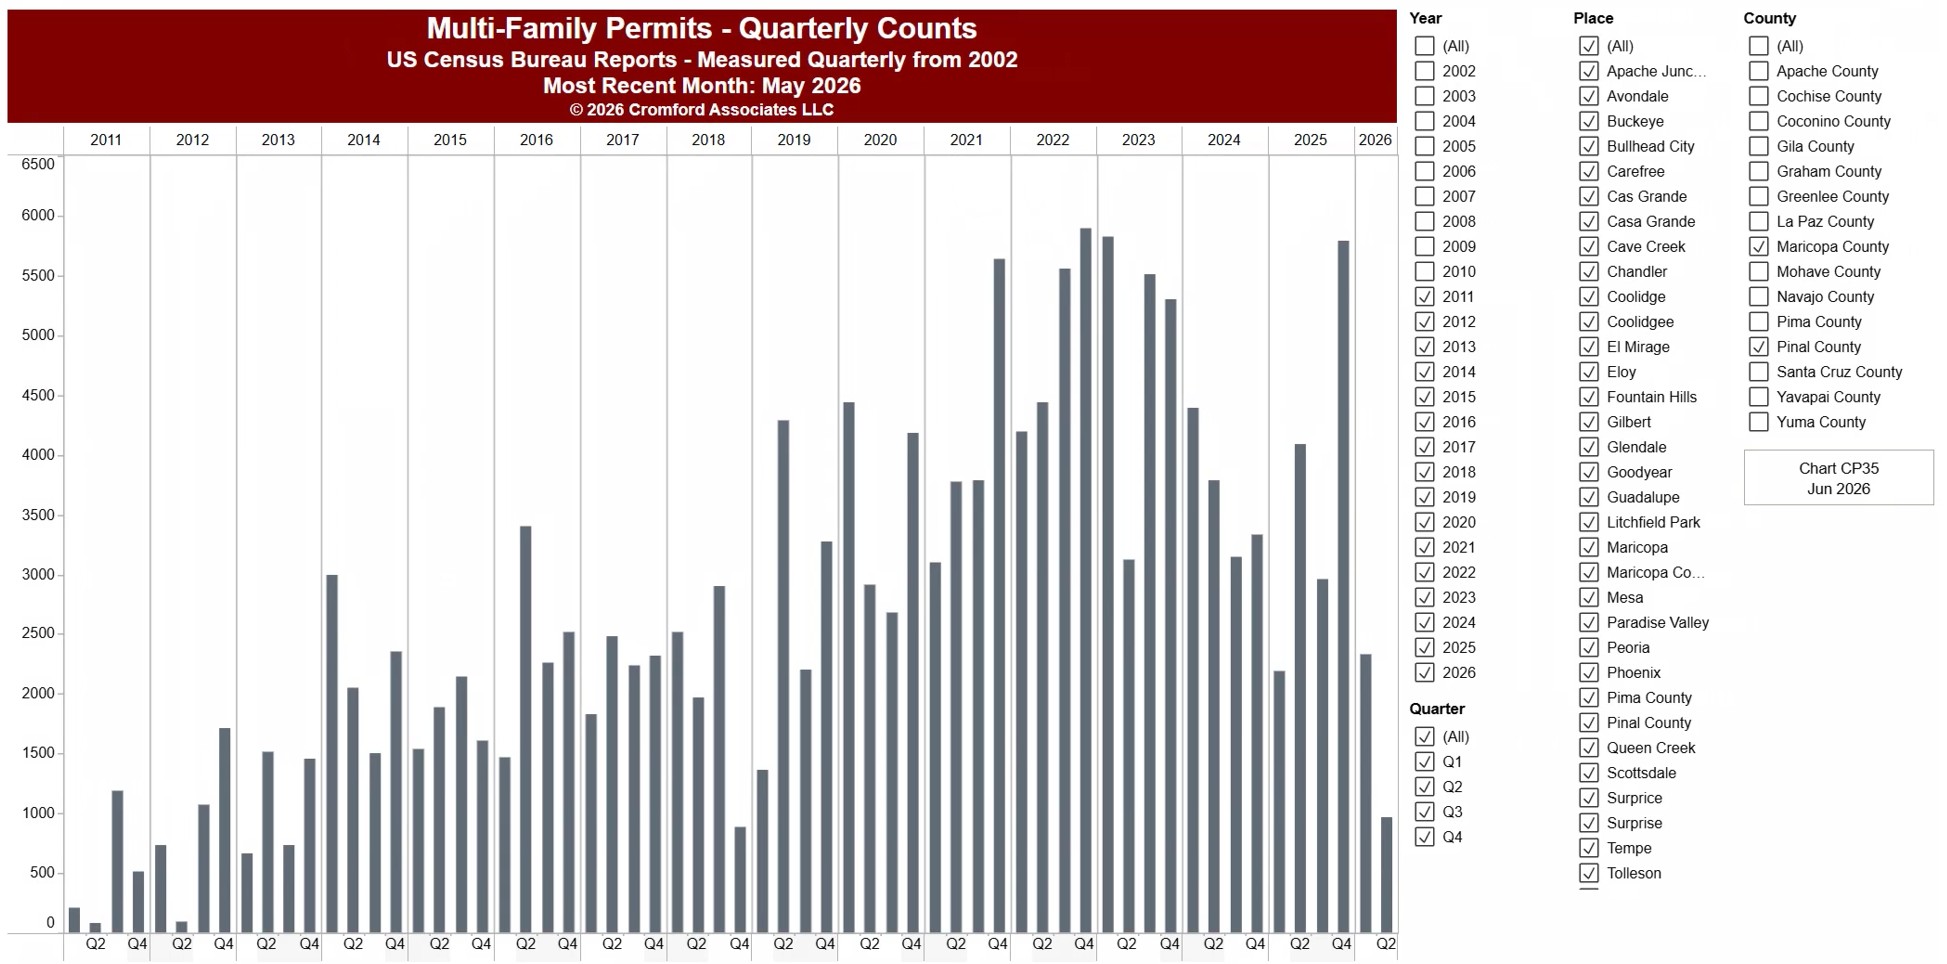
This chart shows the number of multi-family homes (apartments, condos, and other units in buildings with more than one home) authorized by building permits, from the US Census Bureau’s Building Permits Survey. Each bar is the total for one calendar quarter. The newest quarter may cover only the months published so far.

It opens on Arizona with Maricopa and Pinal Counties and every city and town in them, from 2017 onwards. Choose any US state from the State list, pick counties and places, and use the Date range control to look back as far as 1996. The most recent month available is shown under the title.

Permits are an early sign of new construction, so this shows how much new multi-family housing is on the way. Hover over a bar to see its value.