About this chart
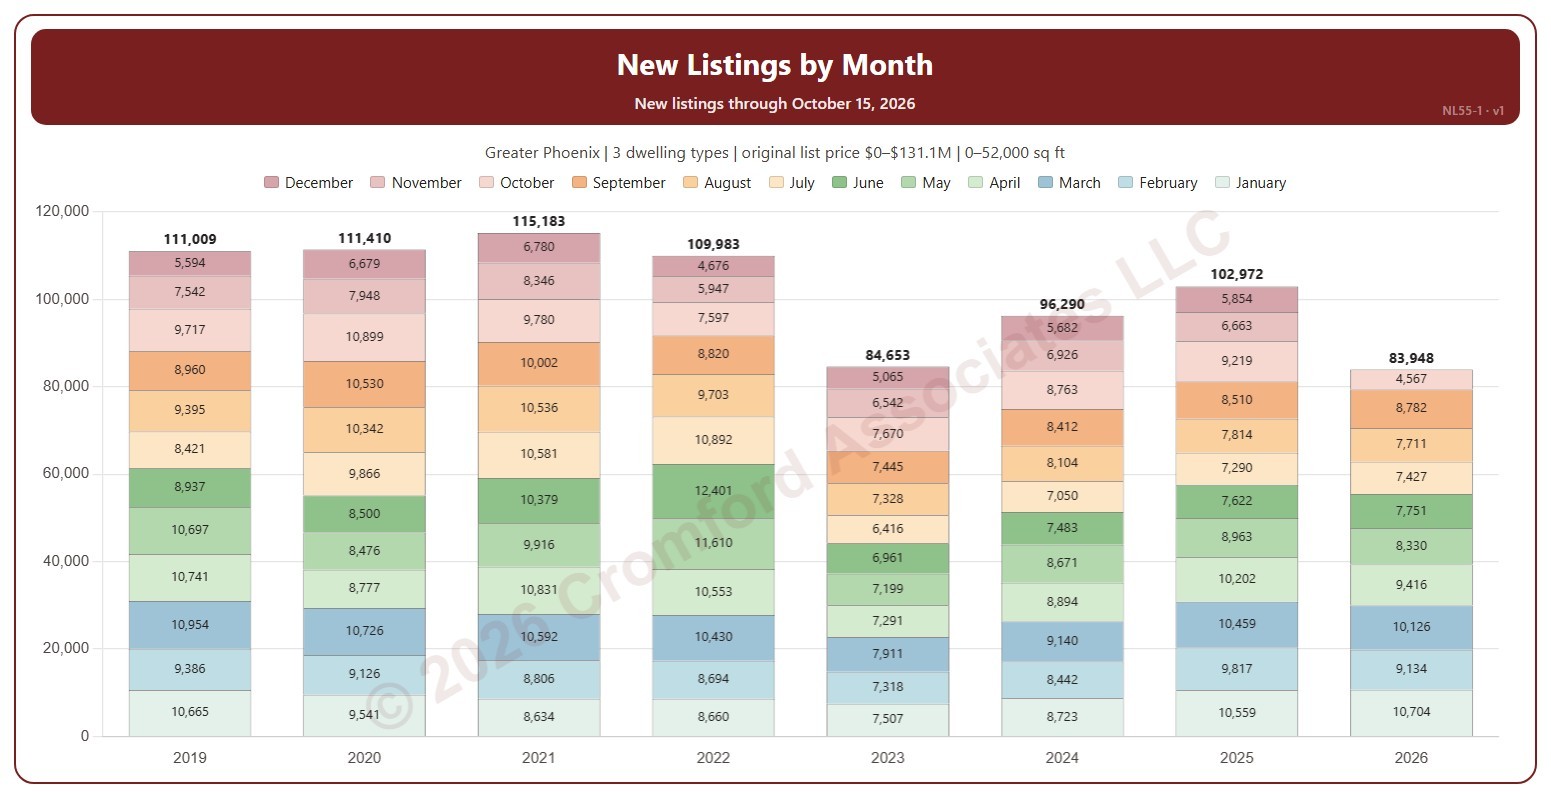
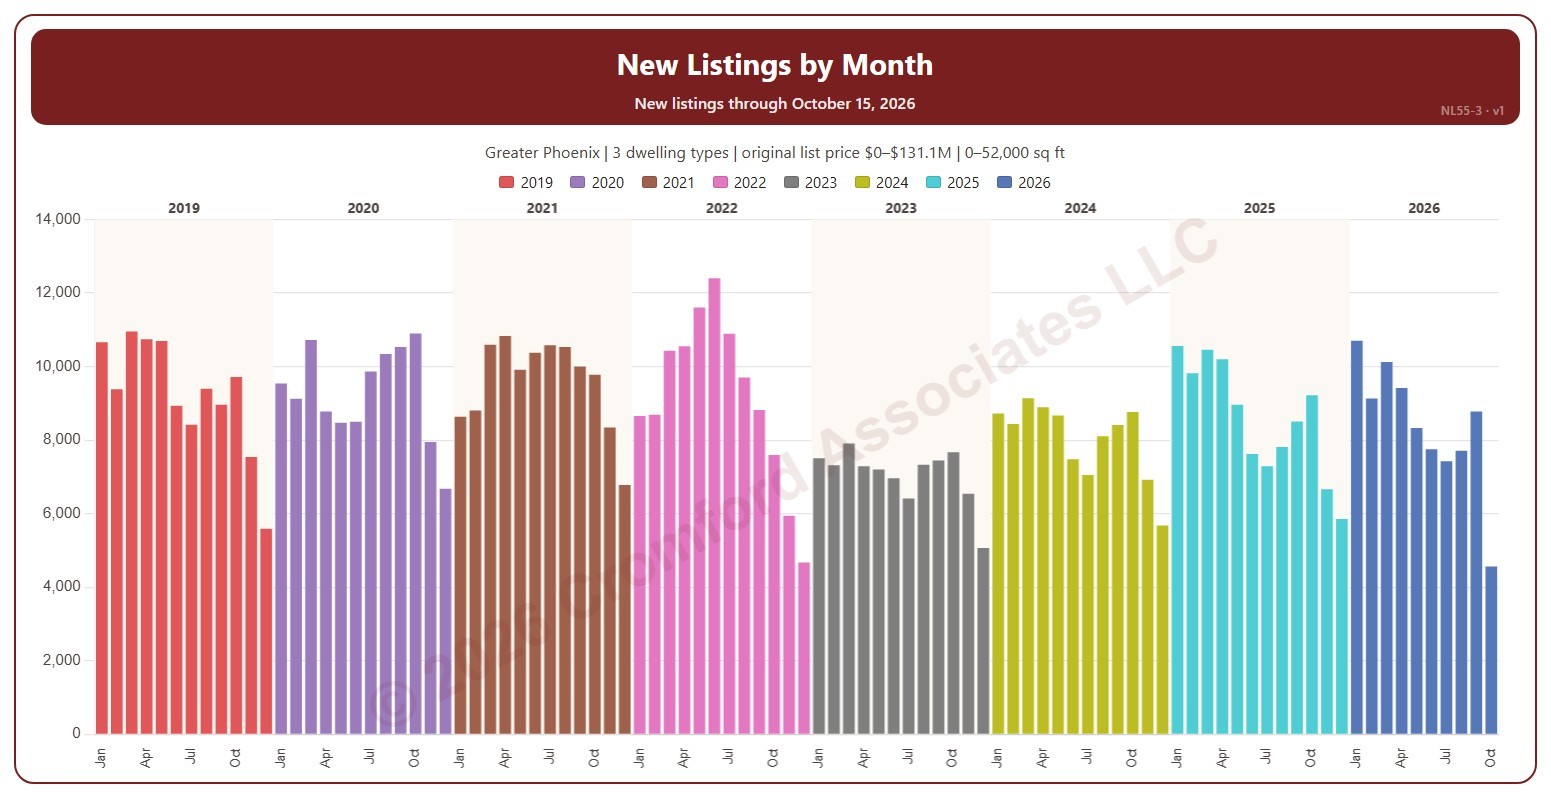
This chart shows the number of new listings each month, the bars colored by year. A new listing is any listing on ARMLS, counted on the date it was listed, whatever happened to it afterwards (sold, expired, cancelled, or still for sale).
It opens on the latest 8 years; tick other years in the Year box to go back as far as 2001, and use the Month box to show only some months of the year. The current month is the month so far. The chart is updated every day.
It opens on the Greater Phoenix area: the counties, cities, and ZIP codes that make it up are ticked to start with. Tick or untick any of them to change the area, including counties beyond Greater Phoenix. Narrow it further with the Dwelling Type, Transaction Type, and New / Resale boxes and the original list price, home size, and year built sliders.
Hover over a bar to see the month’s count.