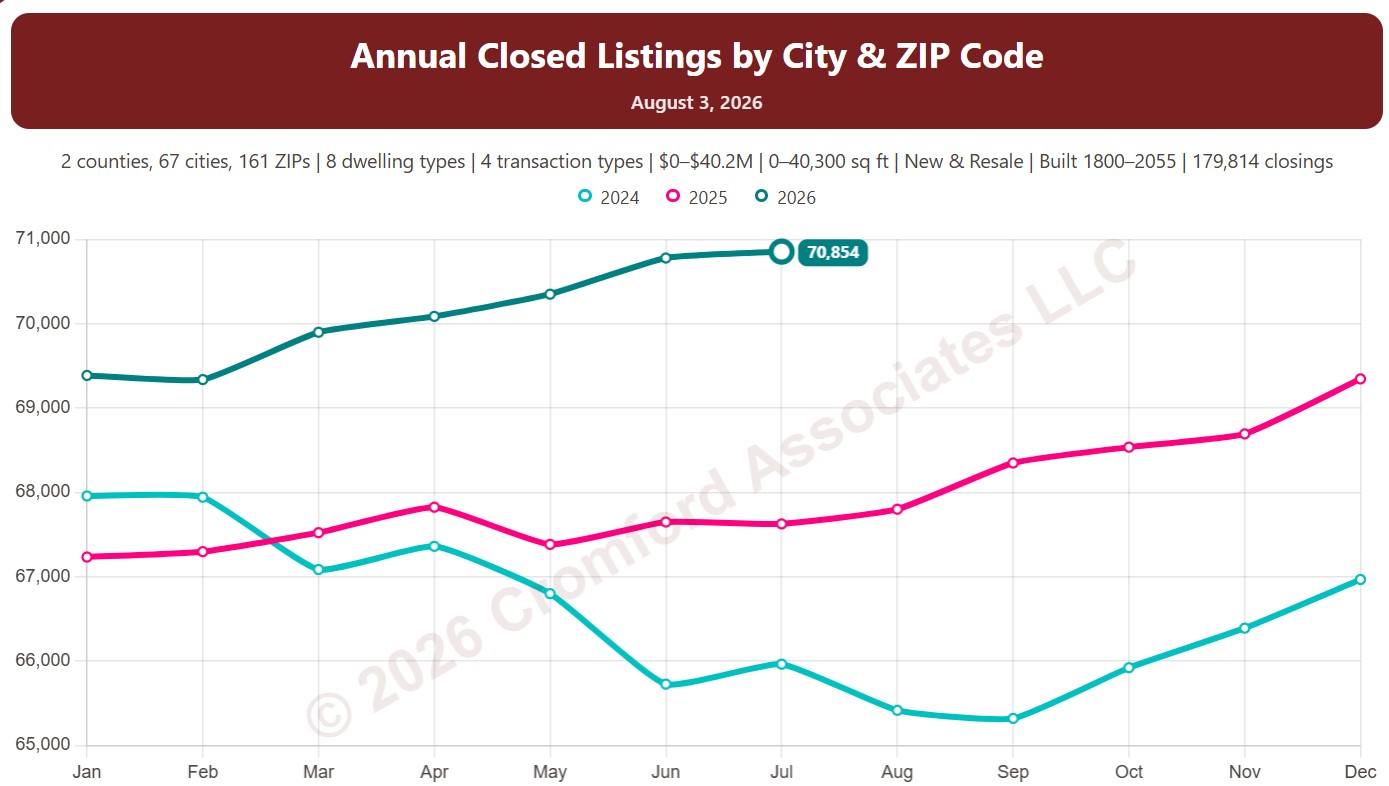
Annual Closed Sales by City and ZIP Code

About this chart

This chart counts the homes that closed through ARMLS over the last 12 months, measured on the 1st of every month, which smooths out the seasonal swings.

Each year has its own line, laid out by month of the year, so you can compare this year with earlier years at the same point in the season. It opens on the last three years; tick any year back to 2001 in the Year panel.

It opens on Maricopa and Pinal Counties with every city and ZIP code included. Use the County, City, and ZIP panels to focus on any area, from a whole county down to a single ZIP code. Narrow it with the Dwelling Type, Transaction Type, and New / Resale boxes and the sales price, home size, and year built sliders.

Hover over a line to see the exact figure for that month.
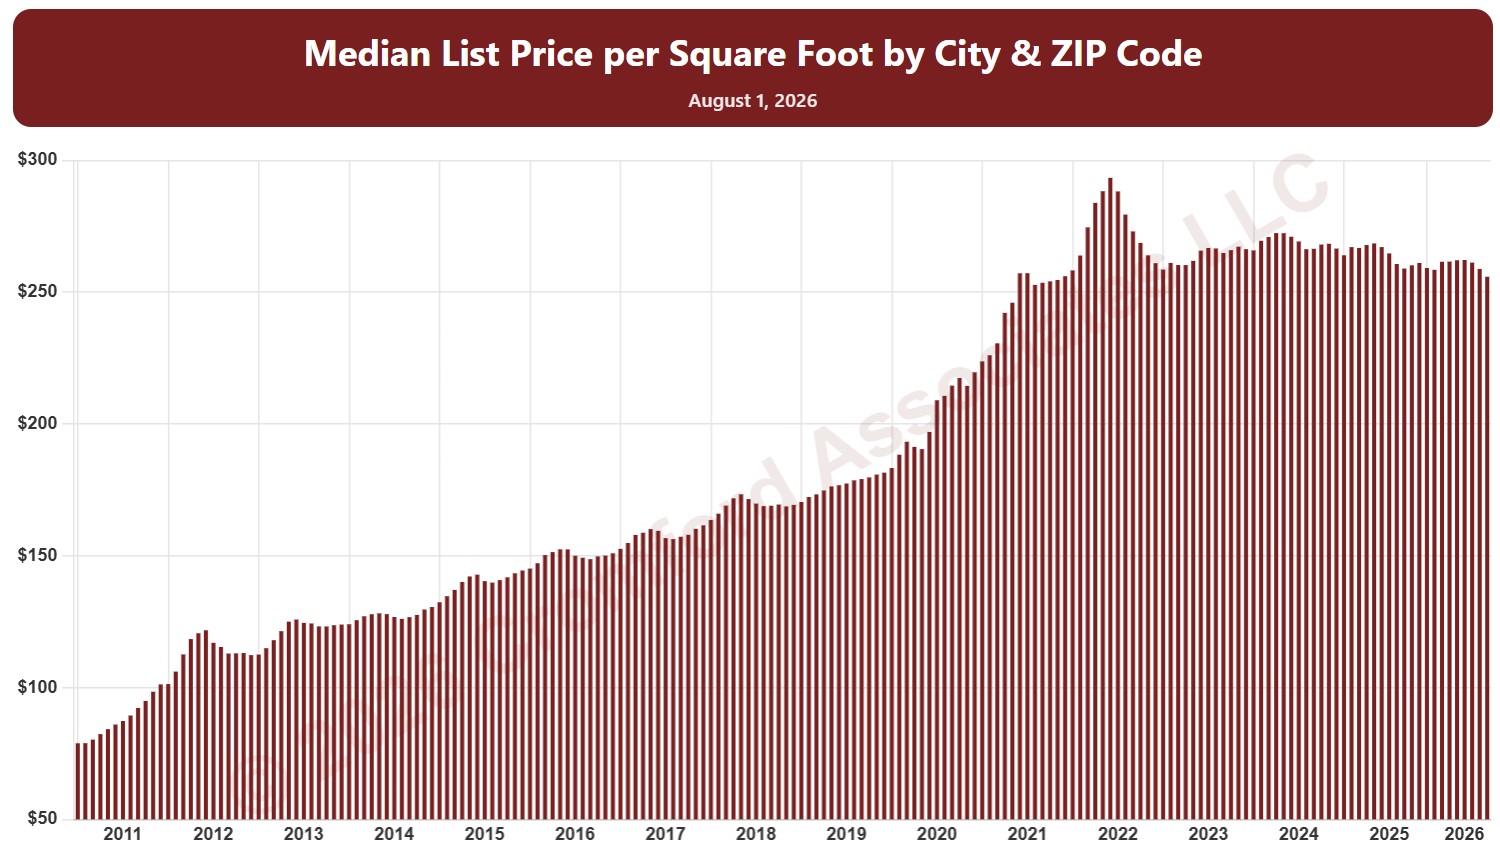
Median List Price per Square Foot by City and ZIP Code

About this chart

This chart shows the median list price per square foot of homes listed on ARMLS, measured on the 1st of every month since January 2011, as one bar per month. It shows what sellers are asking.

By default it covers Active listings. Tick Coming Soon, Pending, UCB / CCBS, or Temp Off Market in the List Status panel to look at those listings instead or as well.

It opens on Maricopa and Pinal Counties with every city and ZIP code included. Use the County, City, and ZIP panels to focus on any area, from a whole county down to a single ZIP code. Narrow it with the Dwelling Type, Transaction Type, List Status, and New / Resale boxes and the list price, home size, and year built sliders. The Inflation (CPI) option restates prices in today’s dollars using national or Phoenix inflation. Use the date slider, or Full range, to choose the stretch of history shown.

Hover over a bar to see the exact figure for that month.
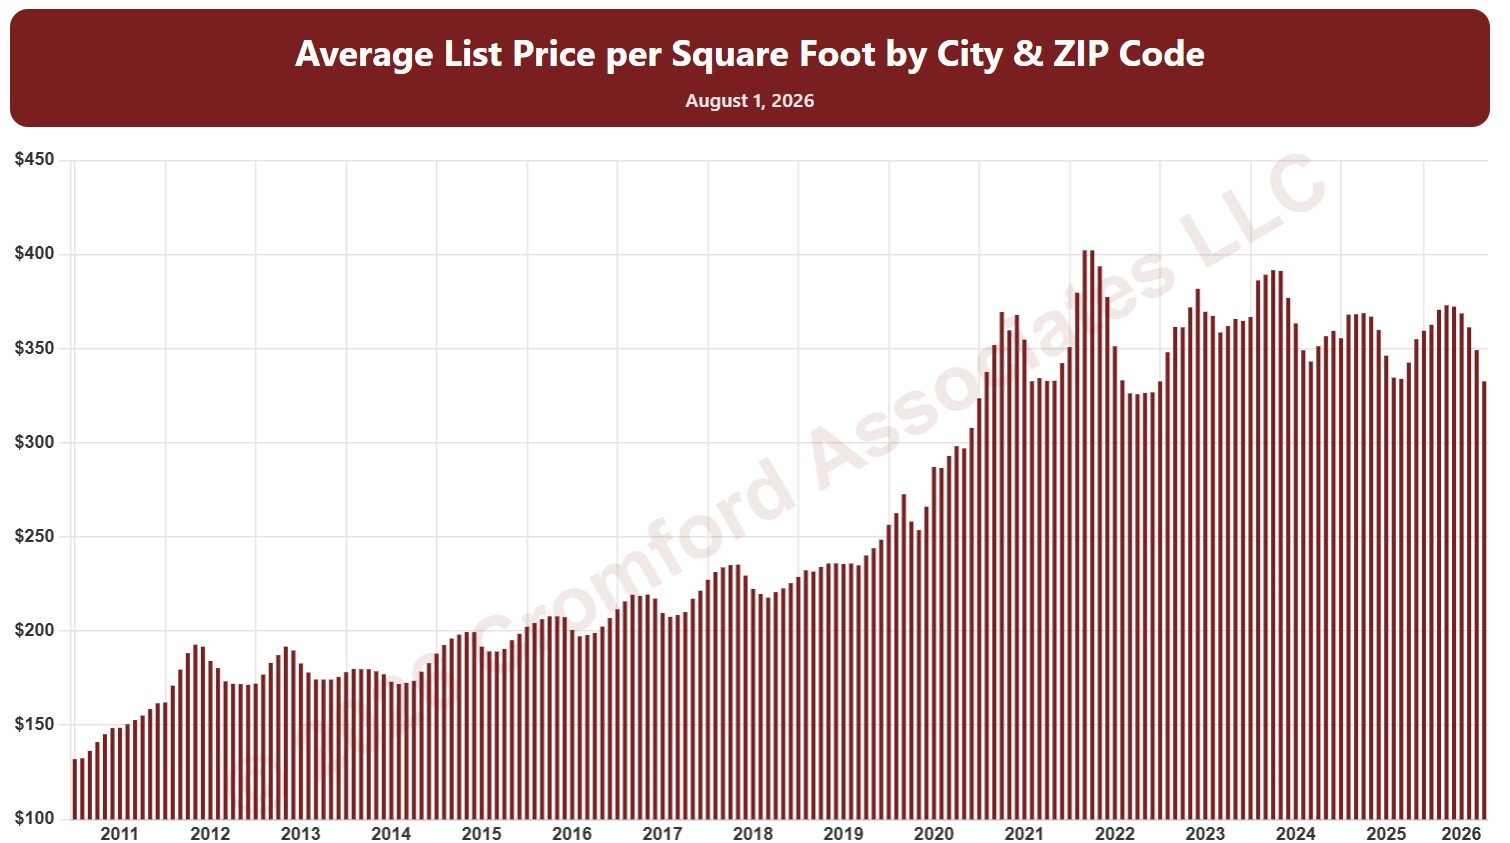
Average List Price per Square Foot by City and ZIP Code

About this chart

This chart shows the average list price per square foot of homes listed on ARMLS, measured on the 1st of every month since January 2011, as one bar per month. It shows what sellers are asking.

By default it covers Active listings. Tick Coming Soon, Pending, UCB / CCBS, or Temp Off Market in the List Status panel to look at those listings instead or as well.

It opens on Maricopa and Pinal Counties with every city and ZIP code included. Use the County, City, and ZIP panels to focus on any area, from a whole county down to a single ZIP code. Narrow it with the Dwelling Type, Transaction Type, List Status, and New / Resale boxes and the list price, home size, and year built sliders. The Inflation (CPI) option restates prices in today’s dollars using national or Phoenix inflation. Use the date slider, or Full range, to choose the stretch of history shown.

Hover over a bar to see the exact figure for that month.
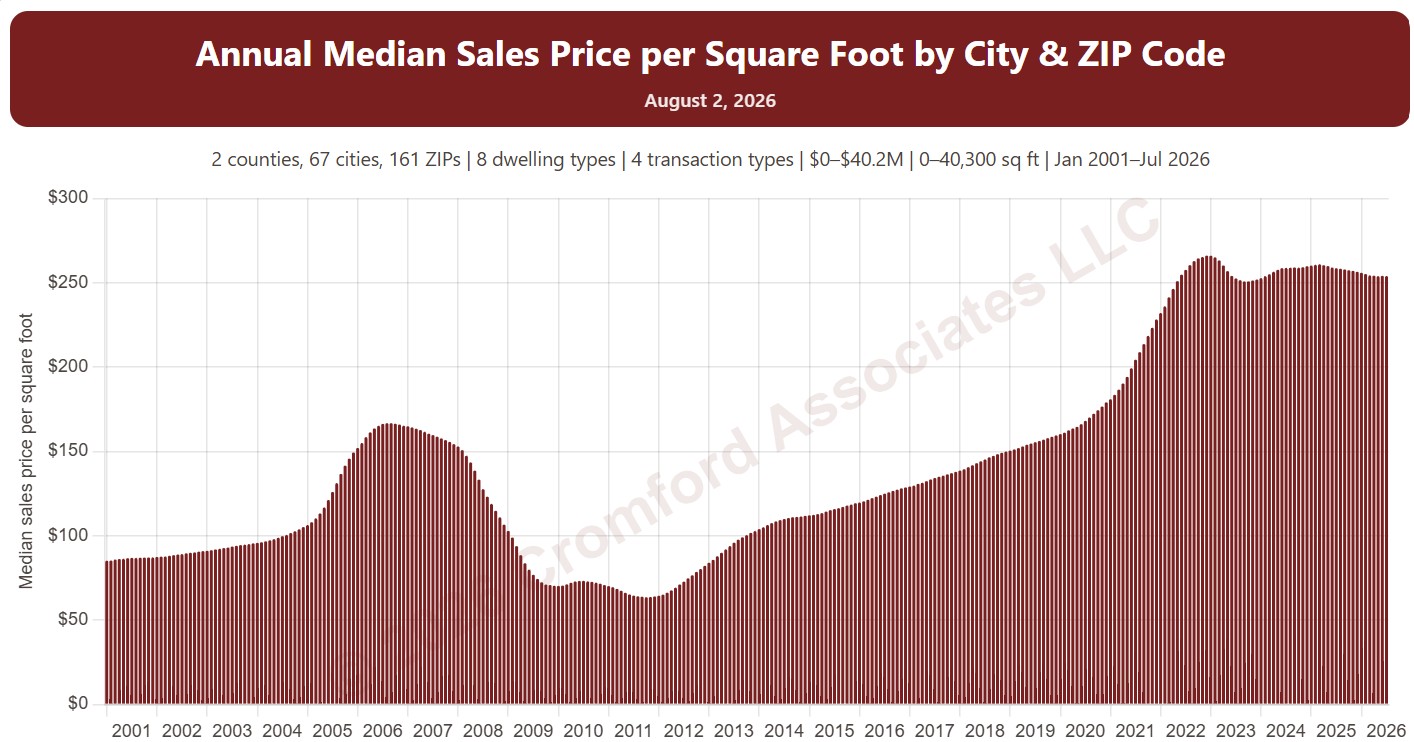
Annual Median Sales Price per Square Foot by City and ZIP Code

About this chart

This chart shows the median sales price per square foot over the 12 months up to each month, as one bar per month from January 2001. Price per square foot lets you compare homes of different sizes; the median is the figure in the middle, so a few unusual sales move it less than an average.

It opens on Maricopa and Pinal Counties with every city and ZIP code included. Use the County, City, and ZIP panels to focus on any area, from a whole county down to a single ZIP code. Narrow it with the Dwelling Type, Transaction Type, and New / Resale boxes and the sale price, home size, and year built sliders. The Inflation (CPI) option restates prices in today’s dollars using national or Phoenix inflation. Use the date slider, or Full range, to choose the stretch of history shown.

Hover over a bar to see the exact figure for that month.
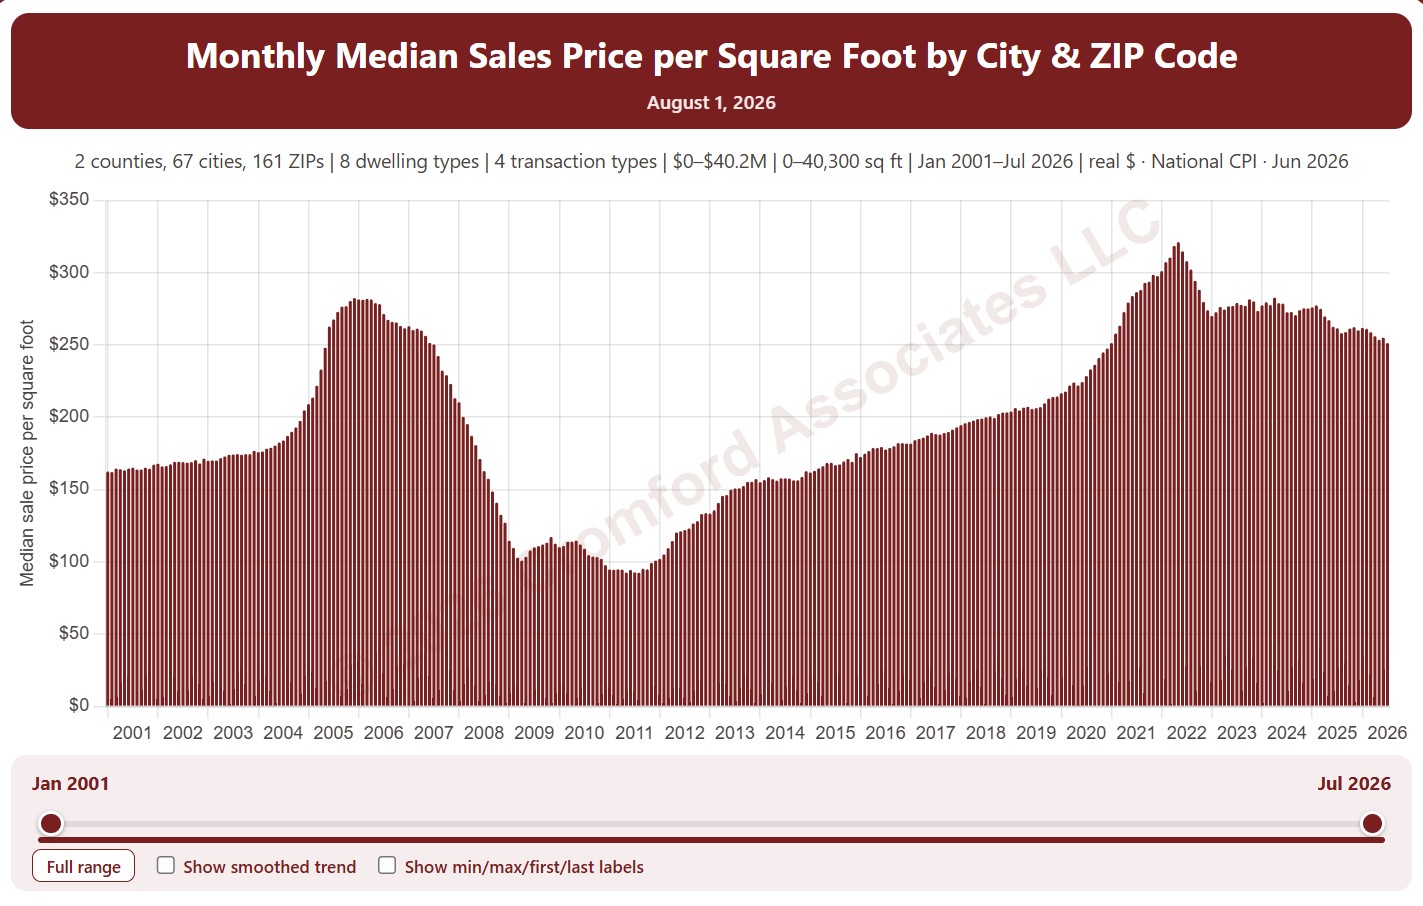
Monthly Median Sales Price per Square Foot by City and ZIP Code

About this chart

This chart shows the median sales price per square foot of the homes that closed in each month, as one bar per month from January 2001. Price per square foot lets you compare homes of different sizes; the median is the figure in the middle, so a few unusual sales move it less than an average.

It opens on Maricopa and Pinal Counties with every city and ZIP code included. Use the County, City, and ZIP panels to focus on any area, from a whole county down to a single ZIP code. Narrow it with the Dwelling Type, Transaction Type, and New / Resale boxes and the sale price, home size, and year built sliders. The Inflation (CPI) option restates prices in today’s dollars using national or Phoenix inflation. Use the date slider, or Full range, to choose the stretch of history shown.

Hover over a bar to see the exact figure for that month.
Cromford® Days on Market vs. Price Discount by City and ZIP Code

About this chart

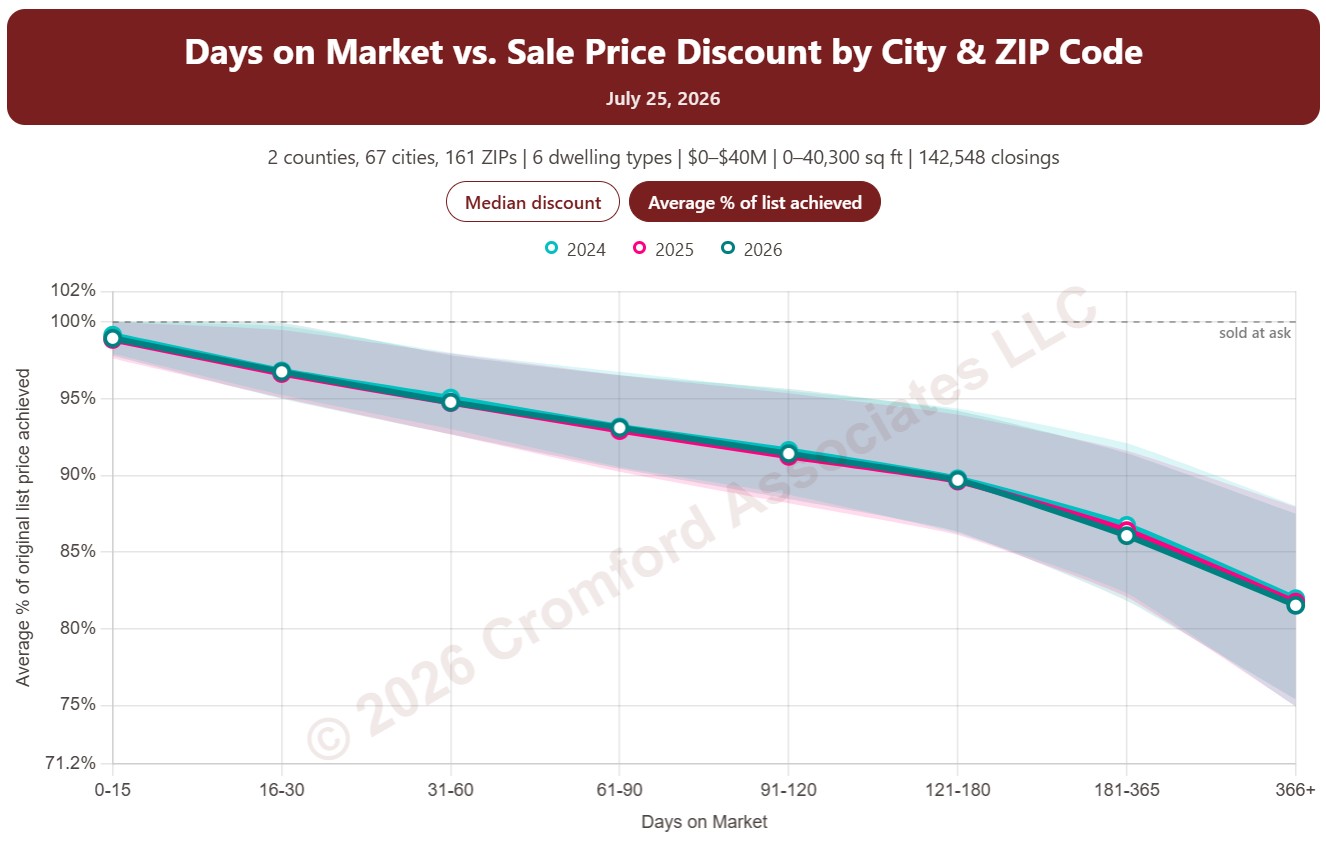
This chart shows the discount from the original list price that sellers accepted, by how long the home was on the market. Homes that closed are grouped by their Cromford® Days on Market, from 0 to 15 days up to more than a year, and each point is the median discount from the original list price for that group. Each year has its own line, with a shaded band showing the range of the middle half of discounts.

It opens on the last three years; tick any year back to 2011 in the Year panel. The buttons on the chart switch between the median discount and the average percentage of the original list price achieved.

By default the days on market count the time a home was Active. Tick Coming Soon, Pending, or UCB / CCBS under Cromford® Days on Market to add that time as well.

It opens on Maricopa and Pinal Counties with every city and ZIP code included. Use the County, City, and ZIP panels to focus on any area, from a whole county down to a single ZIP code. Narrow it with the Dwelling Type and Transaction Type boxes and the original list price, home size, and year built sliders. Manufactured and modular homes are left out by default.

Annual Appreciation by City and ZIP Code – Based on Monthly Median Sales Price

About this chart

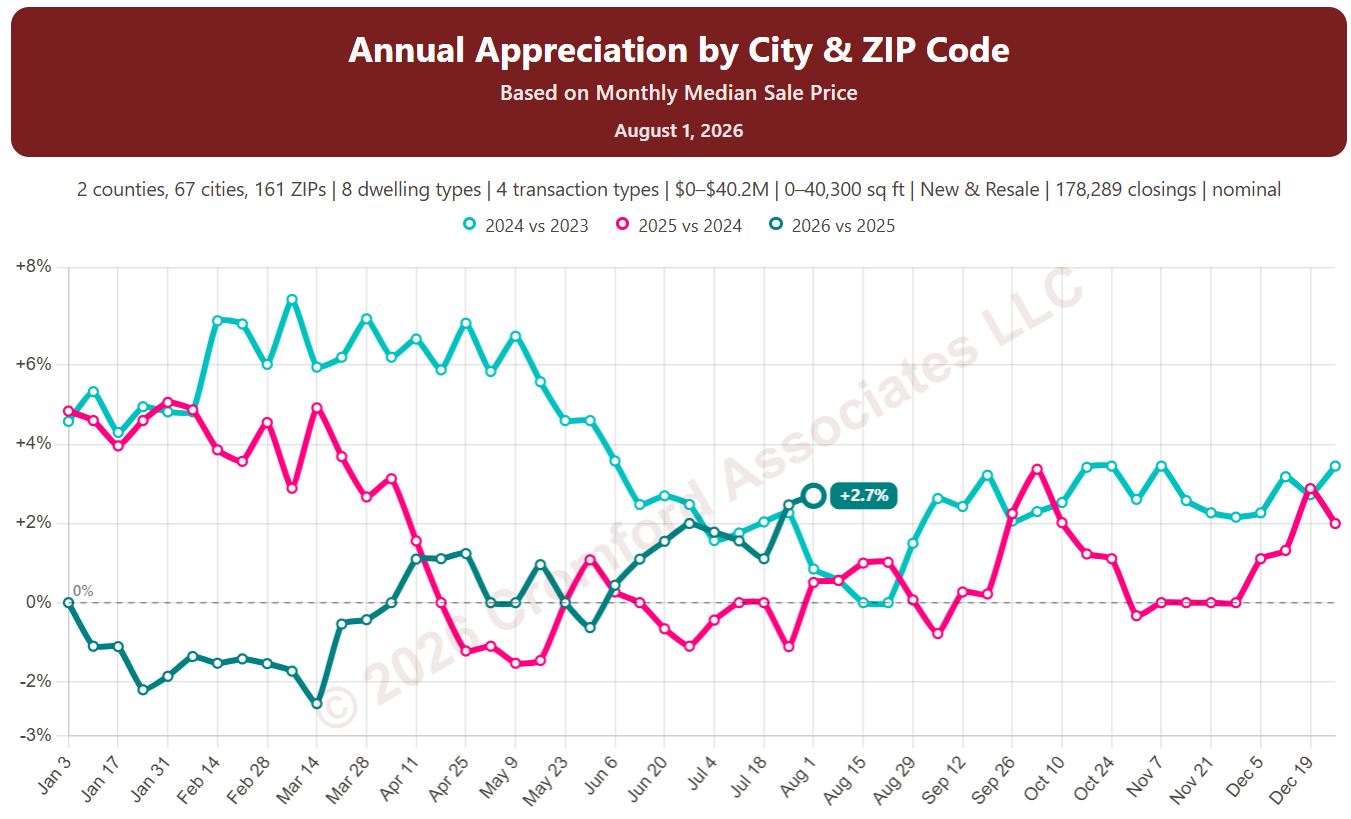
This chart shows annual appreciation: how much prices have changed compared with the same point a year earlier, measured every week. The price compared is the median sales price over the last month (Based on Monthly Median Sale Price). Above zero, prices are higher than a year ago; below zero, they are lower.

Each year has its own line, laid out by week of the year, so you can compare this year with earlier years at the same point in the season. It opens on the last three years; tick any year back to 2002 in the Year panel.

It opens on Maricopa and Pinal Counties with every city and ZIP code included. Use the County, City, and ZIP panels to focus on any area, from a whole county down to a single ZIP code. Narrow it with the Dwelling Type, Transaction Type, and New / Resale boxes and the sales price, home size, and year built sliders. The Inflation (CPI) option compares prices in today’s dollars, using national or Phoenix inflation, so you can see appreciation after inflation.

Hover over a line to see the exact figure for that week.

Annual Appreciation by City and ZIP Code – Based on Annual Median Sales Price

About this chart

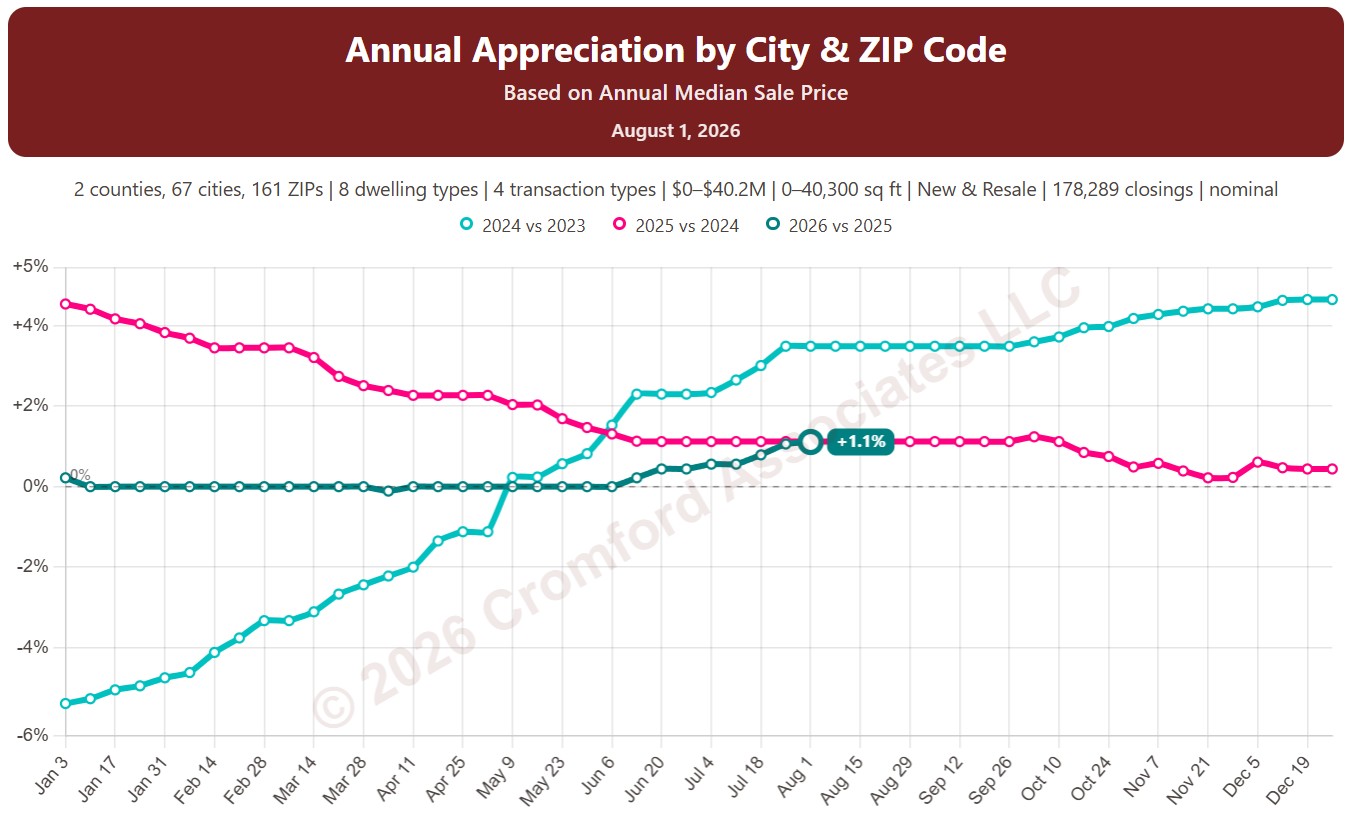
This chart shows annual appreciation: how much prices have changed compared with the same point a year earlier, measured every week. The price compared is the median sales price over the last 12 months (Based on Annual Median Sale Price). Above zero, prices are higher than a year ago; below zero, they are lower.

Each year has its own line, laid out by week of the year, so you can compare this year with earlier years at the same point in the season. It opens on the last three years; tick any year back to 2002 in the Year panel.

It opens on Maricopa and Pinal Counties with every city and ZIP code included. Use the County, City, and ZIP panels to focus on any area, from a whole county down to a single ZIP code. Narrow it with the Dwelling Type, Transaction Type, and New / Resale boxes and the sales price, home size, and year built sliders. The Inflation (CPI) option compares prices in today’s dollars, using national or Phoenix inflation, so you can see appreciation after inflation.

Hover over a line to see the exact figure for that week.

Annual Appreciation by City and ZIP Code – Based on Annual Median Price per Square Foot

About this chart

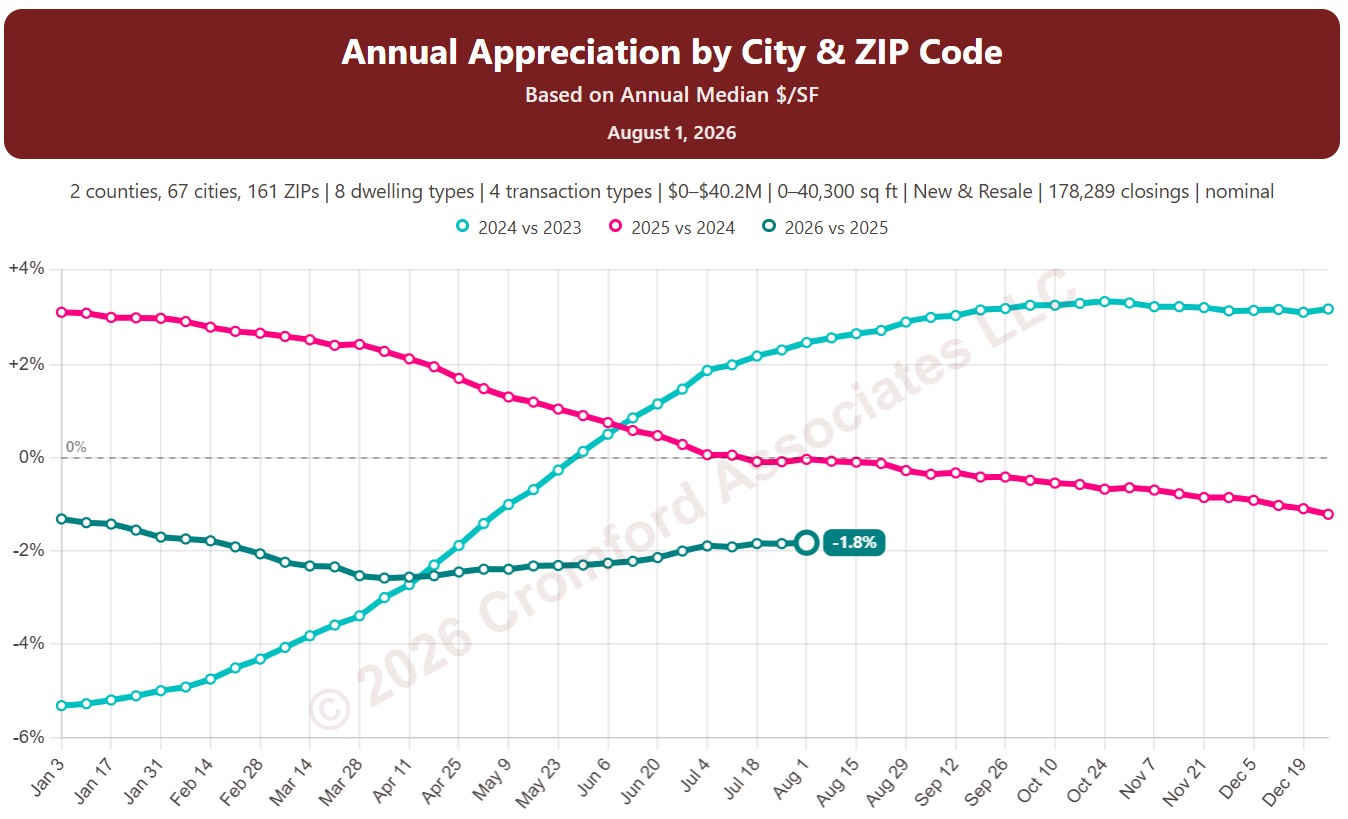
This chart shows annual appreciation: how much prices have changed compared with the same point a year earlier, measured every week. The price compared is the median price per square foot over the last 12 months (Based on Annual Median $/SF). Above zero, prices are higher than a year ago; below zero, they are lower.

Each year has its own line, laid out by week of the year, so you can compare this year with earlier years at the same point in the season. It opens on the last three years; tick any year back to 2002 in the Year panel.

It opens on Maricopa and Pinal Counties with every city and ZIP code included. Use the County, City, and ZIP panels to focus on any area, from a whole county down to a single ZIP code. Narrow it with the Dwelling Type, Transaction Type, and New / Resale boxes and the sales price, home size, and year built sliders. The Inflation (CPI) option compares prices in today’s dollars, using national or Phoenix inflation, so you can see appreciation after inflation.

Hover over a line to see the exact figure for that week.