Active Listings by Region

About this chart

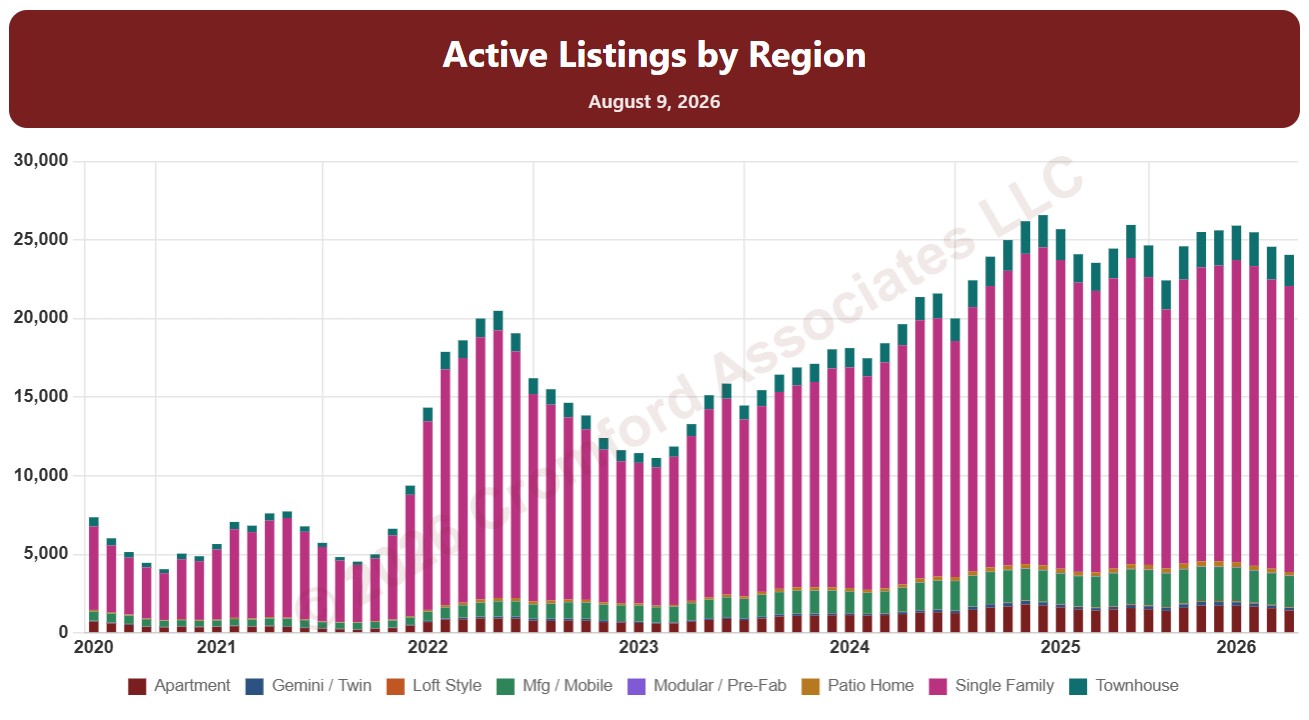
This chart counts the homes listed for sale on ARMLS on the 1st of every month since January 2011, as stacked bars.

By default it counts Active listings. Tick Coming Soon, UCB / CCBS (under contract but still accepting back-up offers), or Temp Off Market in the List Status panel to add them to the stack. A drop-down chooses what the bars are split by: list status, dwelling type, transaction type, or new / resale.

It opens with every region included. Use the Region panel to focus on one region or compare a combination of them. Narrow it with the Dwelling Type, List Status, Transaction Type, and New / Resale boxes and the list price, home size, year built, and days on market sliders. Use the date slider, or Full range, to choose the stretch of history shown.

Hover over a bar to see the counts for that month.
Active Listings by City and ZIP Code

About this chart

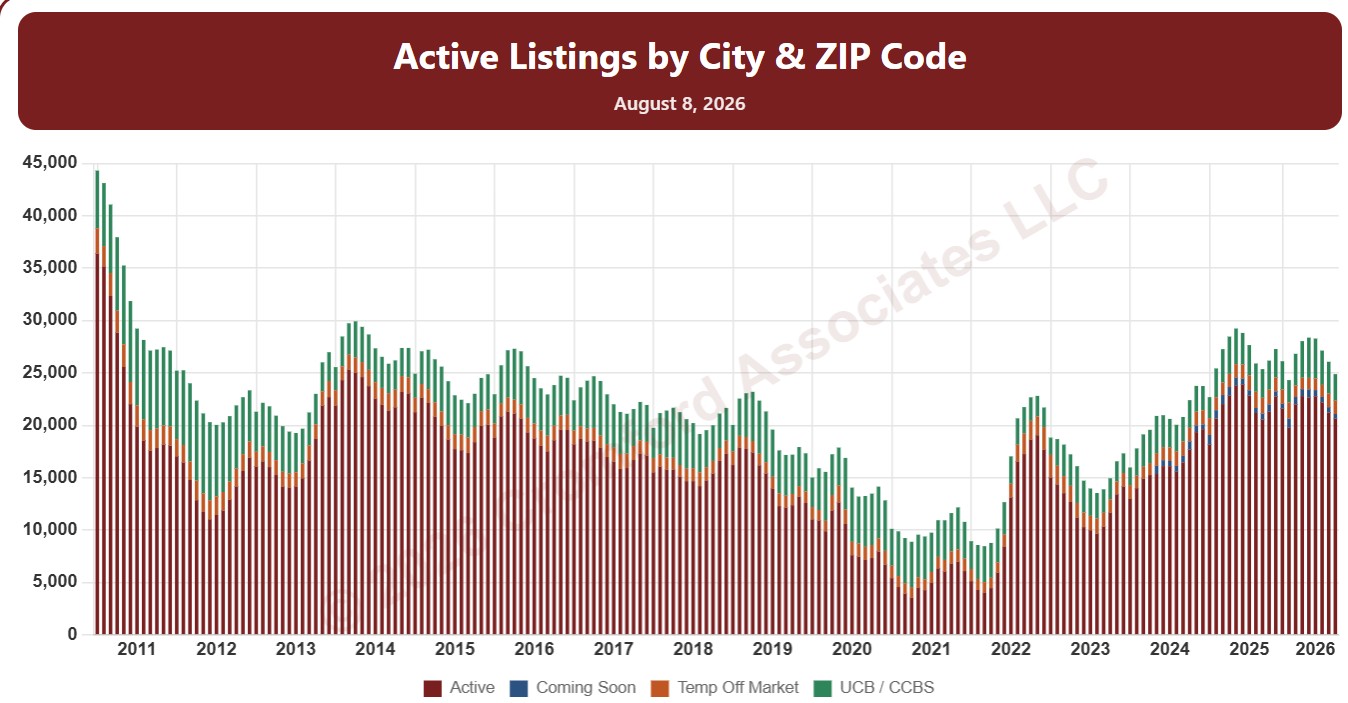
This chart counts the homes listed for sale on ARMLS on the 1st of every month since January 2011, as stacked bars.

By default it counts Active listings. Tick Coming Soon, UCB / CCBS (under contract but still accepting back-up offers), or Temp Off Market in the List Status panel to add them to the stack. A drop-down chooses what the bars are split by: list status, dwelling type, transaction type, or new / resale.

It opens on Maricopa and Pinal Counties with every city and ZIP code included. Use the County, City, and ZIP panels to focus on any area, from a whole county down to a single ZIP code. Narrow it with the Dwelling Type, List Status, Transaction Type, and New / Resale boxes and the list price, home size, year built, and days on market sliders. Use the date slider, or Full range, to choose the stretch of history shown.

Hover over a bar to see the counts for that month.
Active Listings Map

About this chart

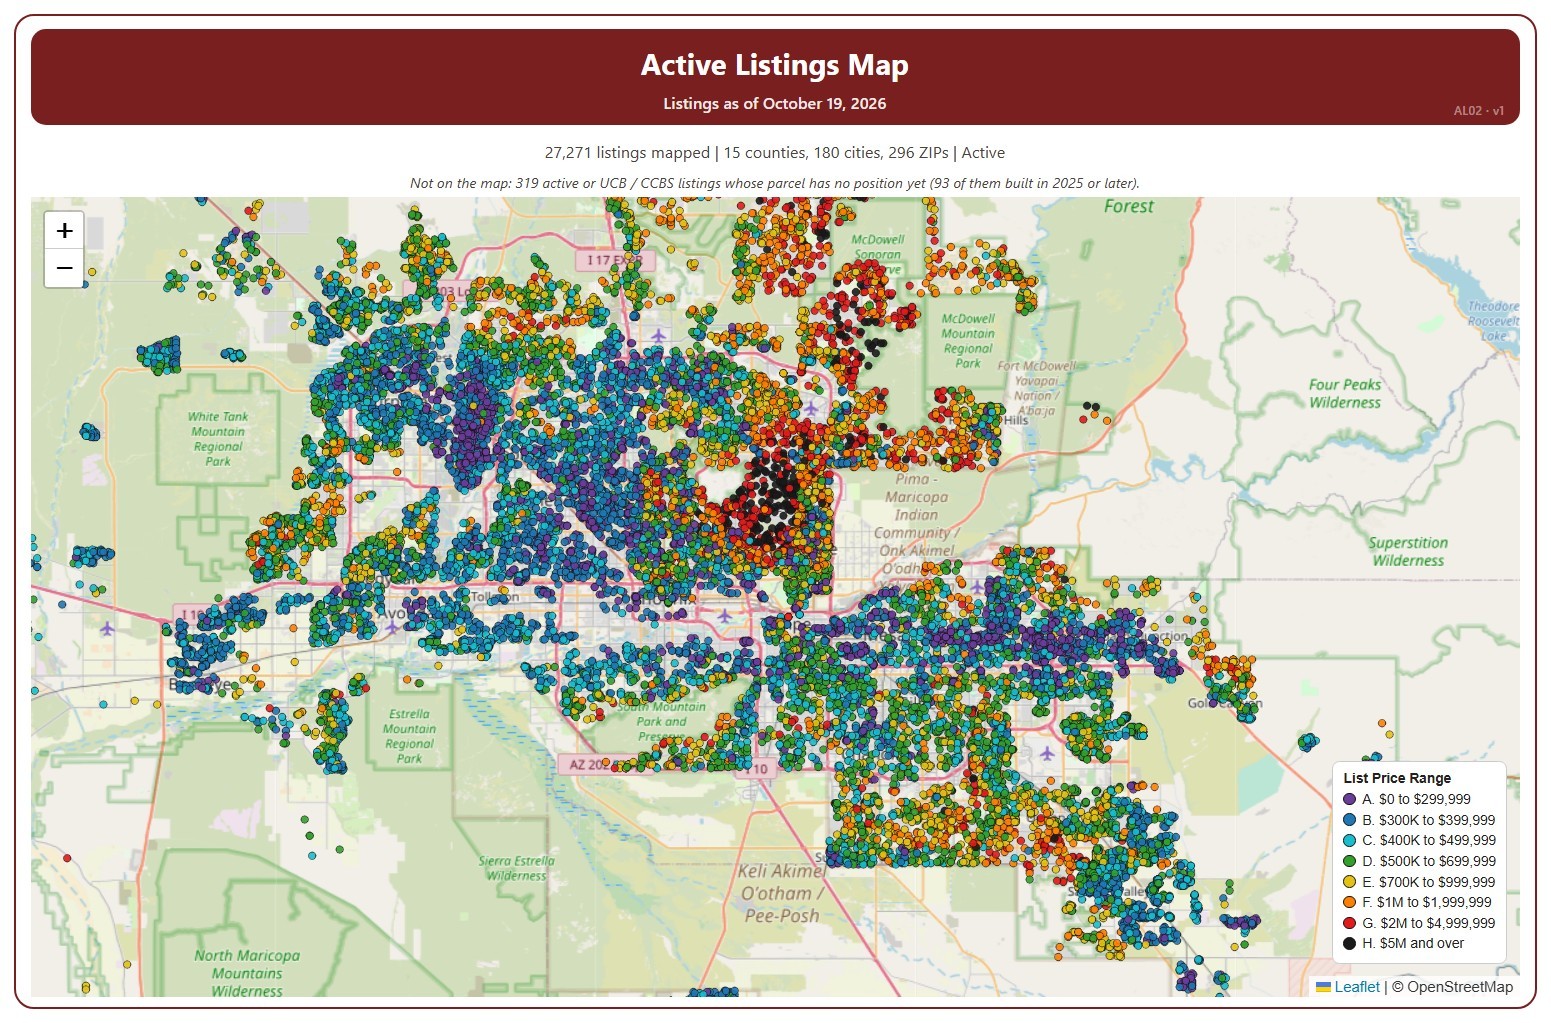
This map shows every home listed for sale or coming soon on ARMLS across Arizona today, one dot per listing, coloured by its list price range, from A (under $300,000) to H ($5 million and over).

It opens on Active and Coming Soon listings in every county; tick UCB / CCBS in the Status box to add listings under contract with a contingency. Tick or untick counties, cities, and ZIP codes to change the area, and use the Price Range boxes to show or hide a range. The map is updated every day.

Narrow it further with the Dwelling Type, Transaction Type, and New / Resale boxes and the list price, home size, year built, and days on market sliders. A listing whose parcel has no map position yet is not shown; the note above the map says how many.

Hover over a dot to see the address, list price, status, dwelling and transaction type, size, year built, days on market, and listing office.

Active Listing Weekly Counts – Compared by Year

About this chart

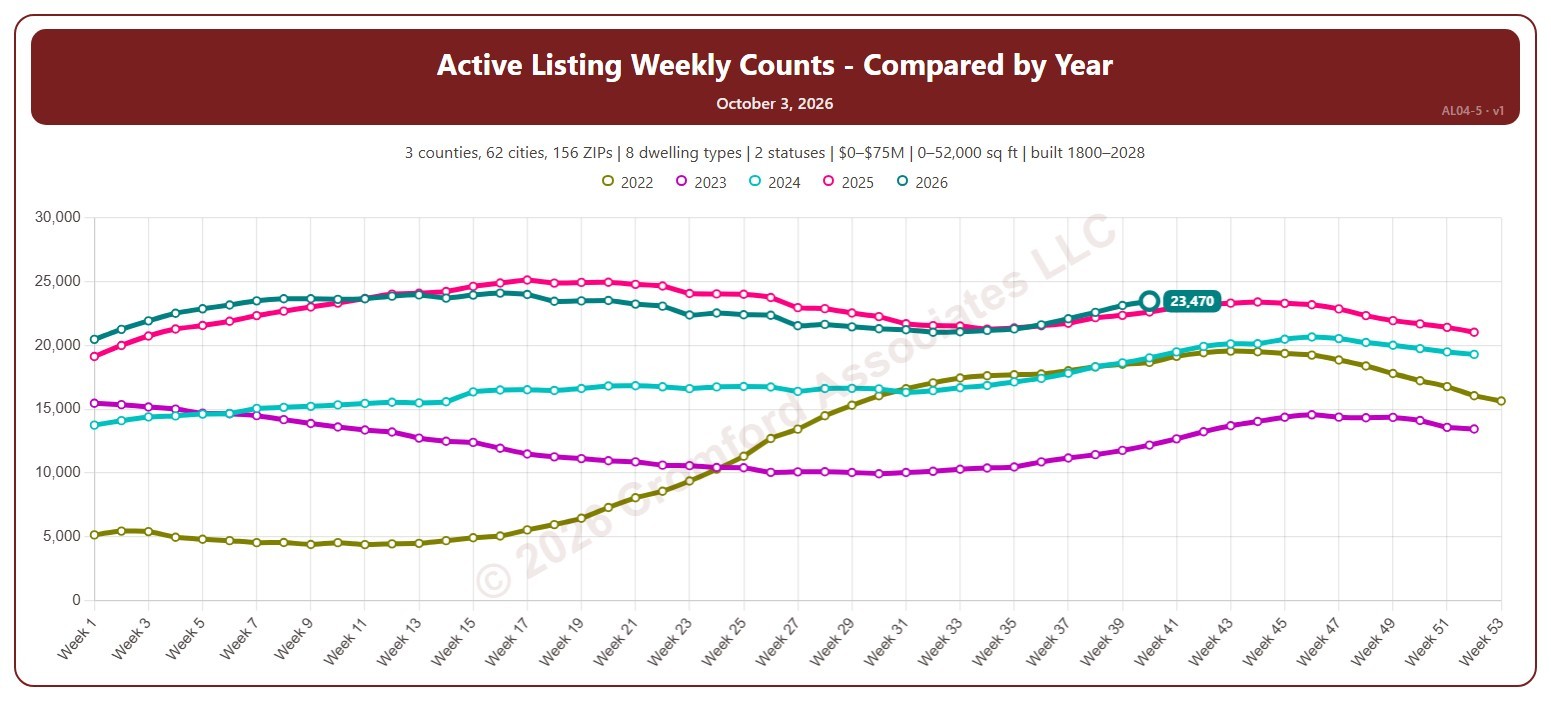
This chart counts the homes listed for sale on ARMLS each week (on Saturdays), with one line per year laid out by week of the year, so you can compare this year with earlier years at the same point in the season.

By default it counts Active and Coming Soon listings; tick UCB / CCBS (under contract but still accepting back-up offers) or Temp Off Market in the List Status panel to include them. It opens on the last five years; tick any year back to 2011 in the Year panel.

It opens on the Greater Phoenix area: the counties, cities, and ZIP codes that make it up are ticked to start with. Tick or untick any of them to change the area, including counties beyond Greater Phoenix. Narrow it further with the Dwelling Type, List Status, Transaction Type, and New / Resale boxes and the list price, home size, year built, and days on market sliders.

Hover over the chart to see the figures for that week.

Year-over-Year Percent Change in Supply

About this chart

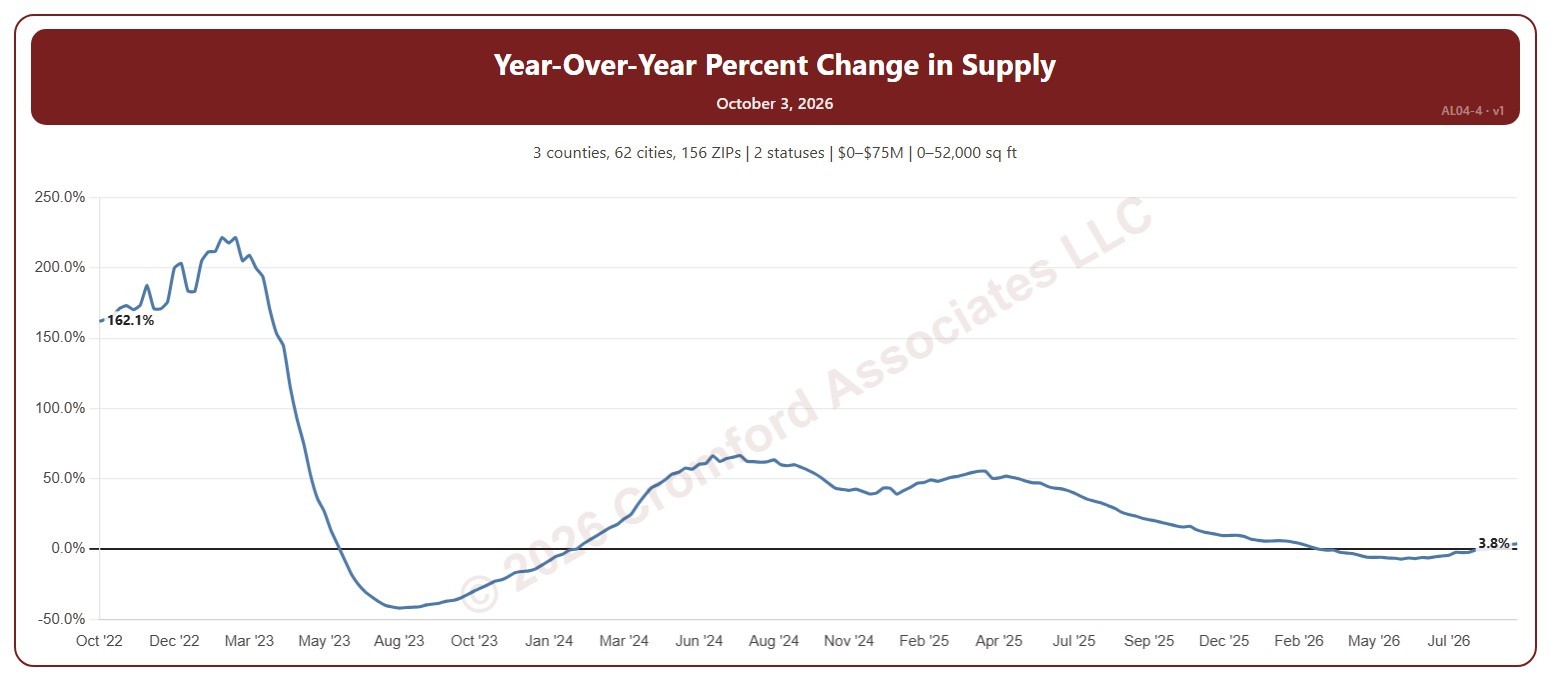
This chart shows the year-over-year change in supply: the number of homes for sale on ARMLS each Saturday compared with the same week a year earlier, as a percentage. Above zero, there is more inventory than a year ago, which gives buyers more choice; below zero, less.

By default it counts Active and Coming Soon listings; tick UCB / CCBS (under contract but still accepting back-up offers) or Temp Off Market in the List Status panel to include them. It opens on the last four years; use the Period panel to show the last 2 or 8 years, everything since 2011, or chosen years.

It opens on the Greater Phoenix area: the counties, cities, and ZIP codes that make it up are ticked to start with. Tick or untick any of them to change the area, including counties beyond Greater Phoenix. Narrow it further with the Dwelling Type, List Status, Transaction Type, and New / Resale boxes and the list price, home size, year built, and days on market sliders.

Hover over the chart to see the figures for that week.

Median List Price by Square Foot Range

About this chart

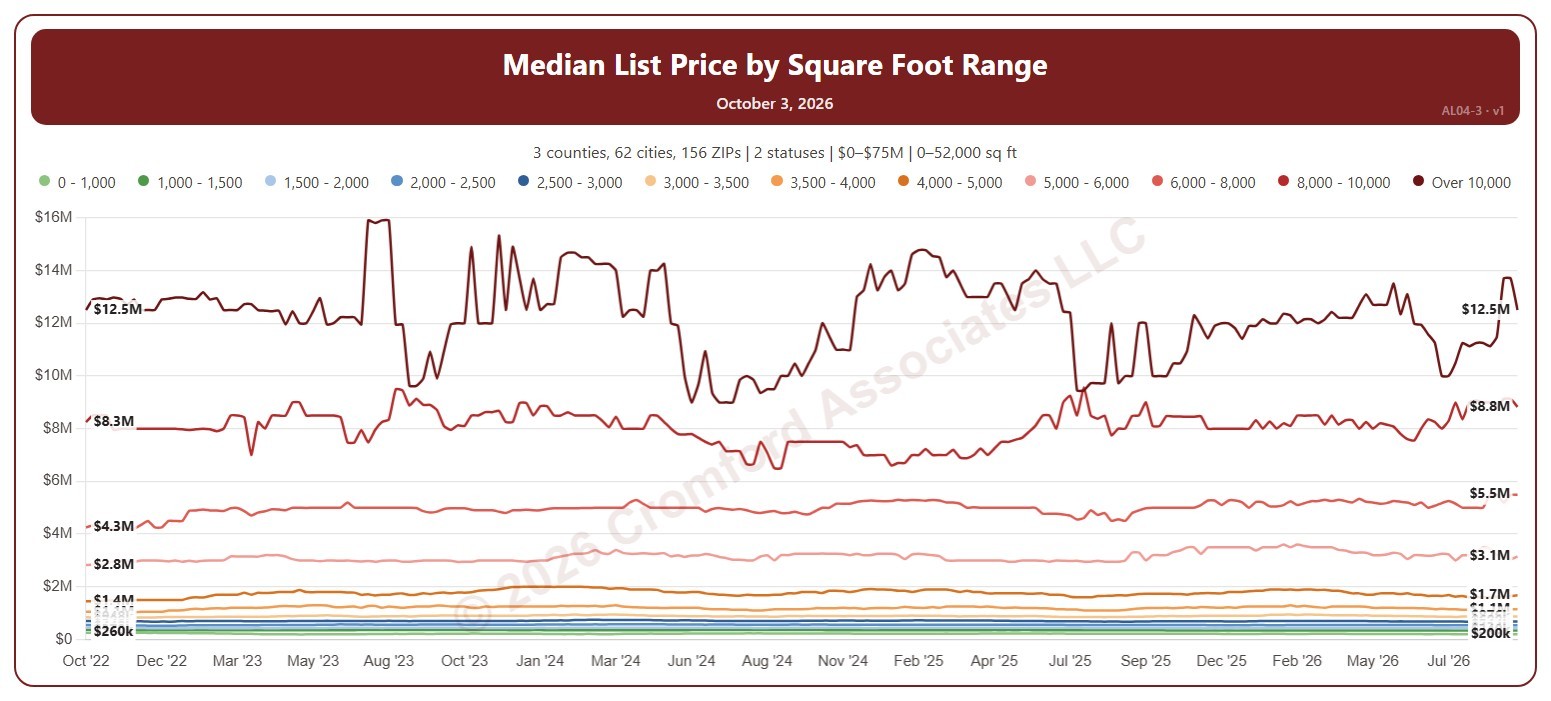
This chart shows the median list price of the homes for sale on ARMLS each week (on Saturdays), one line for each of 12 home-size bands from 1,000 square feet or less up to over 10,000. Comparing homes of similar size shows how asking prices are moving without the mix of sizes getting in the way.

By default it counts Active and Coming Soon listings; tick UCB / CCBS (under contract but still accepting back-up offers) or Temp Off Market in the List Status panel to include them. It opens on the last four years; use the Period panel to show the last 2 or 8 years, everything since 2011, or chosen years.

It opens on the Greater Phoenix area: the counties, cities, and ZIP codes that make it up are ticked to start with. Tick or untick any of them to change the area, including counties beyond Greater Phoenix. Narrow it further with the Dwelling Type, List Status, Transaction Type, and New / Resale boxes and the list price, home size, year built, and days on market sliders.

Hover over the chart to see the figures for that week.

Active Listings by Size

About this chart

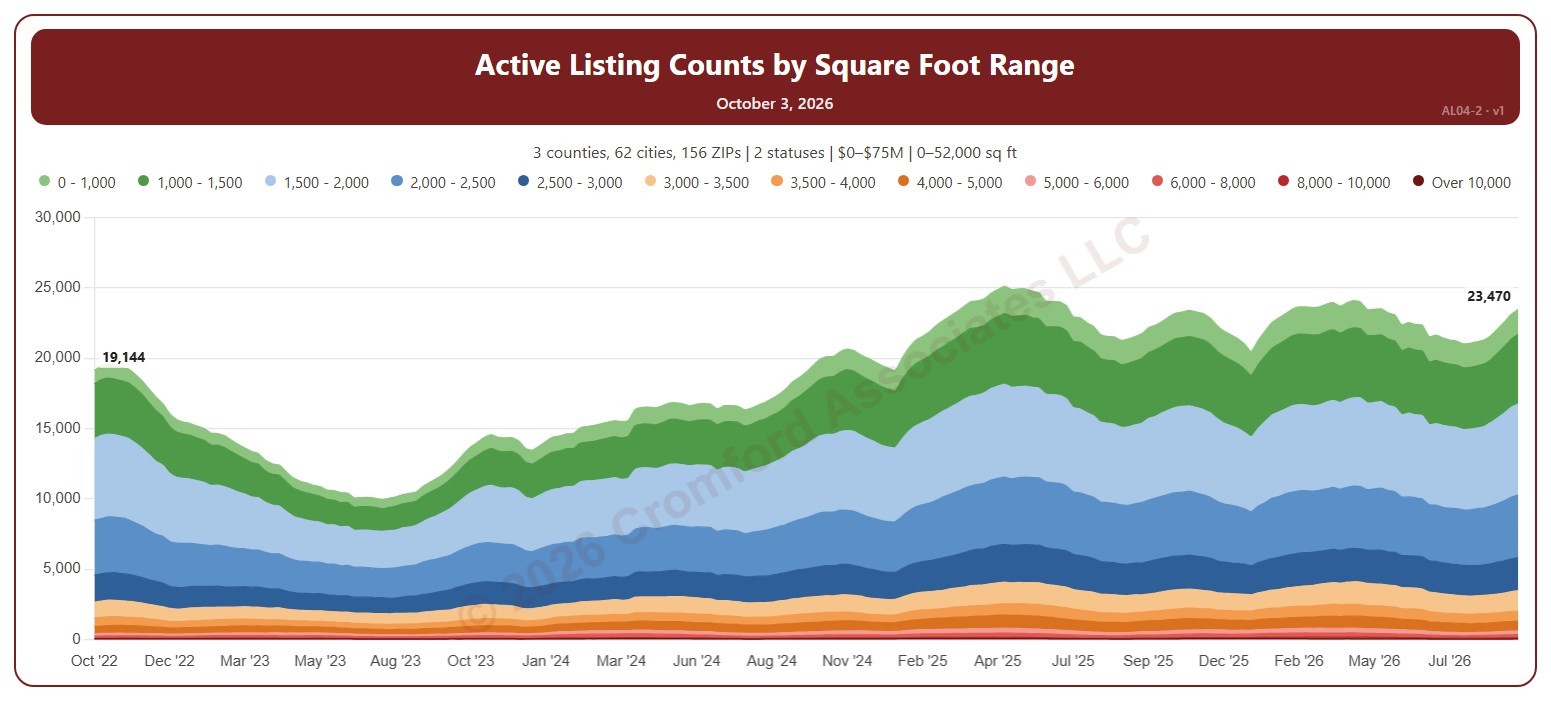
This chart counts the homes listed for sale on ARMLS each week (on Saturdays), stacked by home size in 12 bands from 1,000 square feet or less up to over 10,000. It shows which sizes make up the inventory and how that is changing.

By default it counts Active and Coming Soon listings; tick UCB / CCBS (under contract but still accepting back-up offers) or Temp Off Market in the List Status panel to include them. It opens on the last four years; use the Period panel to show the last 2 or 8 years, everything since 2011, or chosen years.

It opens on the Greater Phoenix area: the counties, cities, and ZIP codes that make it up are ticked to start with. Tick or untick any of them to change the area, including counties beyond Greater Phoenix. Narrow it further with the Dwelling Type, List Status, Transaction Type, and New / Resale boxes and the list price, home size, year built, and days on market sliders.

Hover over the chart to see the figures for that week.

Active Listings Weekly

About this chart

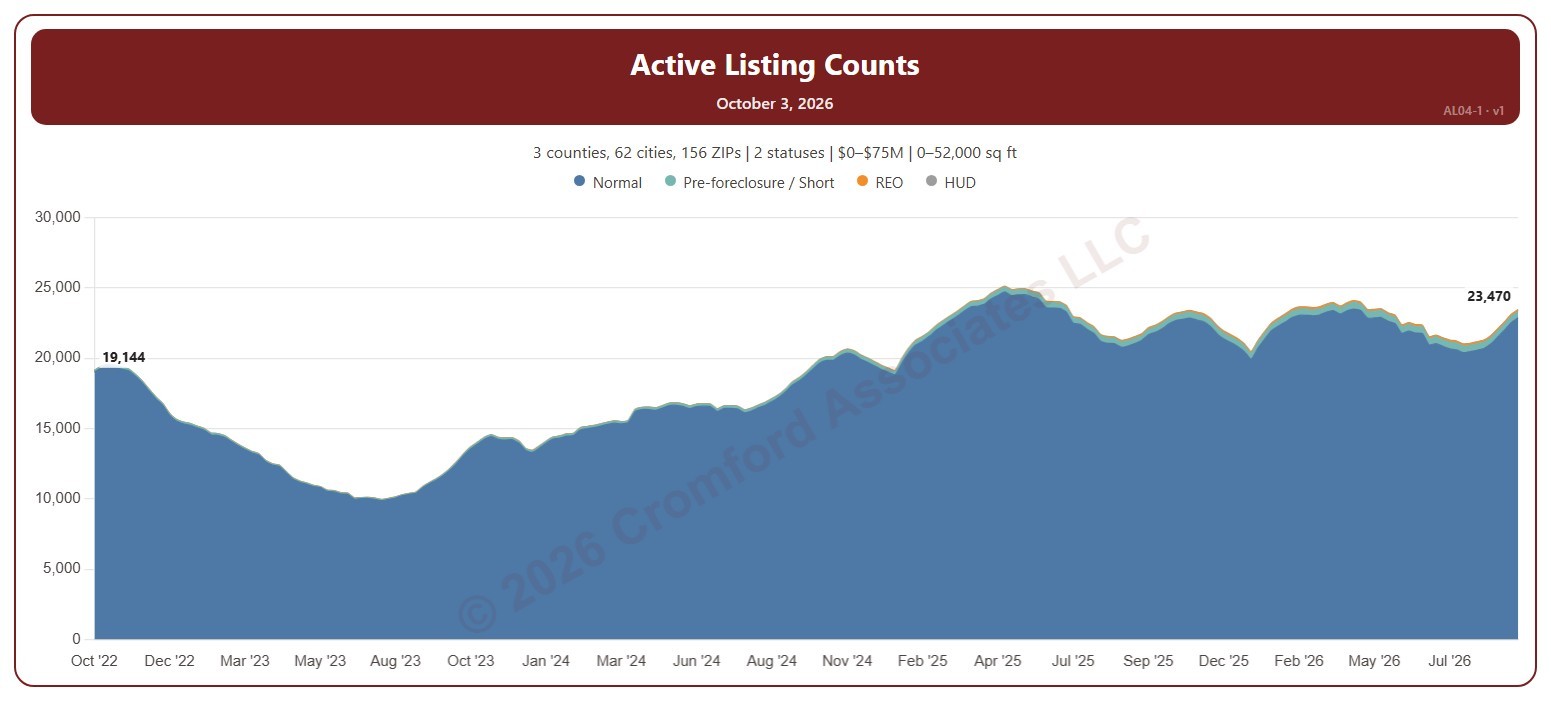
This chart counts the homes for sale on ARMLS each week (measured on Saturdays), stacked by transaction type: normal sales, pre-foreclosure / short sales, REOs, and HUD homes. The height of the stack is the total number of listings.

By default it counts Active and Coming Soon listings. Tick UCB / CCBS to include listings that are under contract but still accepting back-up offers, or Temp Off Market for listings that are temporarily withdrawn.

It opens on the last four years for the Greater Phoenix area: the counties, cities, and ZIP codes that make it up are ticked to start with. Use the Period panel to show the last 2, 4, or 8 years, or everything since 2011. The geography, dwelling type, list price, home size, year built, days on market, and New / Resale filters narrow the count to the part of the market you are interested in.

Rising inventory gives buyers more choice and more negotiating power; falling inventory favors sellers. Hover over the chart to see the counts for any week.

Year-over-Year Percent Change in List Price per Square Foot – Active Listings

About this chart

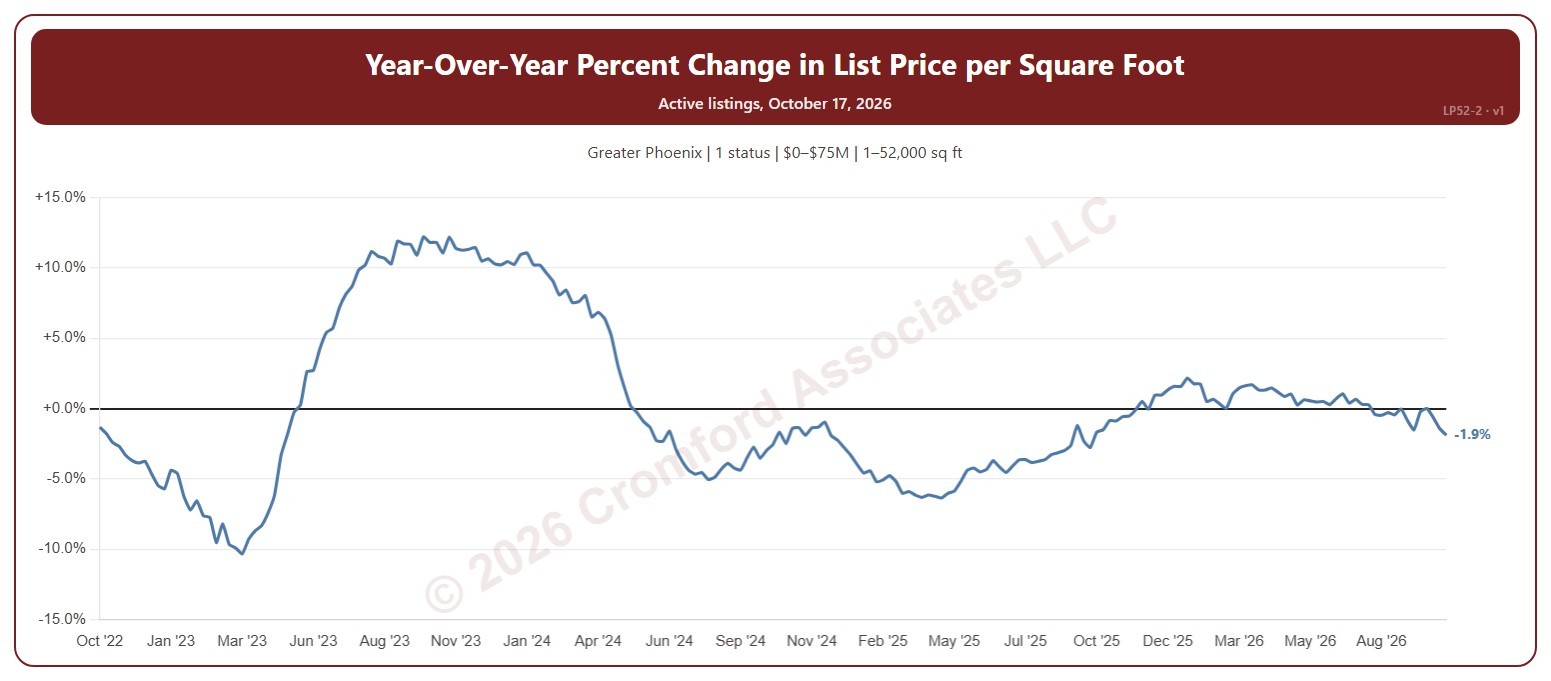
This chart shows how the average asking price per square foot of the homes for sale compares with the same Saturday a year earlier, as a percentage. The average is the total asking price of the active listings divided by their total square feet, taken every Saturday, so larger homes count for more.

It opens on the last 4 years; choose a longer period in the Period box, back to 2012. The chart is updated every day.

It opens on the Greater Phoenix area and on Active listings; tick UCB / CCBS or Coming Soon in the Status box to add them. Tick or untick counties, cities, and ZIP codes to change the area, including counties beyond Greater Phoenix. Narrow it further with the Dwelling Type, Transaction Type, and New / Resale boxes and the list price, home size, year built, and days on market sliders.

Hover over the line to see the change and the two prices per square foot it compares, each with its Saturday.

Average List Price per Square Foot – Active Listings

About this chart

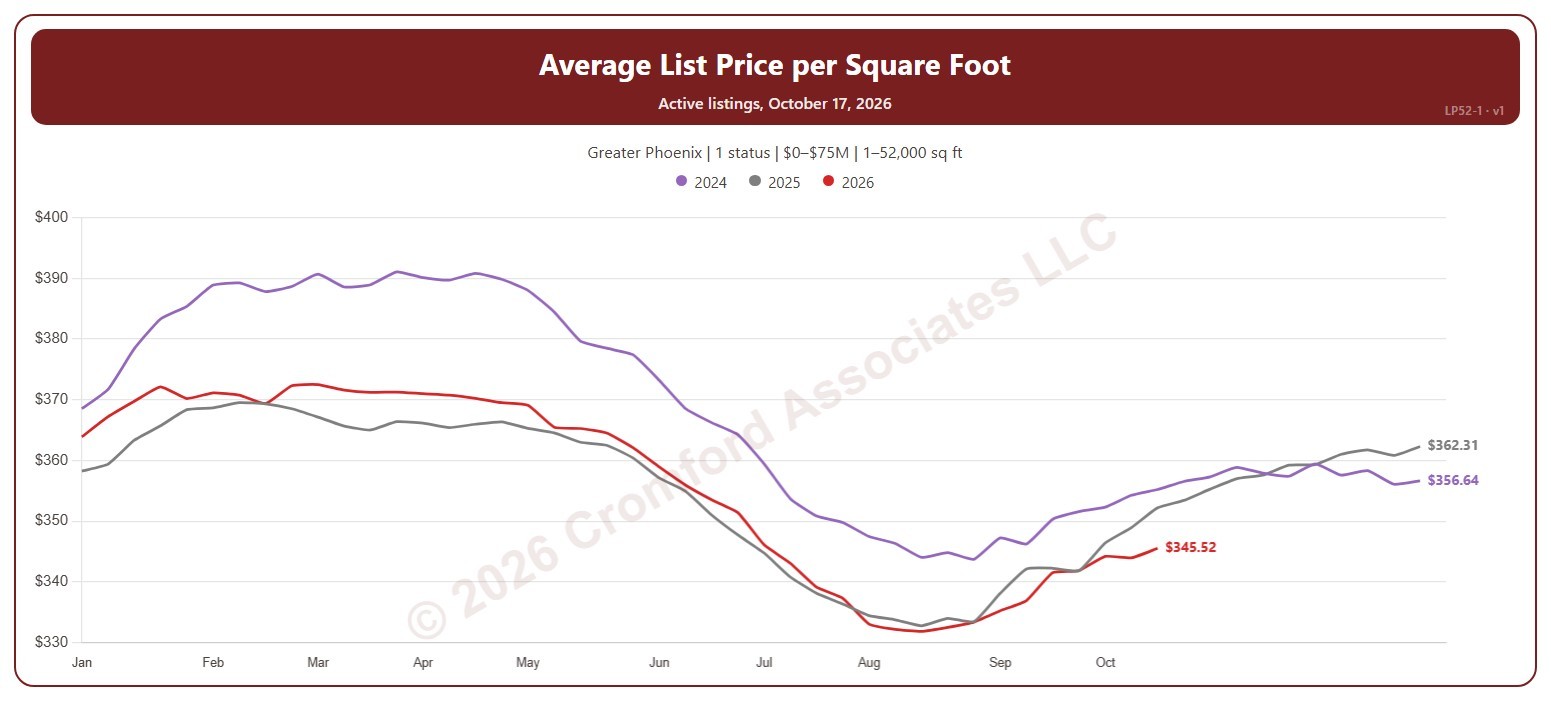
This chart shows the average asking price per square foot of the homes for sale, a line per year through the weeks of the year, so this year can be read against earlier years. The average is the total asking price of the active listings divided by their total square feet, taken every Saturday, so larger homes count for more.

It opens on the latest 3 years; tick other years in the Year box to go back as far as 2011. Click a ticked year again to fade it, and once more to remove it. The chart is updated every day.

It opens on the Greater Phoenix area and on Active listings; tick UCB / CCBS or Coming Soon in the Status box to add them. Tick or untick counties, cities, and ZIP codes to change the area, including counties beyond Greater Phoenix. Narrow it further with the Dwelling Type, Transaction Type, and New / Resale boxes and the list price, home size, year built, and days on market sliders.

Hover over the chart to see each year’s figure for that week and its Saturday.