About this chart
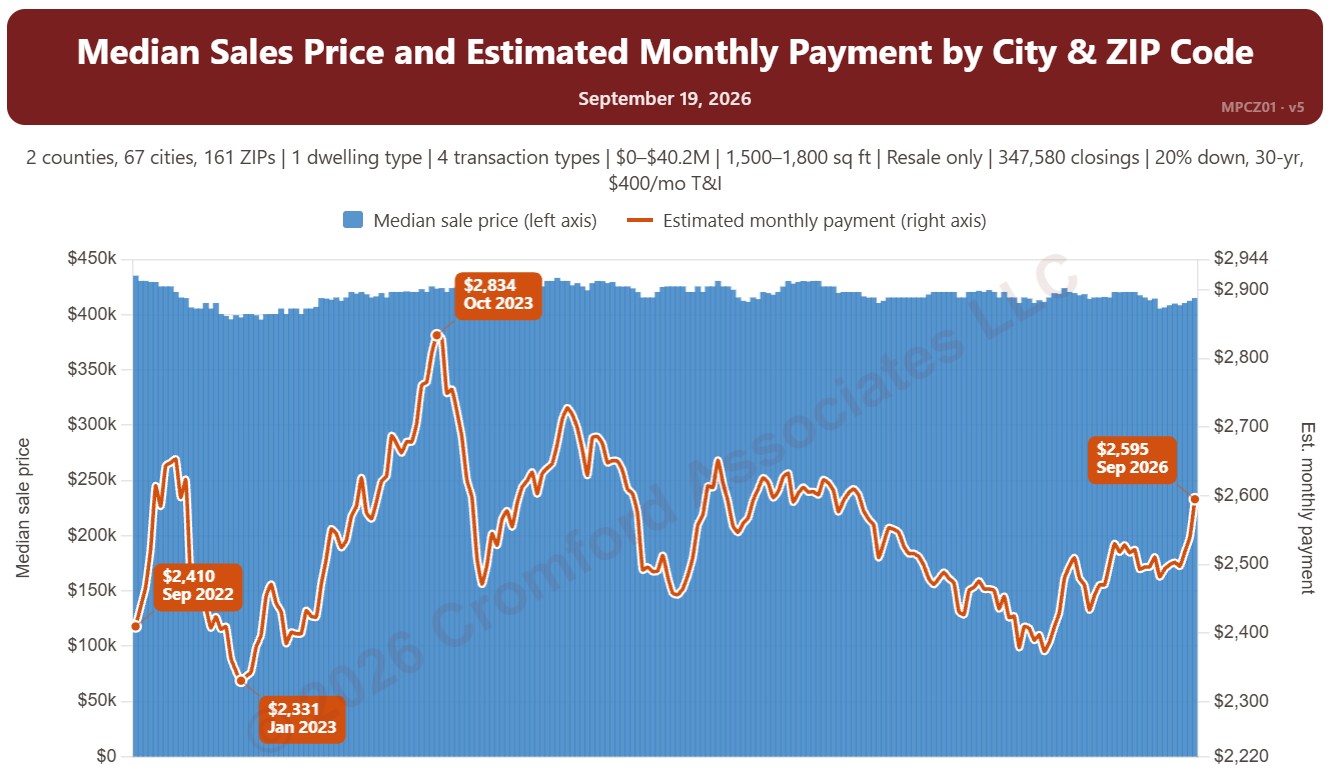
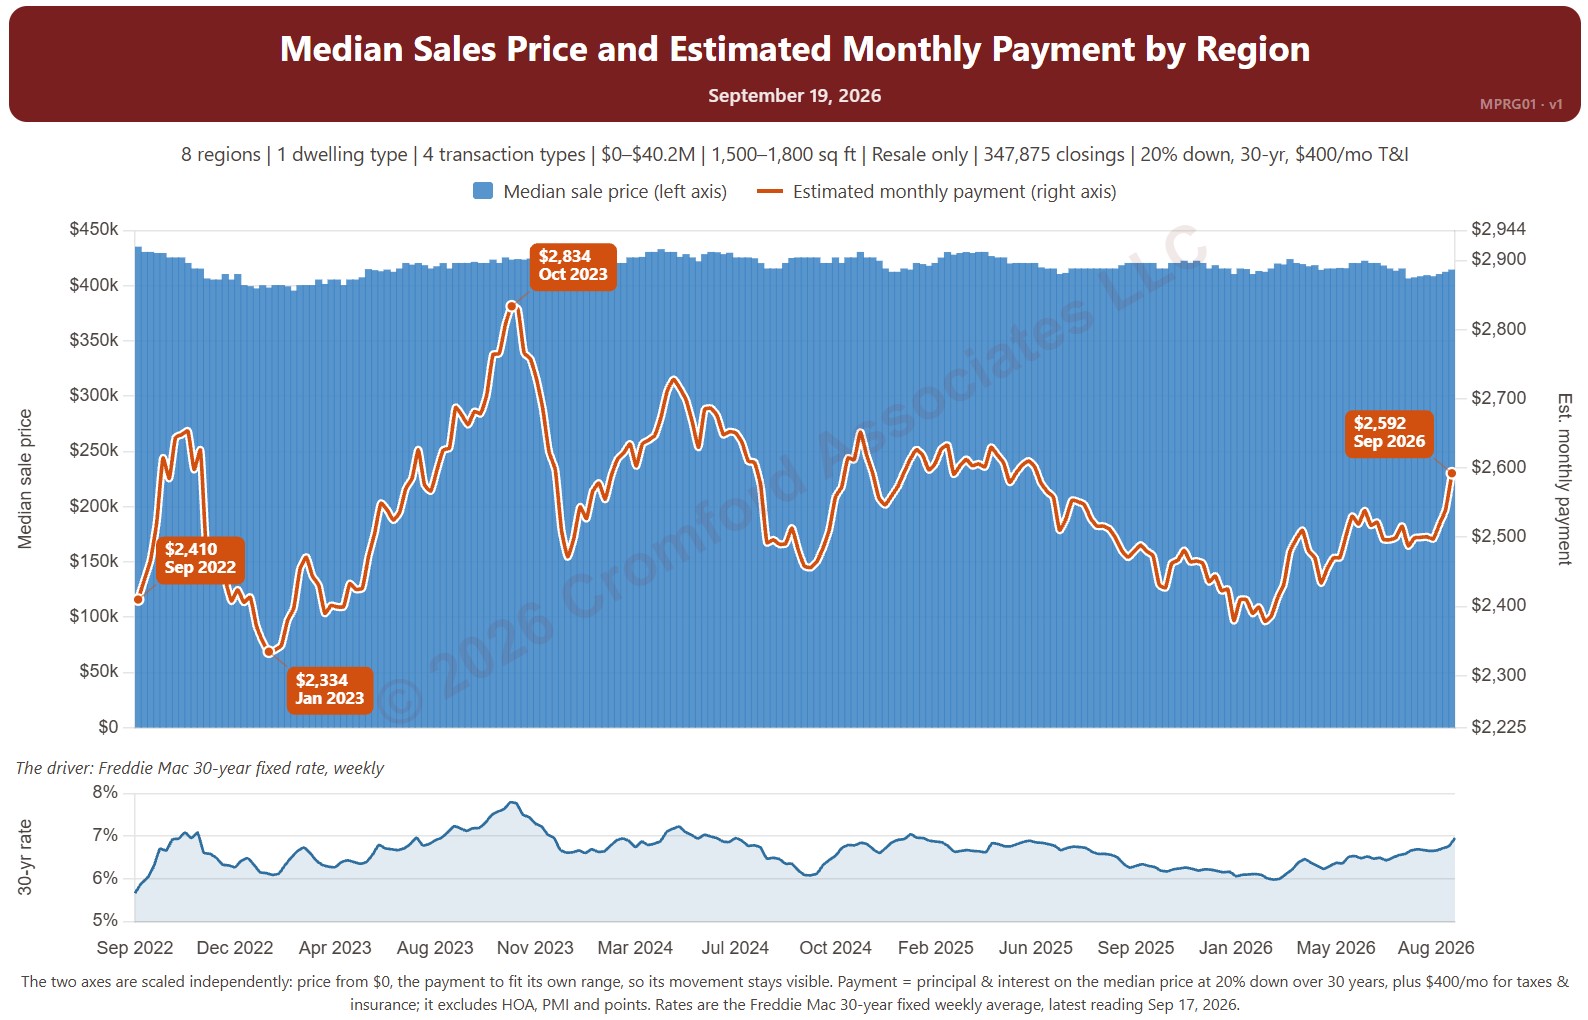
This chart sets the median sales price beside the estimated monthly payment needed to buy a home at that price, measured every week, with the 30-year fixed mortgage rate (Freddie Mac Primary Mortgage Market Survey®) in the panel below. It shows how affordability changes as both prices and rates move.
The default view is single-family resale homes of every size over the last four years. The payment assumes 20% down, a 30-year loan, and taxes and insurance of 1.2% of the sales price a year. The Payment panel changes the assumptions, and Reset assumptions puts them back.
It opens with every region included. Use the Region panel to focus on one region or compare a combination of them. Narrow it with the Dwelling Type, Transaction Type, and New / Resale boxes and the sales price and home size sliders. The 1 yr, 3 yr, 5 yr, 10 yr, and Full range buttons set the stretch of history shown.
Hover over the chart to see the figures for that week.