About this chart
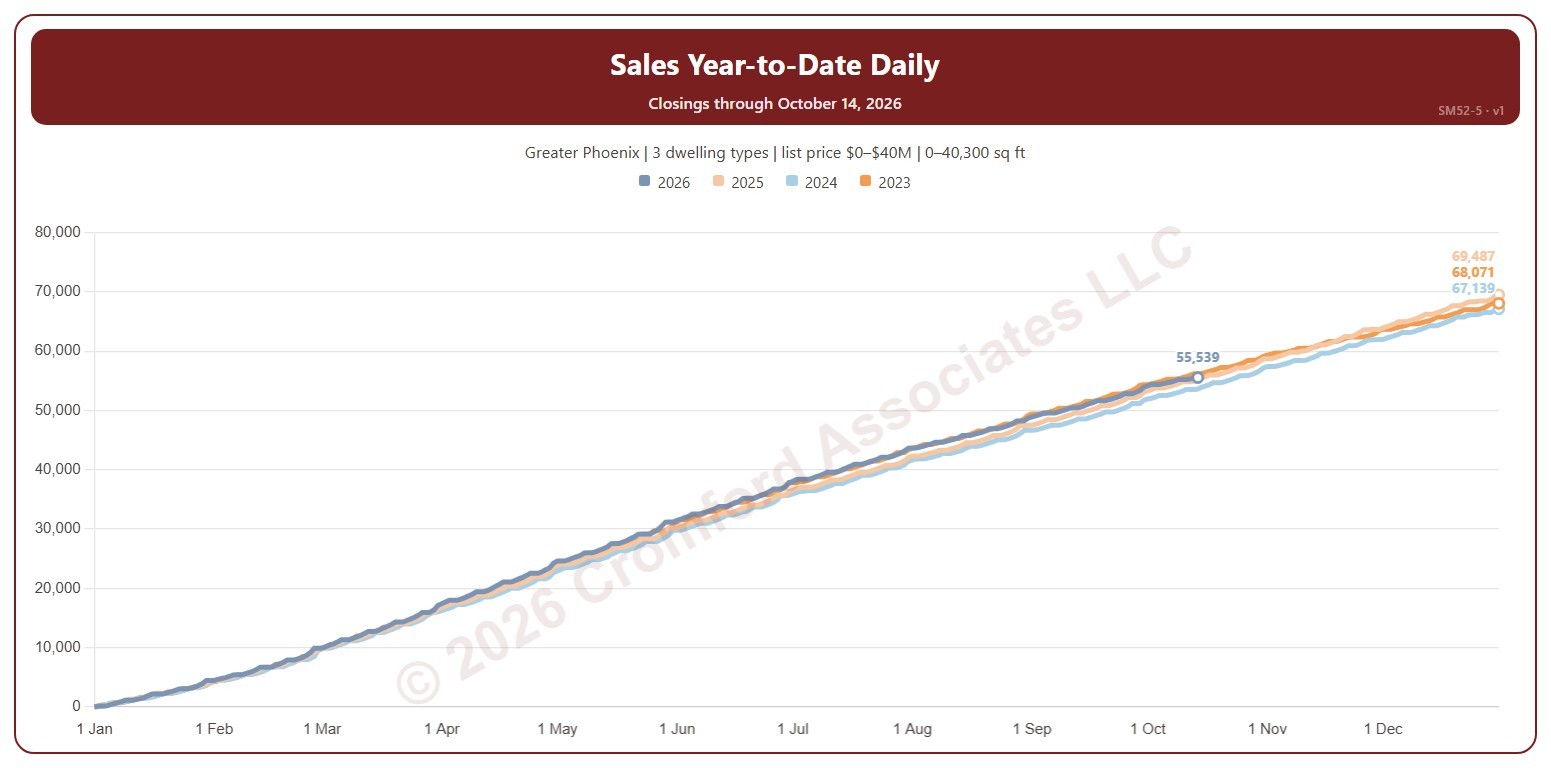
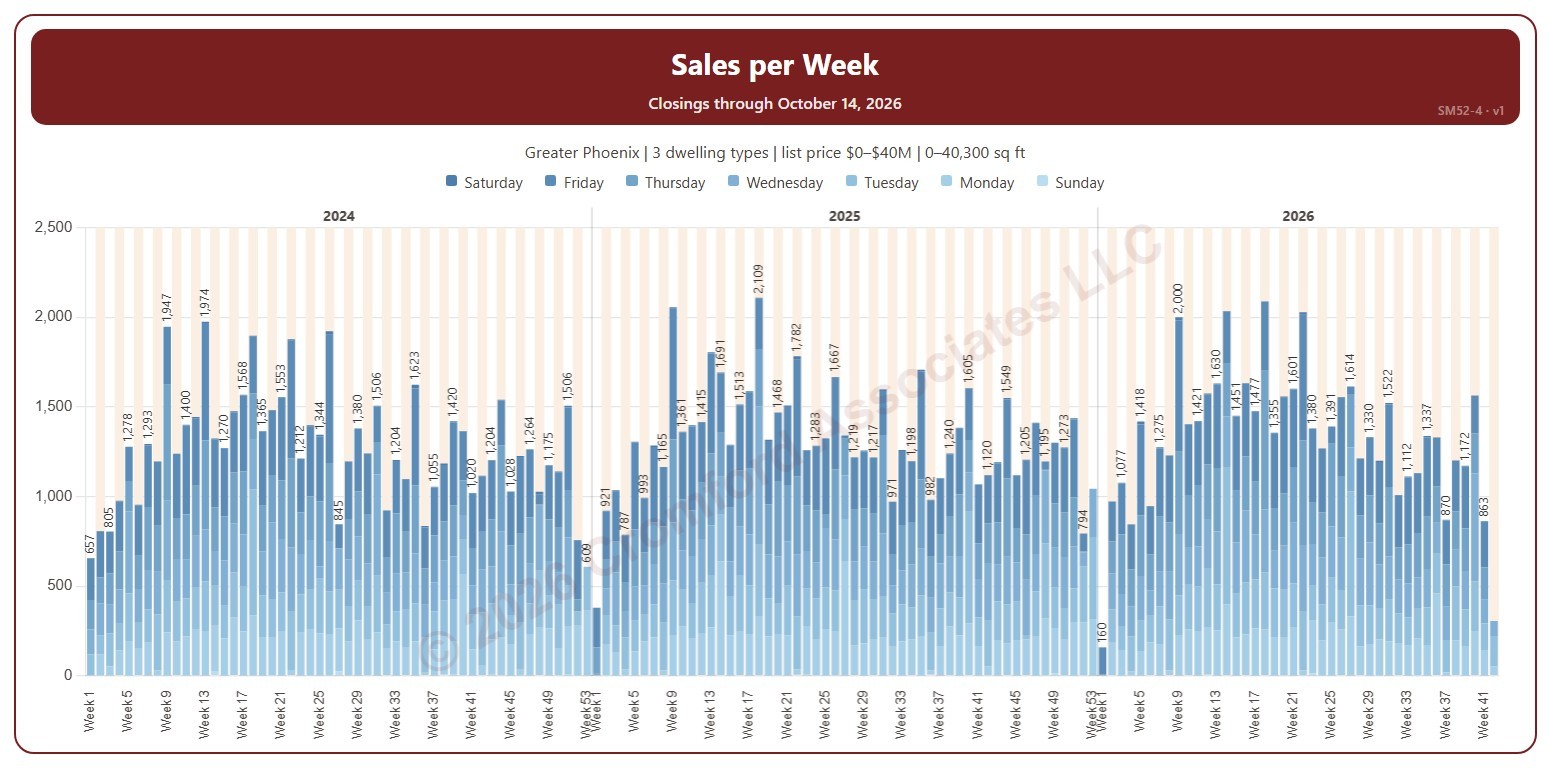
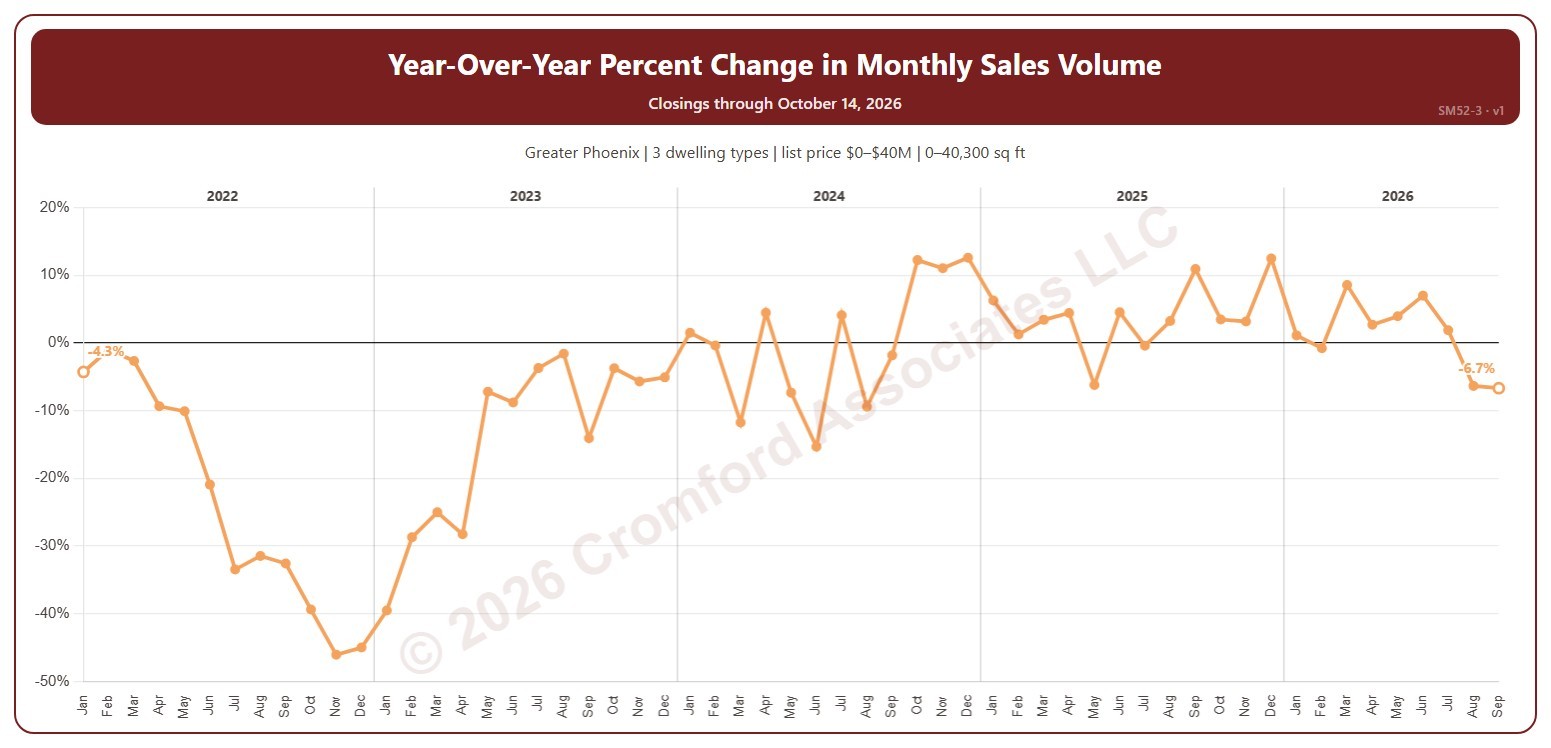
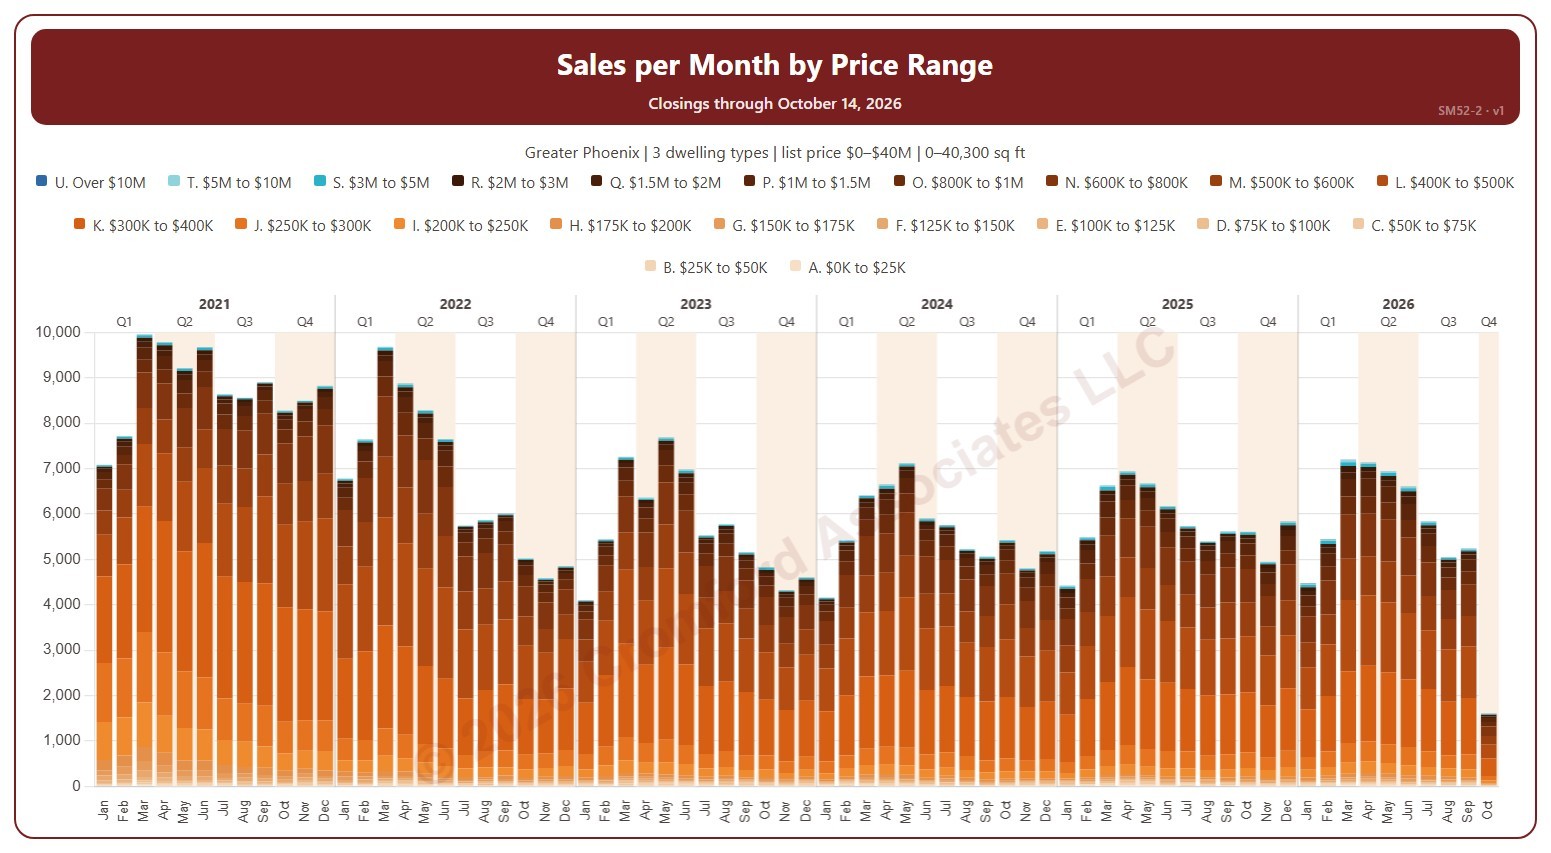
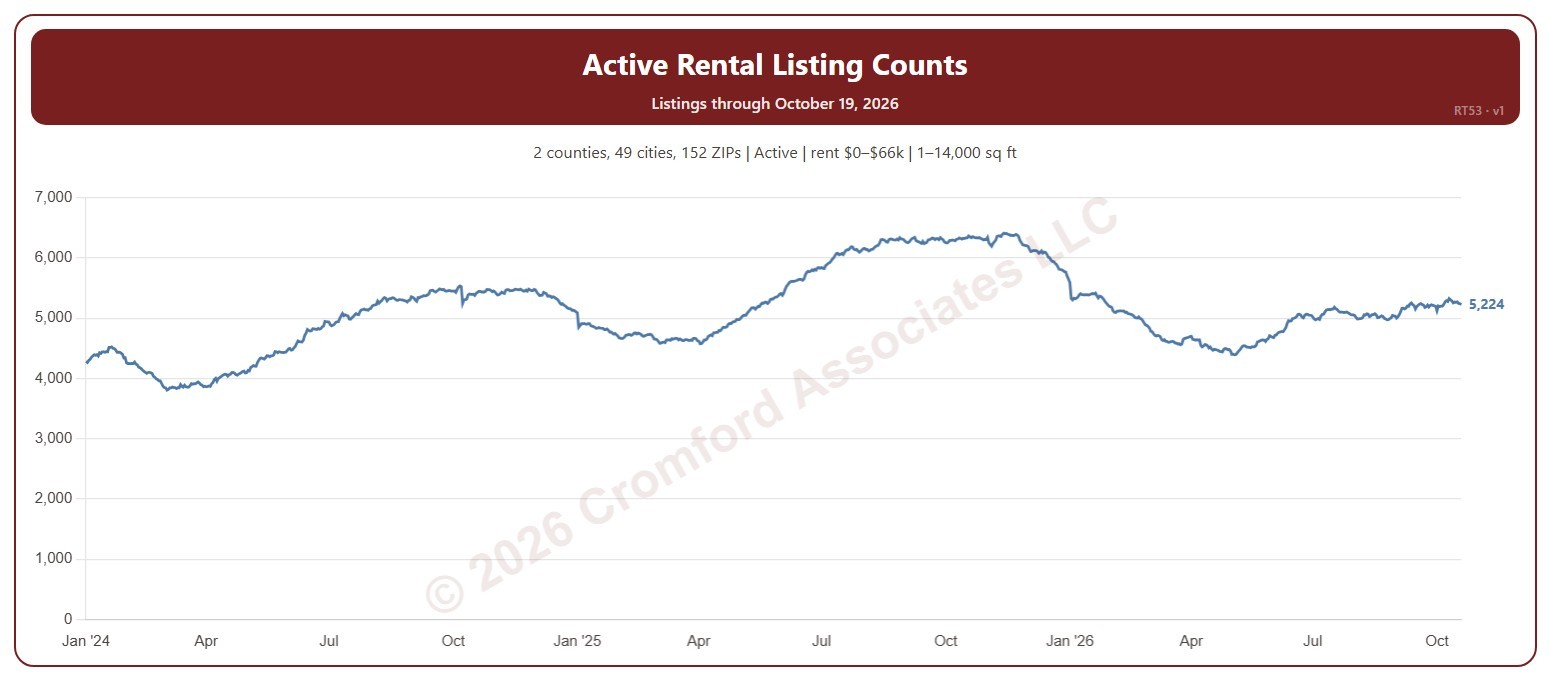
This chart shows the number of homes listed for lease on ARMLS each day since January 2024, so the rise and fall of rental supply through the seasons can be read against earlier years.
It opens on Maricopa and Pinal Counties, Active rental listings, and homes of 1 to 14,000 square feet. Tick Coming Soon, Pending, or Temp Off Market in the Status box to add them, and tick or untick counties, cities, and ZIP codes to change the area. The chart is updated every day.
Narrow it further with the Dwelling Type and Bedrooms boxes and the asking rent, home size, and year built sliders.
Hover over the line to see the day’s count and the count on the same day a year earlier, with the change.