Listings Expired Weekly

About this chart

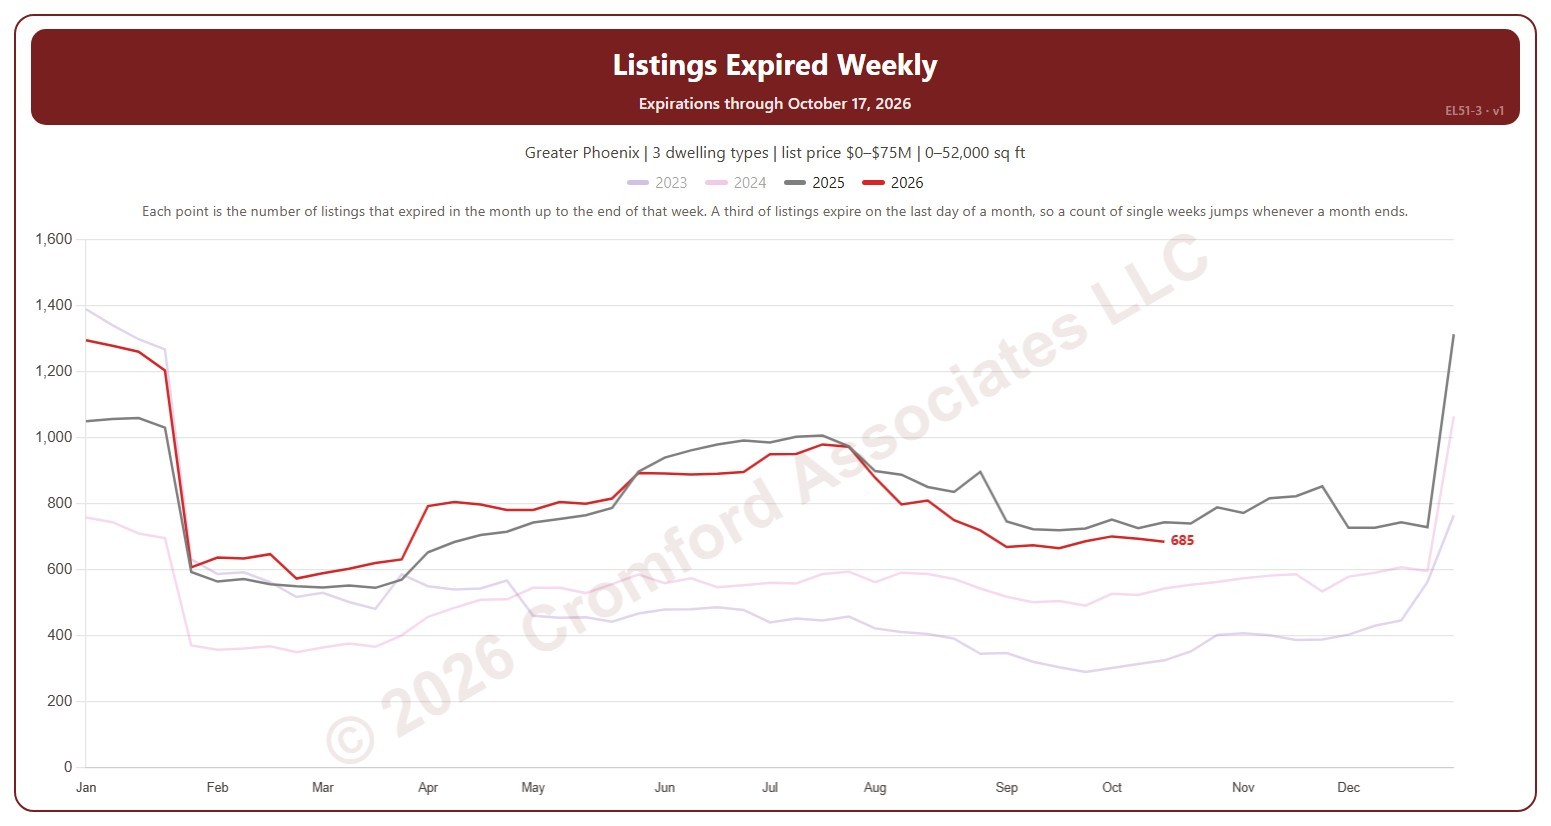
This chart follows expired listings through the year, a line per year. Each weekly point counts the listings that expired in the month up to the end of that week. About a third of listings expire on the last day of a month, so a count of single weeks jumps whenever a month ends; a month’s count always holds one month end, so the years can be compared. Weeks run Sunday to Saturday and week 1 of each year starts on 1 January, so the first and last weeks of a year can be short. An expired listing is one whose listing agreement ran out before the home sold, counted on the date it expired.

It opens on this year and last, with the two years before them faded; tick other years in the Year box to go back as far as 2001. Click a ticked year again to fade it, and once more to remove it. Use the Month box to count only some months of the year. The chart is updated every day.

It opens on the Greater Phoenix area: the counties, cities, and ZIP codes that make it up are ticked to start with. Tick or untick any of them to change the area, including counties beyond Greater Phoenix. Narrow it further with the Dwelling Type, Transaction Type, and New / Resale boxes and the list price, home size, and year built sliders.

Hover over the chart to see each year’s count for the month to that date and the count for that week alone.
Listings Expired per Month

About this chart

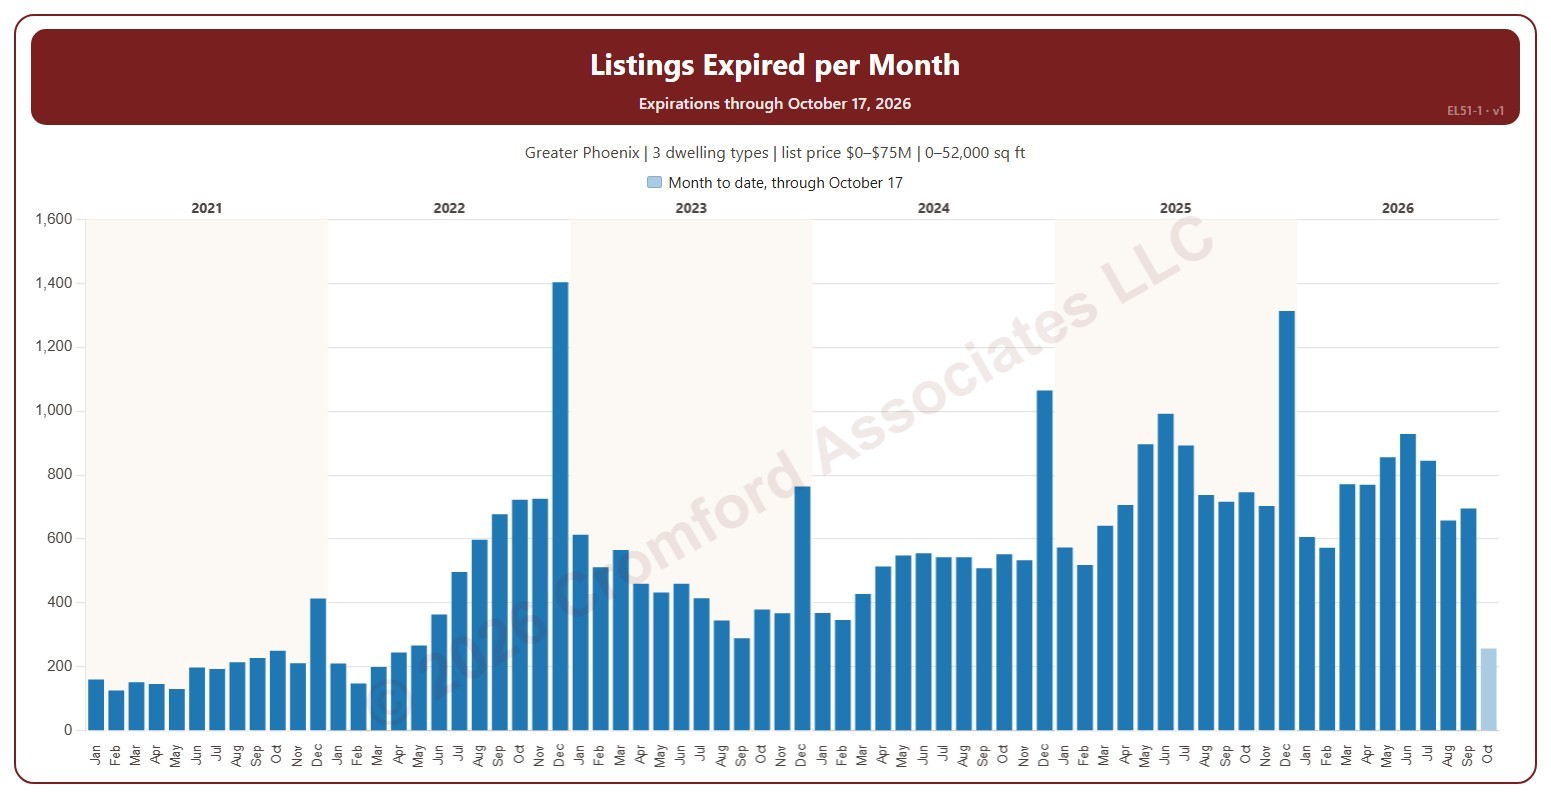
This chart shows the number of listings that expired each month. An expired listing is one whose listing agreement ran out before the home sold, counted on the date it expired.

It opens on January six years back to date; drag the handles of the date slider under the chart to choose the months shown, as far back as January 2001. The current month is the month so far and is drawn lighter. The chart is updated every day.

It opens on the Greater Phoenix area: the counties, cities, and ZIP codes that make it up are ticked to start with. Tick or untick any of them to change the area, including counties beyond Greater Phoenix. Narrow it further with the Dwelling Type, Transaction Type, and New / Resale boxes and the list price, home size, and year built sliders.

Hover over a bar to see the month’s count.

Median Sales Price Map

About this chart

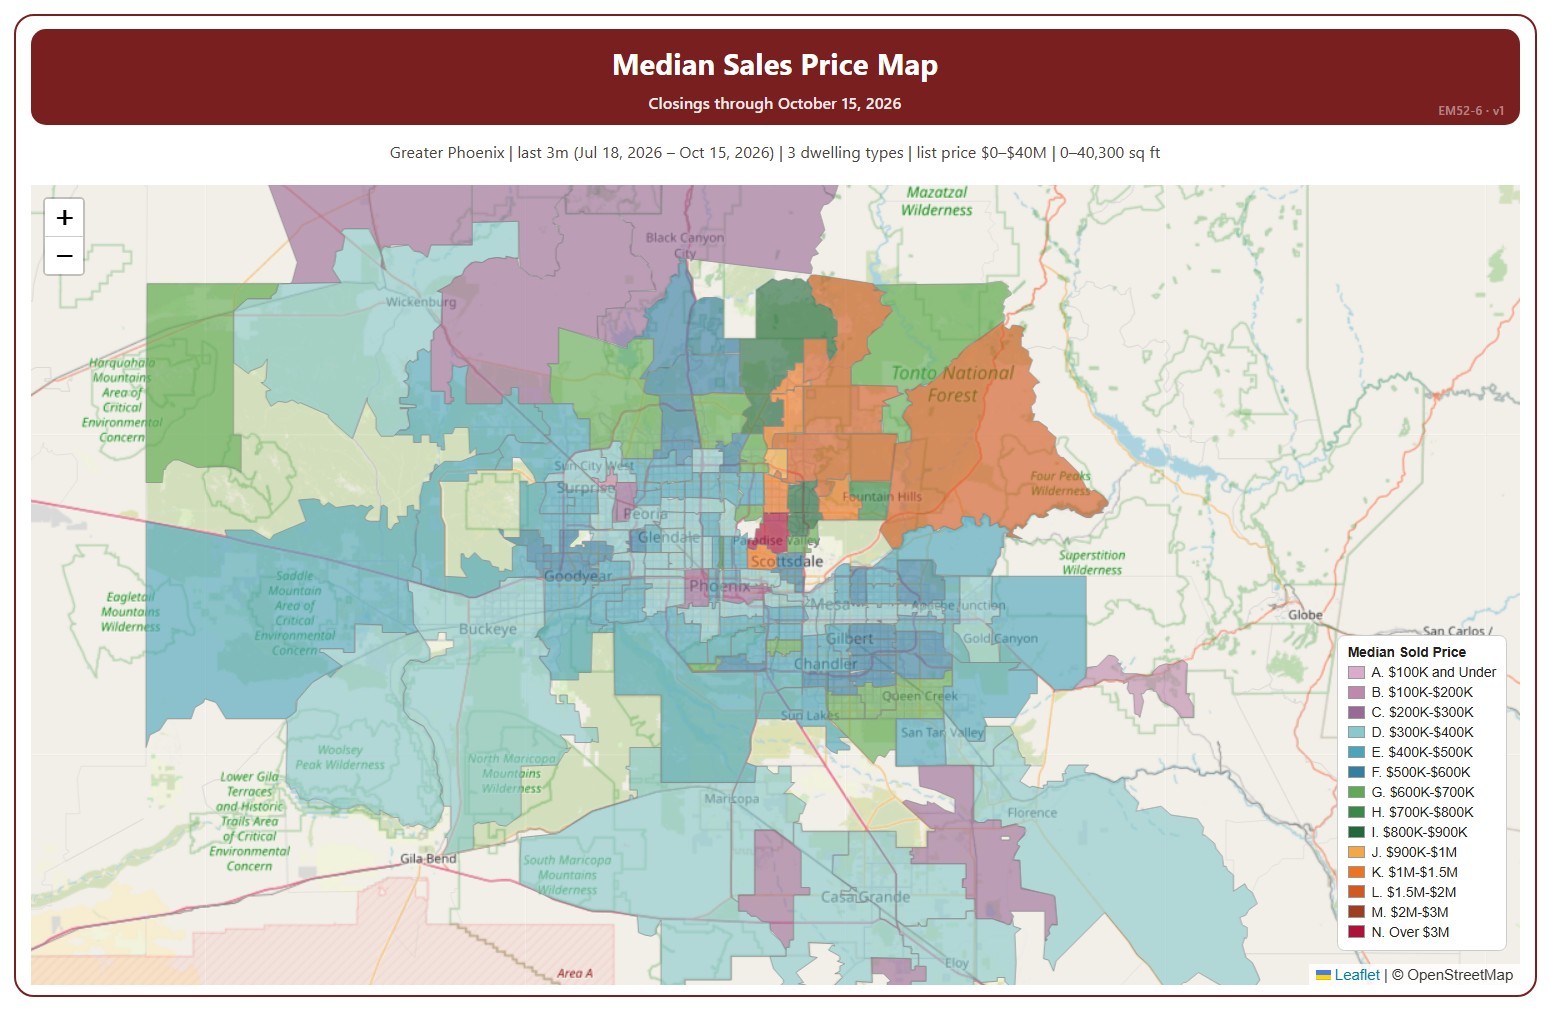
This map colors each ZIP code by the median sales price of its closings over the time frame chosen, in 14 price ranges. The median sales price is the middle sale price of the homes that closed on ARMLS in the period: half sold for more and half for less. New homes are included.

It opens on the last 3 months to the newest closing; use the Time Frame buttons over the map for the last day, week, month, 3 months, year, or 5 years. Click a price range in the legend to hide or show it. Every ZIP code with a closing is colored, so a ZIP code with only one or two closings can show an unusual median; the number of closings is in its tooltip. The map is updated every day.

It opens on the Greater Phoenix area: the counties, cities, and ZIP codes that make it up are ticked to start with. Tick or untick any of them to change the area, including counties beyond Greater Phoenix. Narrow it further with the Dwelling Type, Transaction Type, and New / Resale boxes and the list price, home size, and year built sliders.

Hover over a ZIP code to see its median, its number of closings, and its price range.

Annual Change in Median Sales Price

About this chart

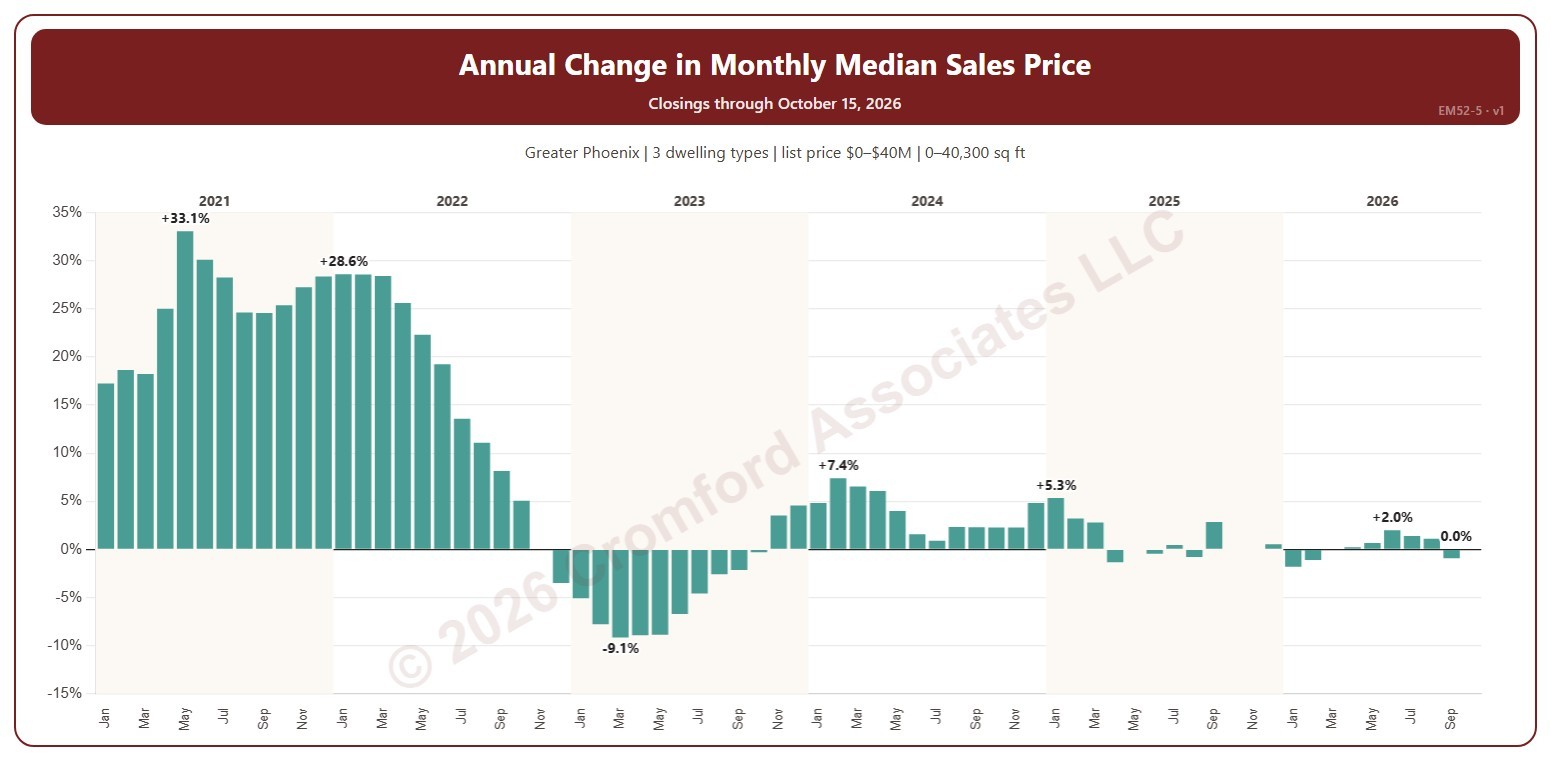
This chart shows the change in the median sales price from the same month a year earlier, as a percentage: above zero, prices were higher than a year before; below zero, lower. Each year’s largest change and the newest month are labeled. The median sales price is the middle sale price of the homes that closed on ARMLS in the period: half sold for more and half for less. New homes are included.

It opens on January 2021 to date; drag the handles of the date slider under the chart to choose the months shown, as far back as January 2001. The newest month is the month so far. The chart is updated every day.

It opens on the Greater Phoenix area: the counties, cities, and ZIP codes that make it up are ticked to start with. Tick or untick any of them to change the area, including counties beyond Greater Phoenix. Narrow it further with the Dwelling Type, Transaction Type, and New / Resale boxes and the list price, home size, and year built sliders.

Hover over a bar to see the change and both months’ medians.

Annual Median Sales Price

About this chart

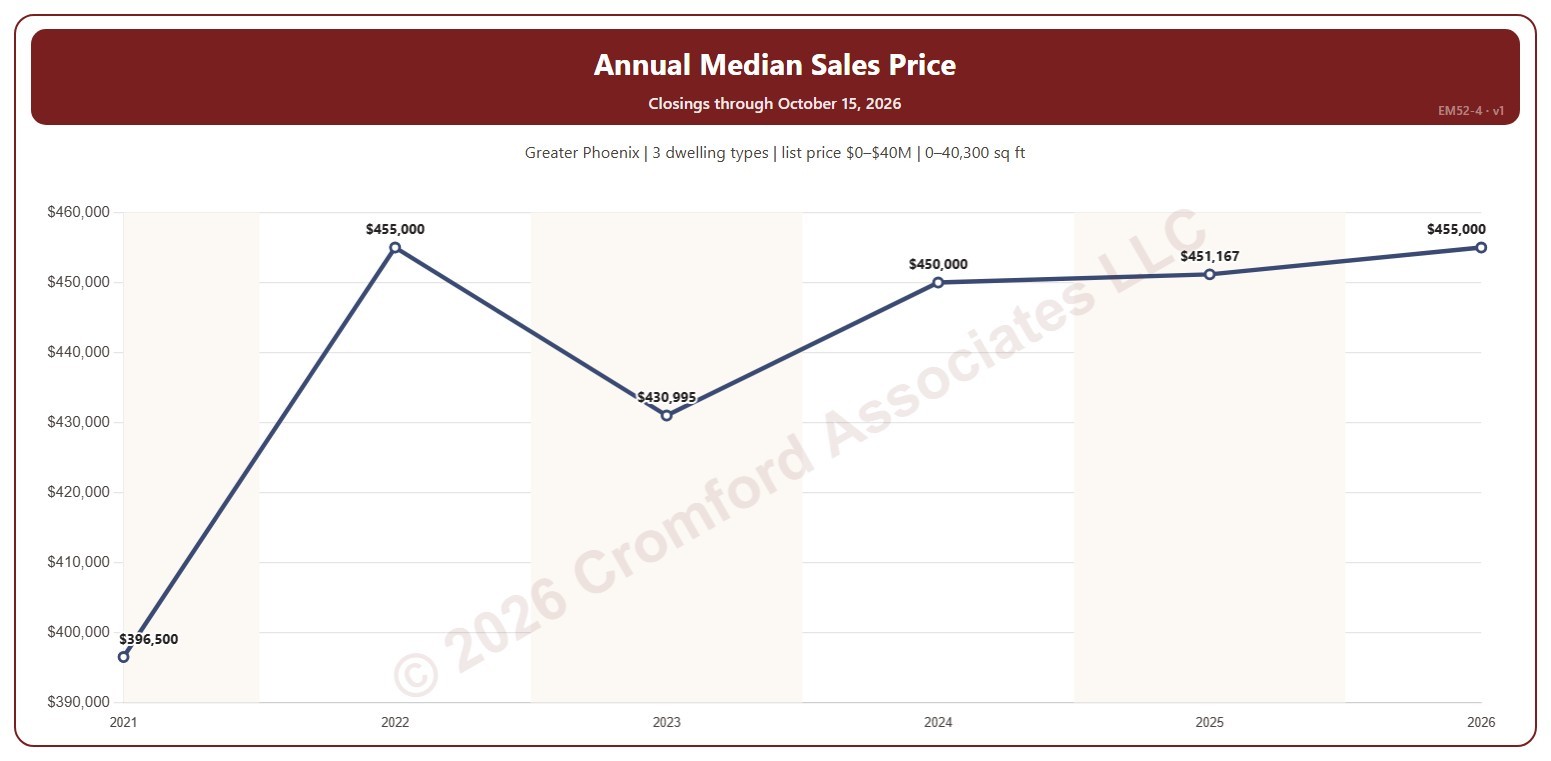
This chart shows the median sales price each year, every year labeled. The median sales price is the middle sale price of the homes that closed on ARMLS in the period: half sold for more and half for less. New homes are included.

It opens on 2021 to date; drag the handles of the date slider under the chart to choose the years shown, as far back as 2000. The newest year is the year so far. The chart is updated every day.

It opens on the Greater Phoenix area: the counties, cities, and ZIP codes that make it up are ticked to start with. Tick or untick any of them to change the area, including counties beyond Greater Phoenix. Narrow it further with the Dwelling Type, Transaction Type, and New / Resale boxes and the list price, home size, and year built sliders.

Hover over the line to see the median, the lowest and highest sale, and the number of closings that year.

Quarterly Median Sales Price

About this chart

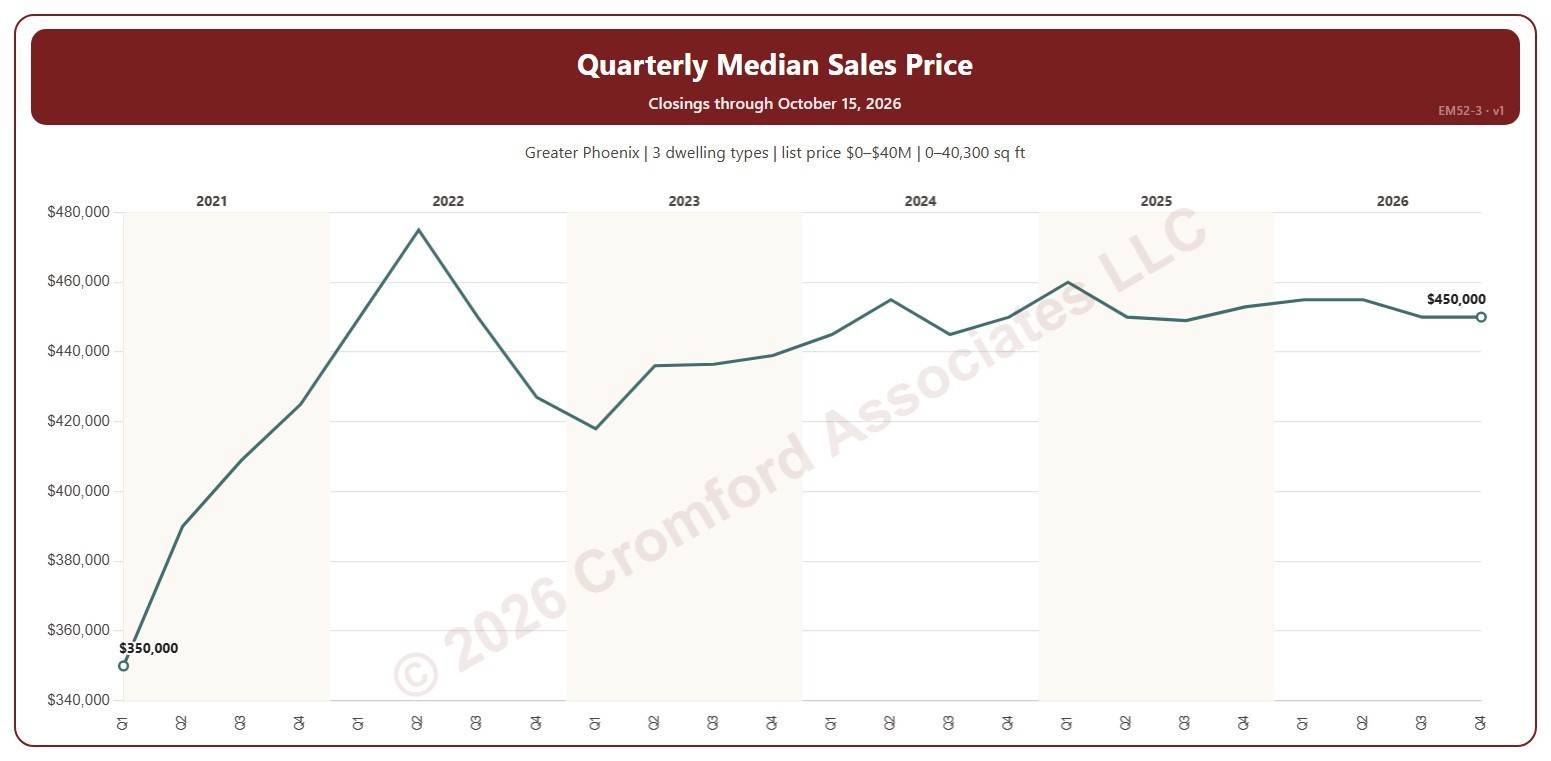
This chart shows the median sales price each quarter. The median sales price is the middle sale price of the homes that closed on ARMLS in the period: half sold for more and half for less. New homes are included.

It opens on the first quarter of 2021 to date; drag the handles of the date slider under the chart to choose the quarters shown, as far back as 2000. The newest quarter is the quarter so far. The chart is updated every day.

It opens on the Greater Phoenix area: the counties, cities, and ZIP codes that make it up are ticked to start with. Tick or untick any of them to change the area, including counties beyond Greater Phoenix. Narrow it further with the Dwelling Type, Transaction Type, and New / Resale boxes and the list price, home size, and year built sliders.

Hover over the line to see the median, the lowest and highest sale, and the number of closings that quarter.

Monthly Median Sales Price

About this chart

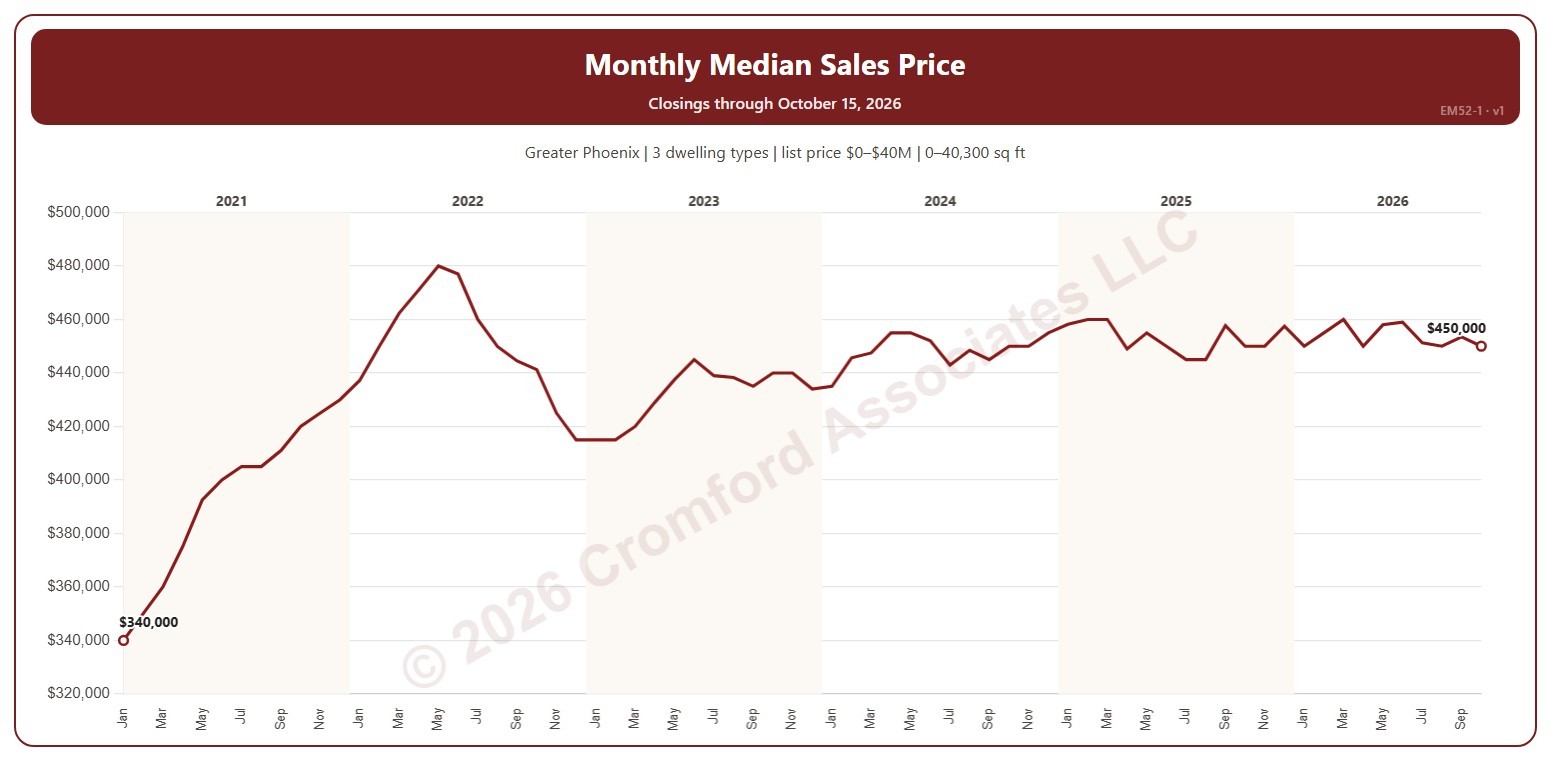
This chart shows the median sales price each month. The median sales price is the middle sale price of the homes that closed on ARMLS in the period: half sold for more and half for less. New homes are included.

It opens on January 2021 to date; drag the handles of the date slider under the chart to choose the months shown, as far back as January 2000. The newest month is the month so far. The chart is updated every day.

It opens on the Greater Phoenix area: the counties, cities, and ZIP codes that make it up are ticked to start with. Tick or untick any of them to change the area, including counties beyond Greater Phoenix. Narrow it further with the Dwelling Type, Transaction Type, and New / Resale boxes and the list price, home size, and year built sliders.

Hover over the line to see the median, the lowest and highest sale, and the number of closings that month.

Percentage Annual Change in Monthly Median Sales Price by Region

About this chart

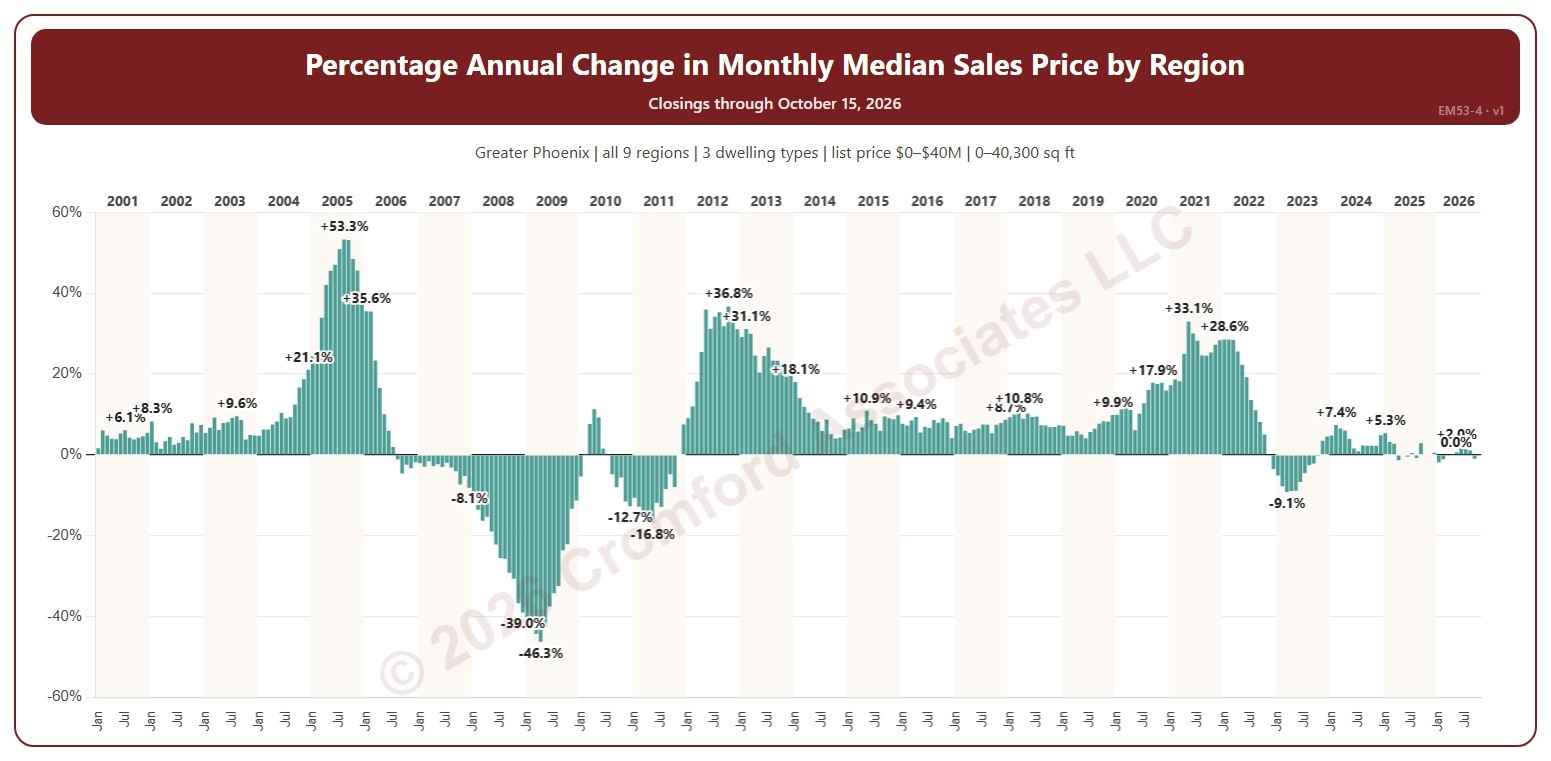
This chart shows the change in the median sales price from the same month a year earlier, as a percentage: above zero, prices were higher than a year before; below zero, lower. Each year’s largest change and the newest month are labeled. The median sales price is the middle sale price of the homes that closed on ARMLS in the period: half sold for more and half for less.

It opens on January 2001 to date; drag the handles of the date slider under the chart to choose the months shown. The newest month is the month so far. The chart is updated every day.

It opens on the Greater Phoenix area: the counties, cities, and ZIP codes that make it up are ticked to start with. Tick or untick any of them to change the area, including counties beyond Greater Phoenix. Use the Region boxes to pick any of the nine Greater Phoenix regions; Other areas (unticked to start with) adds ZIP codes outside them, needed if you widen the area beyond Greater Phoenix. Narrow it further with the Dwelling Type, Transaction Type, and New / Resale boxes and the list price, home size, and year built sliders.

Hover over a bar to see the change and both months’ medians.

Annual Median Sales Price by Region

About this chart

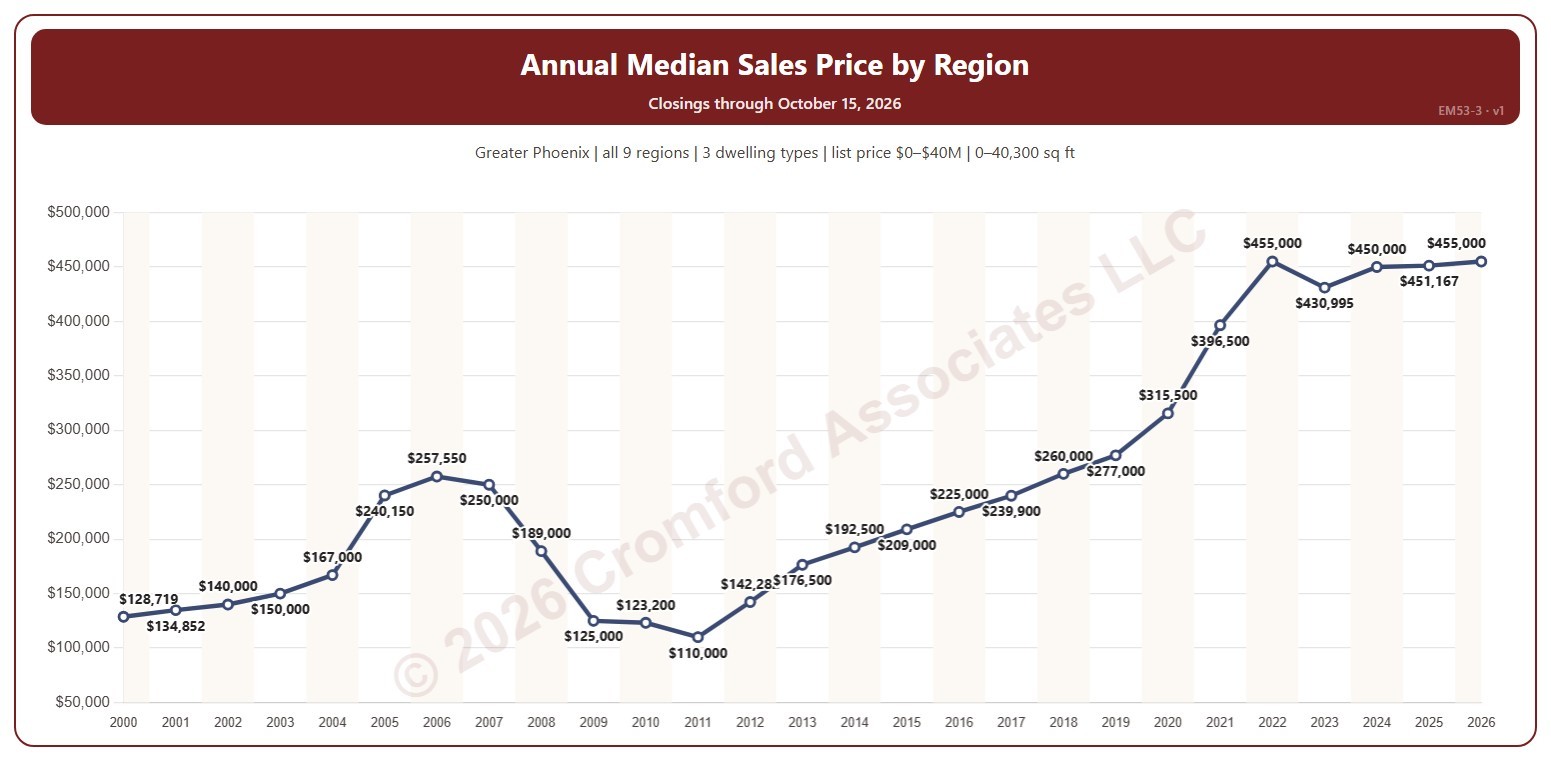
This chart shows the median sales price each year, every year labeled. The median sales price is the middle sale price of the homes that closed on ARMLS in the period: half sold for more and half for less.

It opens on 2000 to date; drag the handles of the date slider under the chart to choose the years shown. The newest year is the year so far. The chart is updated every day.

It opens on the Greater Phoenix area: the counties, cities, and ZIP codes that make it up are ticked to start with. Tick or untick any of them to change the area, including counties beyond Greater Phoenix. Use the Region boxes to pick any of the nine Greater Phoenix regions; Other areas (unticked to start with) adds ZIP codes outside them, needed if you widen the area beyond Greater Phoenix. Narrow it further with the Dwelling Type, Transaction Type, and New / Resale boxes and the list price, home size, and year built sliders.

Hover over the line to see the median and the number of closings that year.

Quarterly Median Sales Price by Region

About this chart

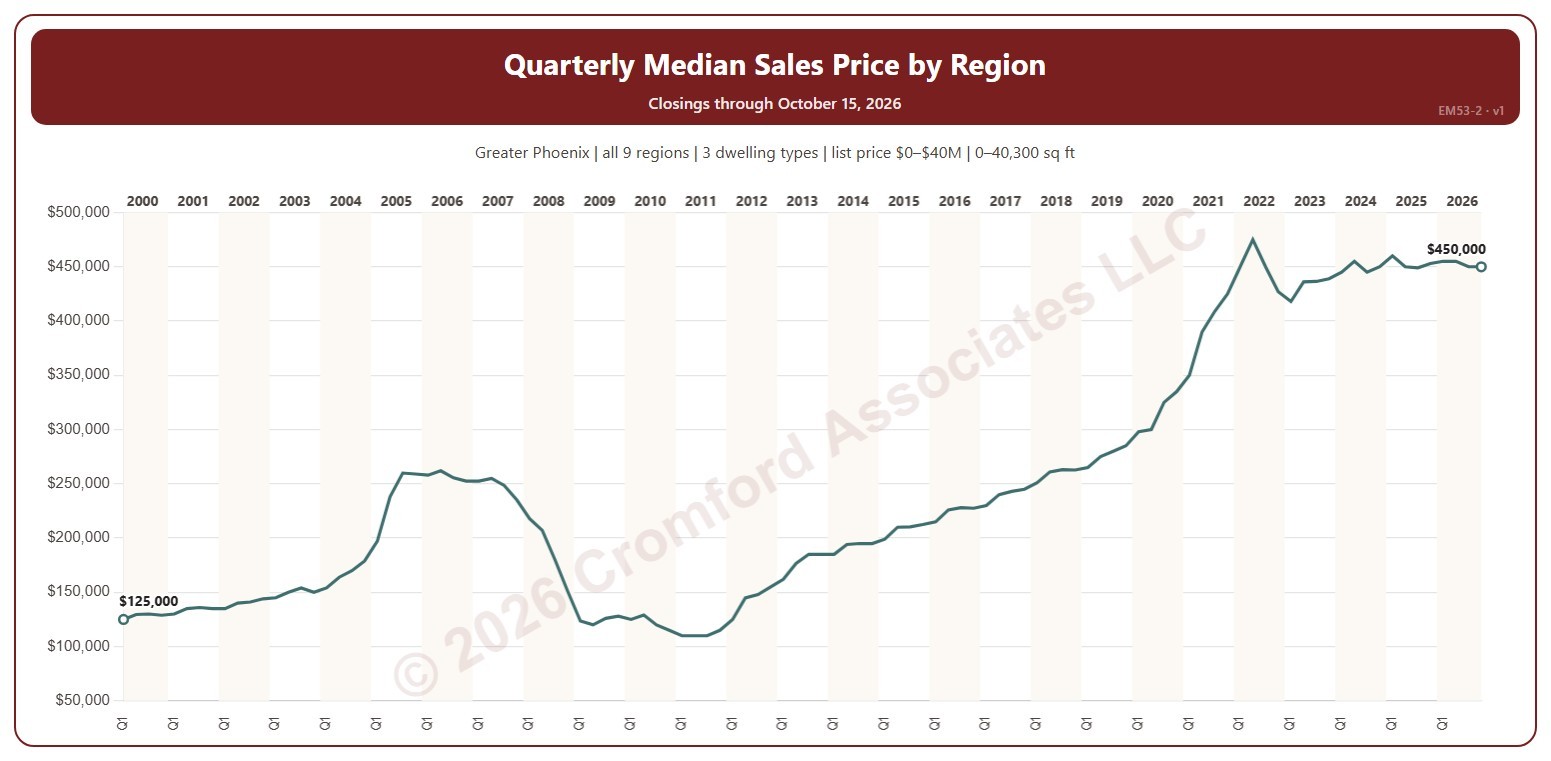
This chart shows the median sales price each quarter. The median sales price is the middle sale price of the homes that closed on ARMLS in the period: half sold for more and half for less.

It opens on the first quarter of 2000 to date; drag the handles of the date slider under the chart to choose the quarters shown. The newest quarter is the quarter so far. The chart is updated every day.

It opens on the Greater Phoenix area: the counties, cities, and ZIP codes that make it up are ticked to start with. Tick or untick any of them to change the area, including counties beyond Greater Phoenix. Use the Region boxes to pick any of the nine Greater Phoenix regions; Other areas (unticked to start with) adds ZIP codes outside them, needed if you widen the area beyond Greater Phoenix. Narrow it further with the Dwelling Type, Transaction Type, and New / Resale boxes and the list price, home size, and year built sliders.

Hover over the line to see the median and the number of closings that quarter.