Cromford® Price Index – Rest of Arizona

About this chart

The Cromford® Price Index as a level for the Arizona regions outside Greater Phoenix, one region at a time, measured from recorded home sales (county deeds) rather than MLS closings. Recorded sales include homes sold without an agent and towns the MLS barely covers, such as Winslow, Page and Williams, and in most regions there are several times as many of them.

Every region is set to 100 on January 1, 2020, the same base date as the Greater Phoenix chart, so a reading of 120 means prices for comparable homes are 20% higher than on January 1, 2020. In Rim Country the county records only identify the kind of sale from 2021, so its earlier sales count only where they also went through the MLS; too few of those were recorded in the first half of 2020, so its line has a gap there.

Each point covers the homes recorded in the 3 months up to that week, measured every week. Recorded sales reach us some time after the sale, so the newest point is two to three months old. Only normal sales of homes count: foreclosures, sales of several parcels together and, where the records say so, sales between related parties are left out. Unlike the median sales price, the index is not moved by changes in which homes happen to sell. It counts resales only, every dwelling type together.

Median, the default, follows the typical home; Value-weighted lets dearer homes count for more. The Inflation option shows the index in today’s dollars. Tucson, Copper Corridor, Western Arizona, Graham / Greenlee and Yuma are not included. Greater Phoenix is on the Cromford® Price Index by Region. Hover over the line to see the figure for that week and the number of sales behind it.

Cromford® Price Index by Region

About this chart

The Cromford® Price Index shown as a level rather than a yearly change: January 1, 2020 = 100, so a reading of 150 means prices for comparable homes are 50% higher than at January 1, 2020, and 90 means 10% lower. Each point covers the homes that closed in the 3 months up to that week, measured every week back to 2001.

Unlike the median sales price or the median price per square foot, the index is not moved by changes in which homes happen to sell. It counts resales only: a new home’s first sale is left out, so every period compares the same kind of sale.

Two ways to read it. Median, the default, follows the typical home: every home counts the same. Value-weighted lets dearer homes count for more, as the S&P CoreLogic Case-Shiller index does, so it shows what happened to the total value of the homes sold. The two part when cheaper and dearer homes move differently, as they have since 2022.

Sales offers All sales or Normal sales only. Normal sales only leaves out REO, short and HUD sales, which made up most resales in 2009 to 2011 and sold well below other homes, so the choice matters mainly for those years.

It covers the eight Greater Phoenix regions; the rest of Arizona has its own chart, the Cromford® Price Index – Rest of Arizona. To keep every figure reliable, a point is shown only where at least 100 homes closed in its 3 months and in the 3 months to January 1, 2020, and the Region and Dwelling Type lists offer only the regions and home types that reached 100 closings in every 3-month span of the last two years; smaller home types are grouped as Other types. The Inflation option shows the index in today’s dollars, using national or Phoenix inflation. Hover over the line to see the figure for that week and the number of sales behind it.

Quarterly Median Sales Price per Square Foot by Region

About this chart

This chart shows the median sales price per square foot of homes that closed through ARMLS, measured every week. Each point covers the homes that closed in the three months up to that week. Price per square foot lets you compare homes of different sizes; the median is the figure in the middle, so a few unusual sales move it less than an average.

Each year has its own line, laid out by week of the year, so you can compare this year with earlier years at the same point in the season. It opens on the last three years; tick any year back to 2001 in the Year panel.

It opens on the eight Greater Phoenix regions. Use the Region panel to focus on one region or compare a combination of them. Narrow it with the Dwelling Type, Transaction Type, and New / Resale boxes and the sales price, home size, and year built sliders. The Inflation (CPI) option restates prices in today’s dollars using national or Phoenix inflation.

Hover over a line to see the exact figure for that week.

Price Changes, Days at the Final Price and Sale Price by Region – Current Year

About this chart

This chart shows how many times homes that closed this year changed their list price before going under contract, and what that meant for how long they took to sell and the price they sold for, by region. Each closed resale is grouped by the number of list price changes before the contract that closed, from none to five or more. Price increases and price cuts both count as a change.

The top chart compares two figures for each group. The wide bar is the median Cromford® Days on Market. The solid bar inside it is the median number of days the home spent at its final list price, the price that found the buyer. However long a home was on the market, the time it spent at the price that sold it is usually much shorter.

The lower left chart shows the median sale price as a percentage of the final list price (solid line) and of the initial list price (dashed line). The lower right chart shows the share of closings in each group.

The map shades every ZIP code with its region’s figure for the current year, so each region reads as one block. A few ZIP codes lie in two regions; they are striped in both regions’ shades and their closings count in both. Regions not ticked in the Region panel are faded. Click a ZIP code to show its region alone in the charts.

It covers closings in the current year to date only; for earlier years and year-to-year comparisons see PCRG01. Days count while the home was Active or Coming Soon, up to the contract that closed. A contract that fell through does not reset the count. New construction is excluded. The chart opens on the Greater Phoenix regions, with manufactured and modular homes left out.

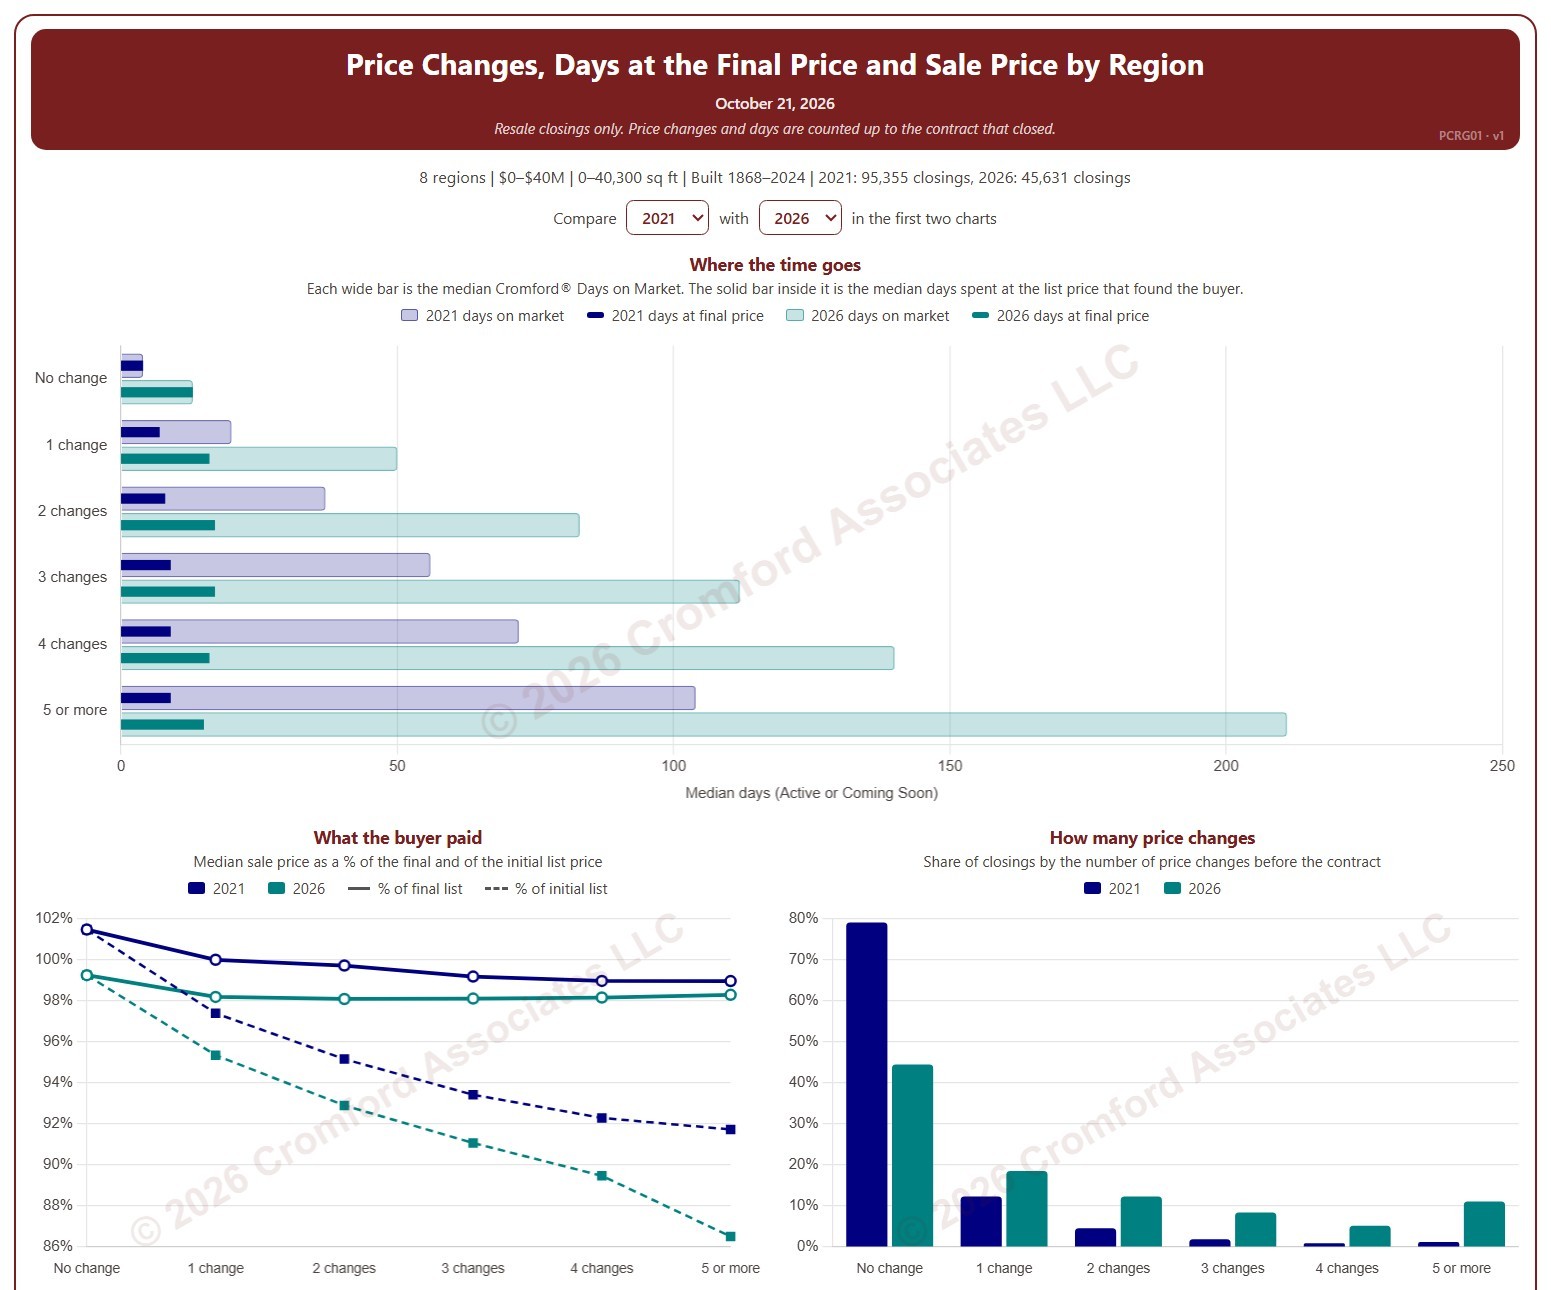
Price Changes, Days at the Final Price and Sale Price by Region

About this chart

This chart shows how many times homes changed their list price before going under contract, and what that meant for how long they took to sell and the price they sold for, by region. Each closed resale is grouped by the number of list price changes before the contract that closed, from none to five or more. Price increases and price cuts both count as a change.

The top chart compares two figures for each group. The wide bar is the median Cromford® Days on Market. The solid bar inside it is the median number of days the home spent at its final list price, the price that found the buyer. However long a home was on the market, the time it spent at the price that sold it is usually much shorter.

The top two charts compare any two years from 2020 on, picked with the selectors above them. The lower left chart shows the median sale price as a percentage of the final list price (solid line) and of the initial list price (dashed line). The lower right chart shows the share of closings in each group for the years ticked in the Year panel.

The map shades every ZIP code with its region’s figure for one year at a time, chosen with the year selector above it, so each region reads as one block. A few ZIP codes lie in two regions; they are striped in both regions’ shades and their closings count in both. Regions not ticked in the Region panel are faded. Click a ZIP code to show its region alone in the charts.

Days count while the home was Active or Coming Soon, up to the contract that closed. A contract that fell through does not reset the count. New construction is excluded. Years are by closing date, and the current year is year to date. The chart opens on 2021 and the current year in the Greater Phoenix regions, with manufactured and modular homes left out.

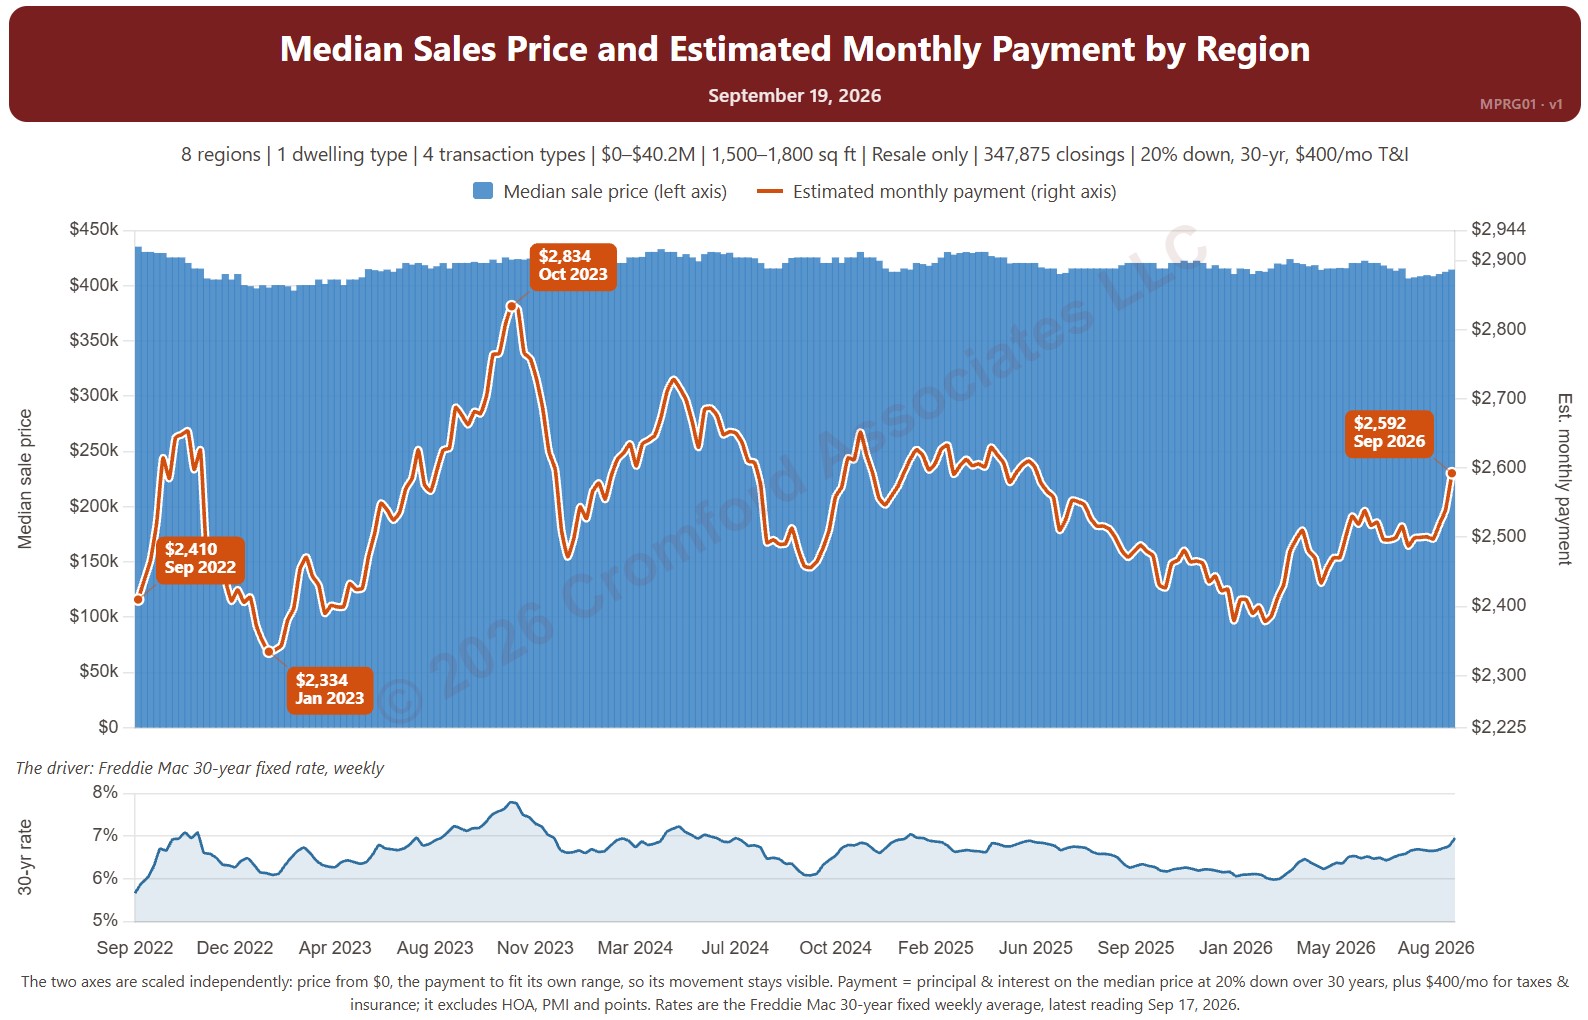
Median Sales Price and Estimated Monthly Payment by Region

About this chart

This chart sets the median sales price beside the estimated monthly payment needed to buy a home at that price, measured every week, with the 30-year fixed mortgage rate (Freddie Mac Primary Mortgage Market Survey®) in the panel below. It shows how affordability changes as both prices and rates move.

The default view is single-family resale homes of every size over the last four years. The payment assumes 20% down, a 30-year loan, and taxes and insurance of 1.2% of the sales price a year. The Payment panel changes the assumptions, and Reset assumptions puts them back.

It opens on the eight Greater Phoenix regions. Use the Region panel to focus on one region or compare a combination of them. Narrow it with the Dwelling Type, Transaction Type, and New / Resale boxes and the sales price and home size sliders. The 1 yr, 3 yr, 5 yr, 10 yr, and Full range buttons set the stretch of history shown.

Hover over the chart to see the figures for that week.

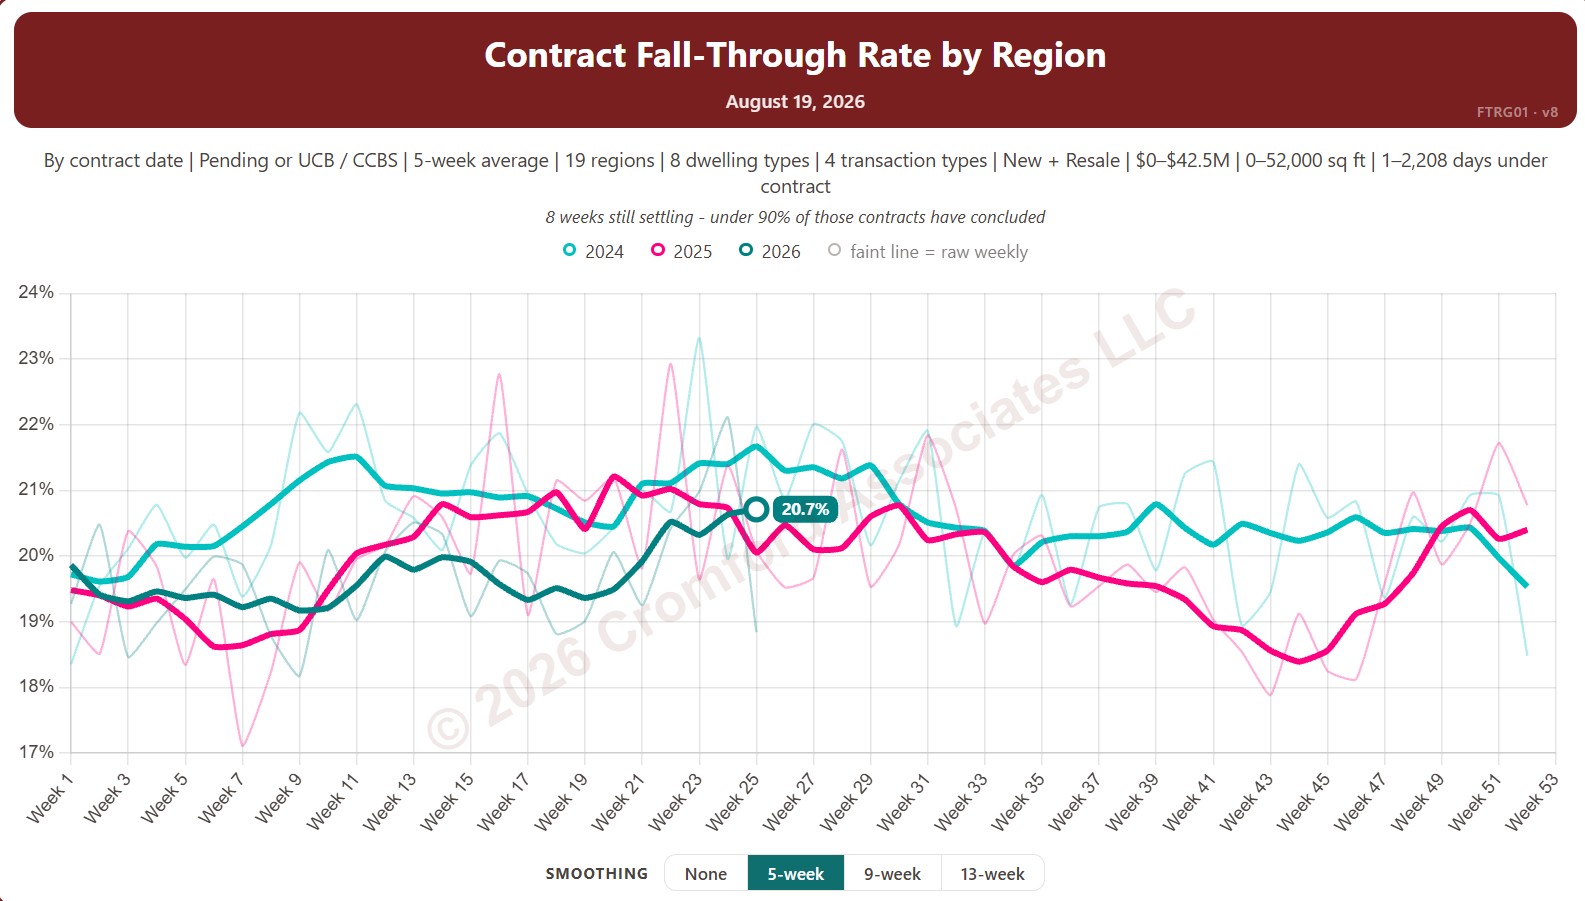
Contract Fall-Through Rate by Region

About this chart

This chart shows the contract fall-through rate, measured every week: the share of accepted contracts that ended without the home closing, for example because financing or an inspection failed. The lines show a 5-week average to smooth out week-to-week noise.

By default contracts are counted by the date they were accepted and include Pending and UCB / CCBS contracts. Rate Basis switches to the date each contract ended, and Listing Status can limit it to Pending contracts only.

Each year has its own line, laid out by week of the year, so you can compare this year with earlier years at the same point in the season. It opens on the last three years; tick any year back to 2011 in the Year panel.

It opens with every Arizona region included. Use the Region panel to focus on one region or compare a combination of them. Narrow it with the Dwelling Type, Transaction Type, and New / Resale boxes and the list price, home size, and days under contract sliders.

Hover over a line to see the exact figure for that week.

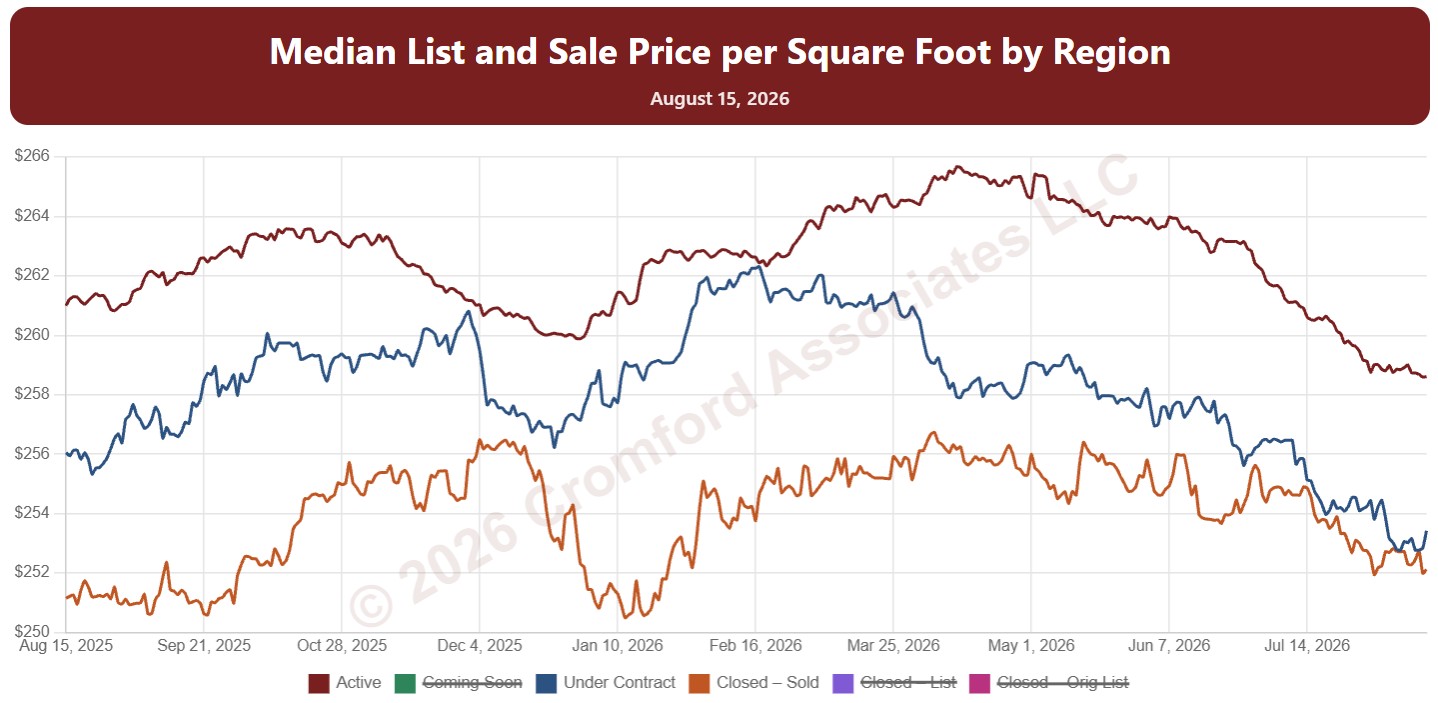
Median List Price per Square Foot by Region

About this chart

This chart shows median price per square foot every day over the last 12 months, with one line each for Active, Coming Soon, and Under Contract listings (their list prices) and three for homes that closed: the sale price, the final list price, and the original list price.

Reading the lines together shows the gap between what sellers ask and what buyers pay, and how much prices were cut along the way.

It opens with every Arizona region included. Use the Region panel to focus on one region or compare a combination of them. Narrow it with the Dwelling Type, Transaction Type, and New / Resale boxes and the list price, home size, and year built sliders.

Hover over the chart to see each figure for that day.

Annual Closed Listings by Region

About this chart

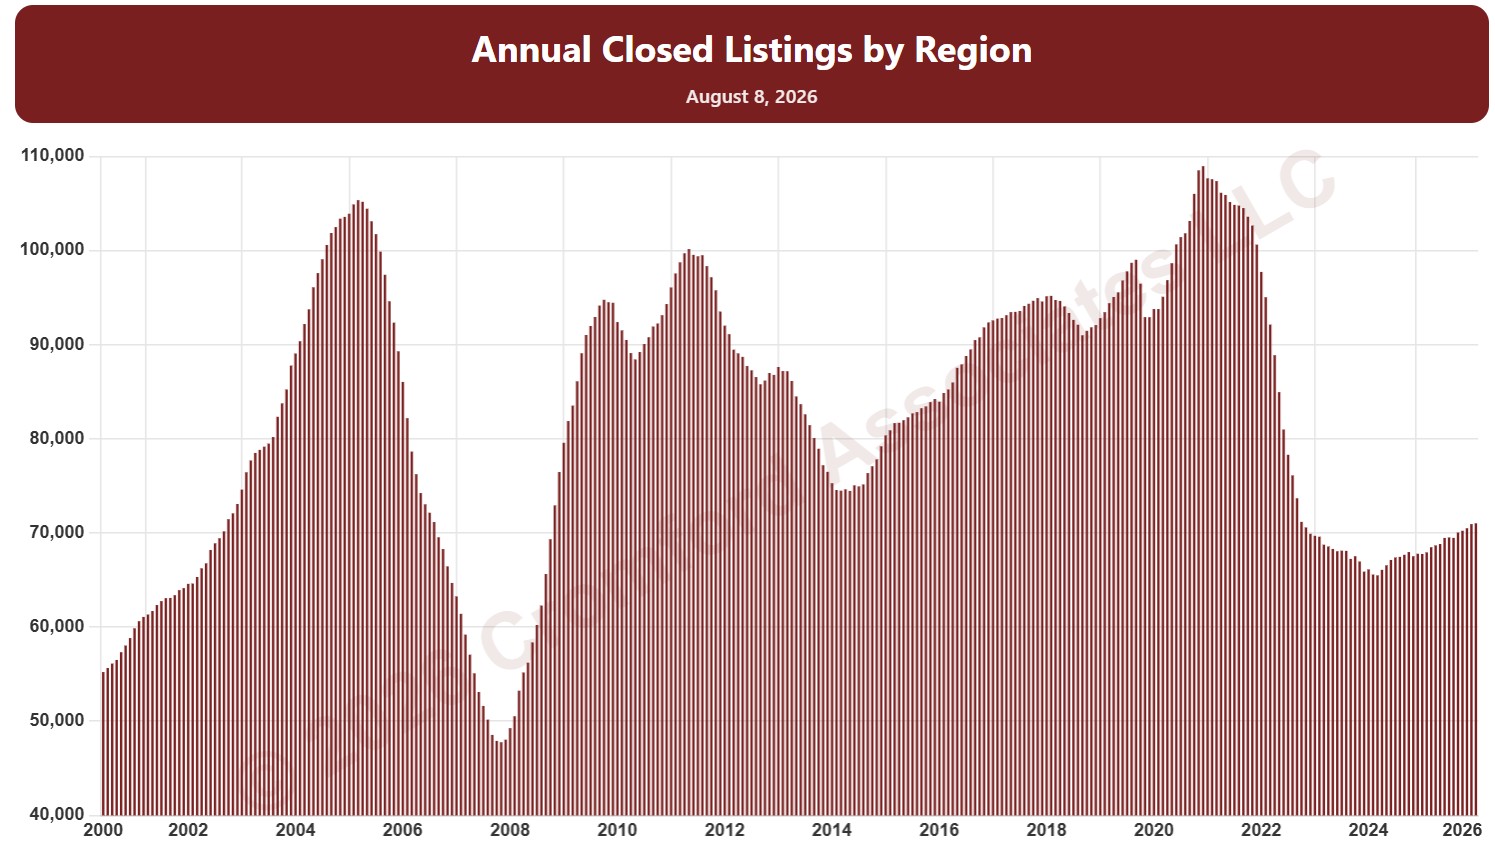
This chart counts the homes that closed through ARMLS over the last 12 months, measured on the 1st of every month, as one continuous series of bars back to 2000. It is the same measure as SARG11 laid out as a single timeline instead of one line per year.

It opens on the eight Greater Phoenix regions. Use the Region panel to focus on one region or compare a combination of them. Narrow it with the Dwelling Type, Transaction Type, and New / Resale boxes and the sales price, home size, and year built sliders. Use the date slider, or Full range, to choose the stretch of history shown.

Hover over a bar to see the exact figure for that month.

Active Listings by Region

About this chart

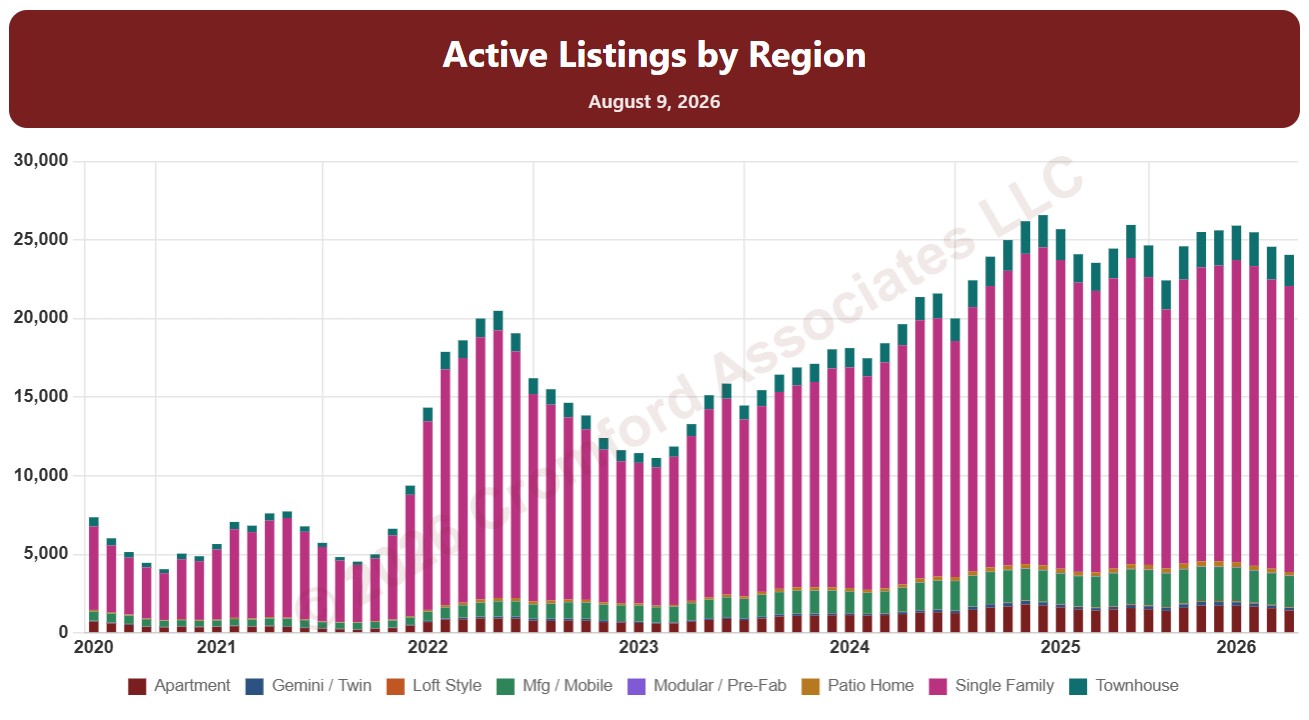
This chart counts the homes listed for sale on ARMLS on the 1st of every month since January 2011, as stacked bars.

By default it counts Active listings. Tick Coming Soon, UCB / CCBS (under contract but still accepting back-up offers), or Temp Off Market in the List Status panel to add them to the stack. A drop-down chooses what the bars are split by: list status, dwelling type, transaction type, or new / resale.

It opens with every Arizona region included. Use the Region panel to focus on one region or compare a combination of them. Narrow it with the Dwelling Type, List Status, Transaction Type, and New / Resale boxes and the list price, home size, year built, and days on market sliders. Use the date slider, or Full range, to choose the stretch of history shown.

Hover over a bar to see the counts for that month.