
About this chart
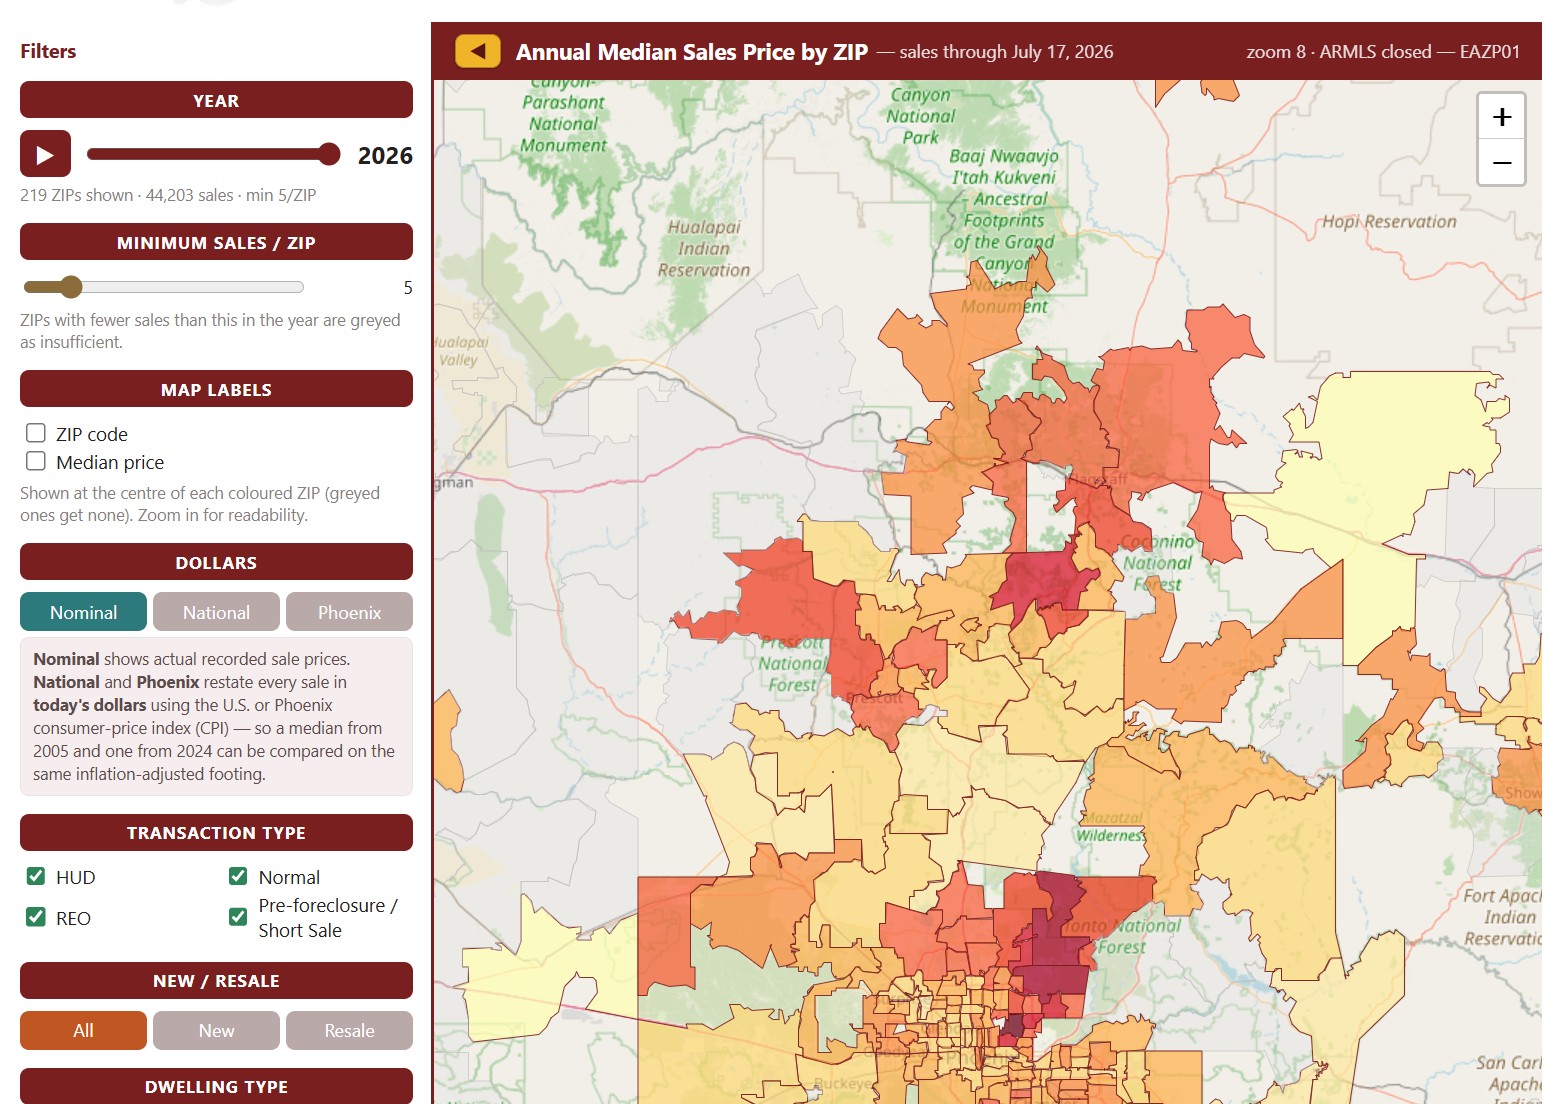
This map colors each ZIP code by the median sales price of the homes that closed through ARMLS in one calendar year, from under $200K to $3M and over. It opens on the current year, which covers the sales recorded so far; move the Year slider, or press play, to step through every year back to 2001.
ZIP codes with fewer sales than the Minimum Sales / ZIP setting (5 to start with) are grayed out as having too little data. Map Labels shows the ZIP code or its median price on the map; zoom in to read them. Dollars switches between actual sale prices and prices restated in today’s dollars using national or Phoenix inflation.
Narrow the sales counted with the Transaction Type and Dwelling Type boxes, the All / New / Resale buttons, and the price and square foot sliders.