HOA Fees for High-Rise Condos

About this chart

This chart shows the monthly HOA fees stated in ARMLS listings for 35 high-rise condo buildings in Maricopa County, from 1999 to the latest listing shown at the top. The fee is the total monthly amount for every association the unit belongs to. Listings that do not give a fee are left out.

Pick a building from the Building list; the chart opens on 3rd Avenue Lofts. The Summary view has two charts. The first shows each listing as a bubble at its list date and fee, and a bigger bubble is a bigger unit. The second shows the median and average fee for each calendar year; the current year runs only to the latest listing. The tiles above give the number of listings, the median and average for the latest full year, and the latest listing.

Use Show to switch between the monthly fee and the fee per square foot, and Dollars to switch between the fees as listed and fees adjusted for inflation, restated in today’s dollars using the US Consumer Price Index. The Detailed view shows all six charts at once: the fee and the fee per square foot for every listing, and the yearly median and average of each, both as listed and adjusted for inflation.

The median is the better guide to a typical fee: one unusual unit moves the average but not the median. Hover over a bubble to see the unit, MLS number, list date, fee, size, and fee per square foot.
Foreclosures per Month – Monthly

About this chart

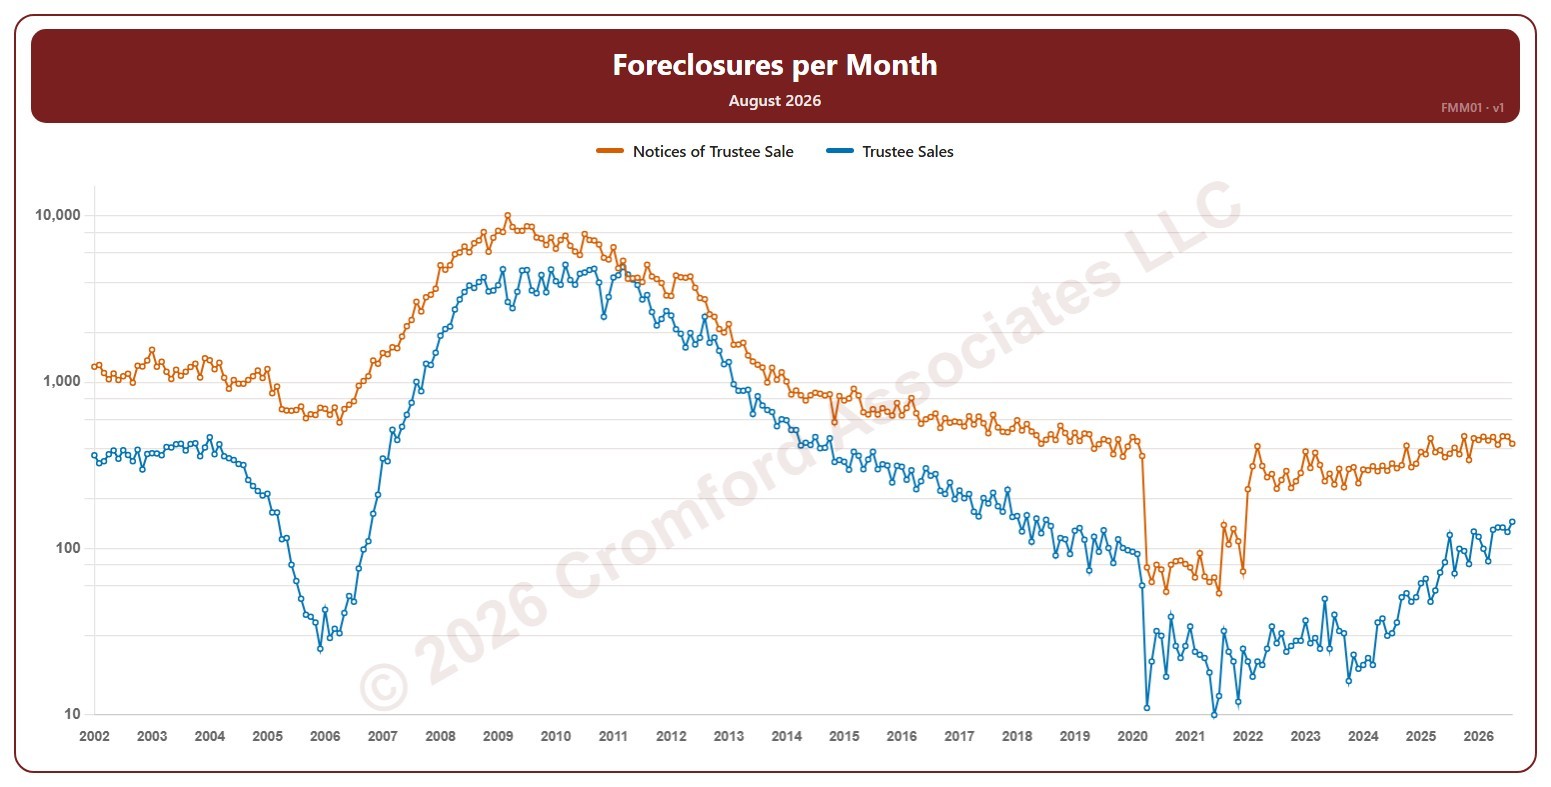
This chart shows foreclosure activity on residential properties in Maricopa County, recorded each month since January 2002, as two lines: Notices of Trustee Sale (a lender starting to foreclose) and Trustee Sales (the foreclosure auctions that went ahead). Many notices are later canceled, which is why the notices line runs well above the sales line. The value axis is logarithmic, so equal steps up the axis are equal percentage changes; this keeps both the extreme years and today readable.

Use the Notices of Trustee Sale and Trustee Sales buttons to show or hide each line. Hover over the chart to see the figures for that month.

Foreclosures Pending – Weekly

About this chart

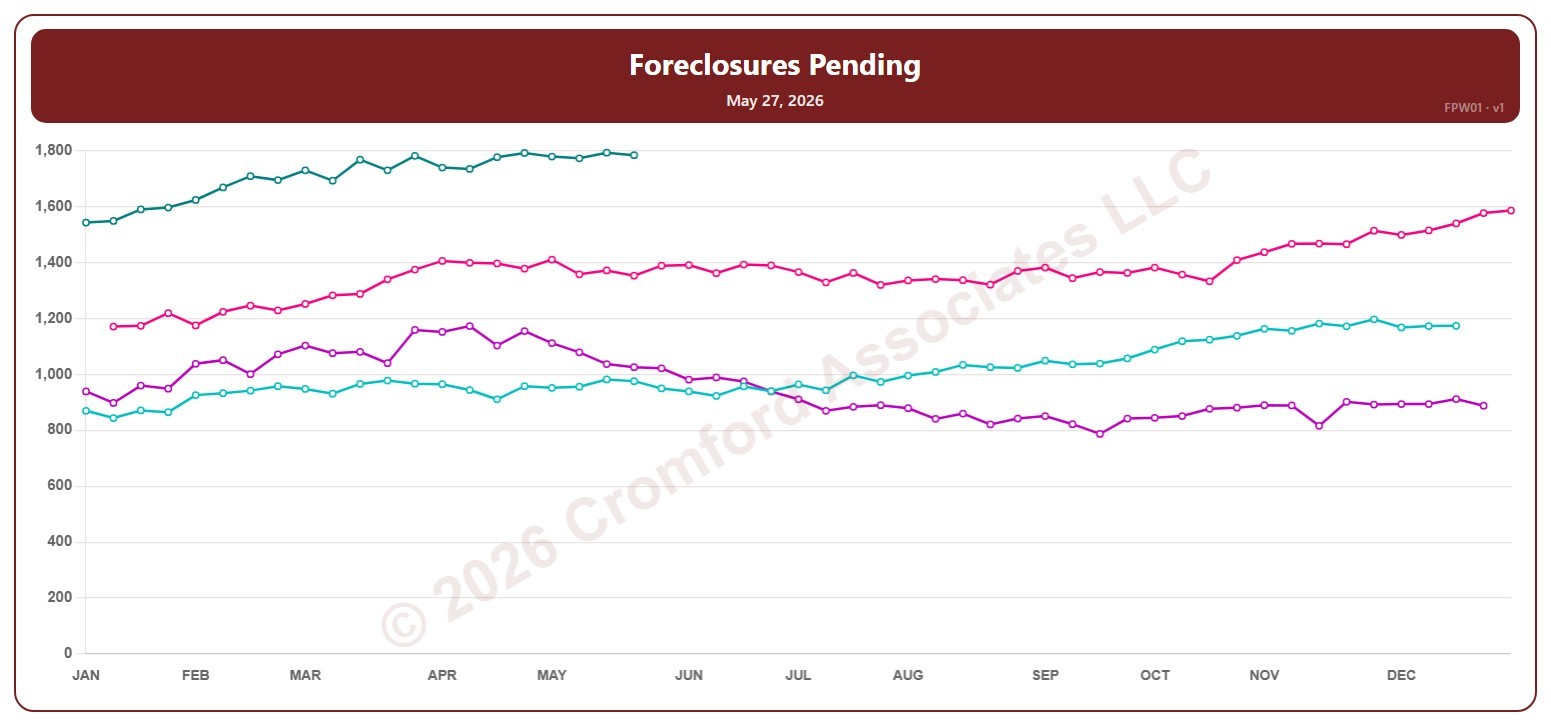
This chart counts the properties in Maricopa County with a foreclosure pending, measured every week: homes where a Notice of Trustee Sale has been recorded and the case has not yet been resolved.

Each year has its own line, laid out by week of the year, so you can compare this year with earlier years at the same point in the season. It opens on the last four years; tick any year back to 2002 in the Year panel.

Hover over a line to see the exact figure for that week.

Turnover by ZIP Code

About this chart

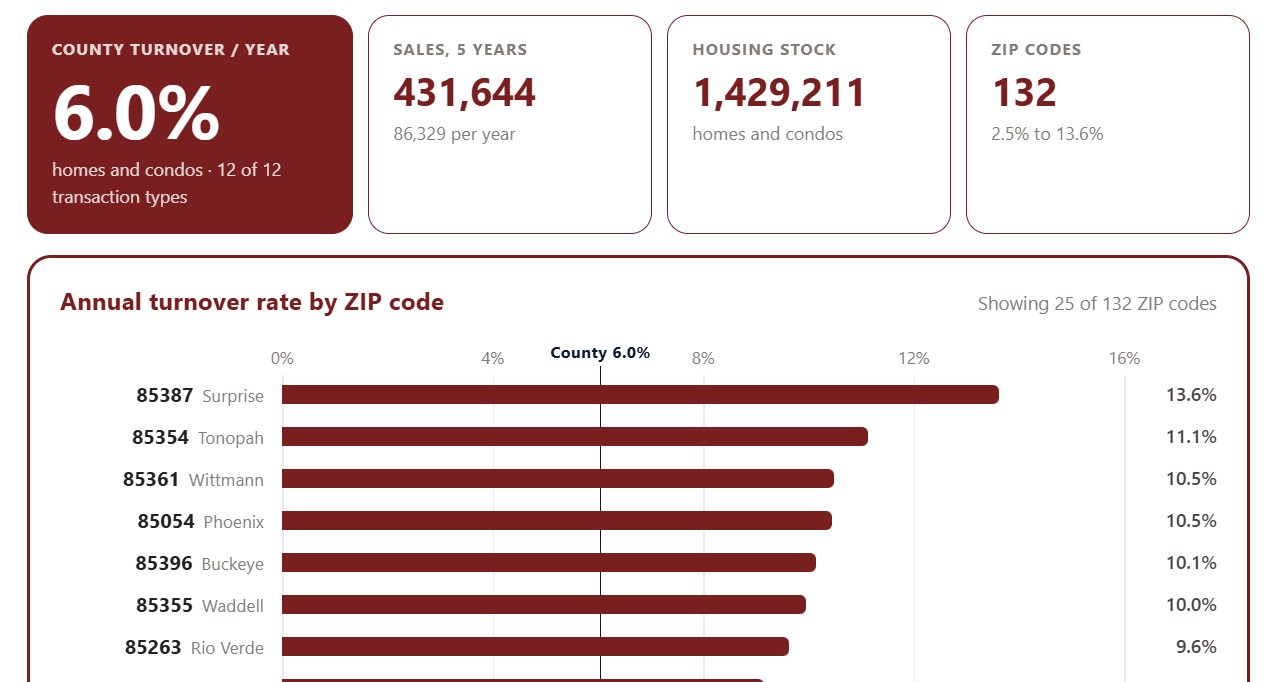
This chart ranks Maricopa County ZIP codes by turnover: the share of each ZIP code’s homes that change hands in a typical year, averaged over the last five years. High turnover marks an active market where homes come up for sale often; low turnover means owners tend to stay put.

It opens on the top 25 ZIP codes. Show switches to the top 50 or all ZIP codes, Sort ranks them by turnover, sales volume, housing stock, or ZIP code, and All, Homes, and Condos choose the property type. The transaction type boxes narrow the sales counted.

Chart and Table switch between the ranked bars and the same figures as a table.