Property Value Estimate

About this chart

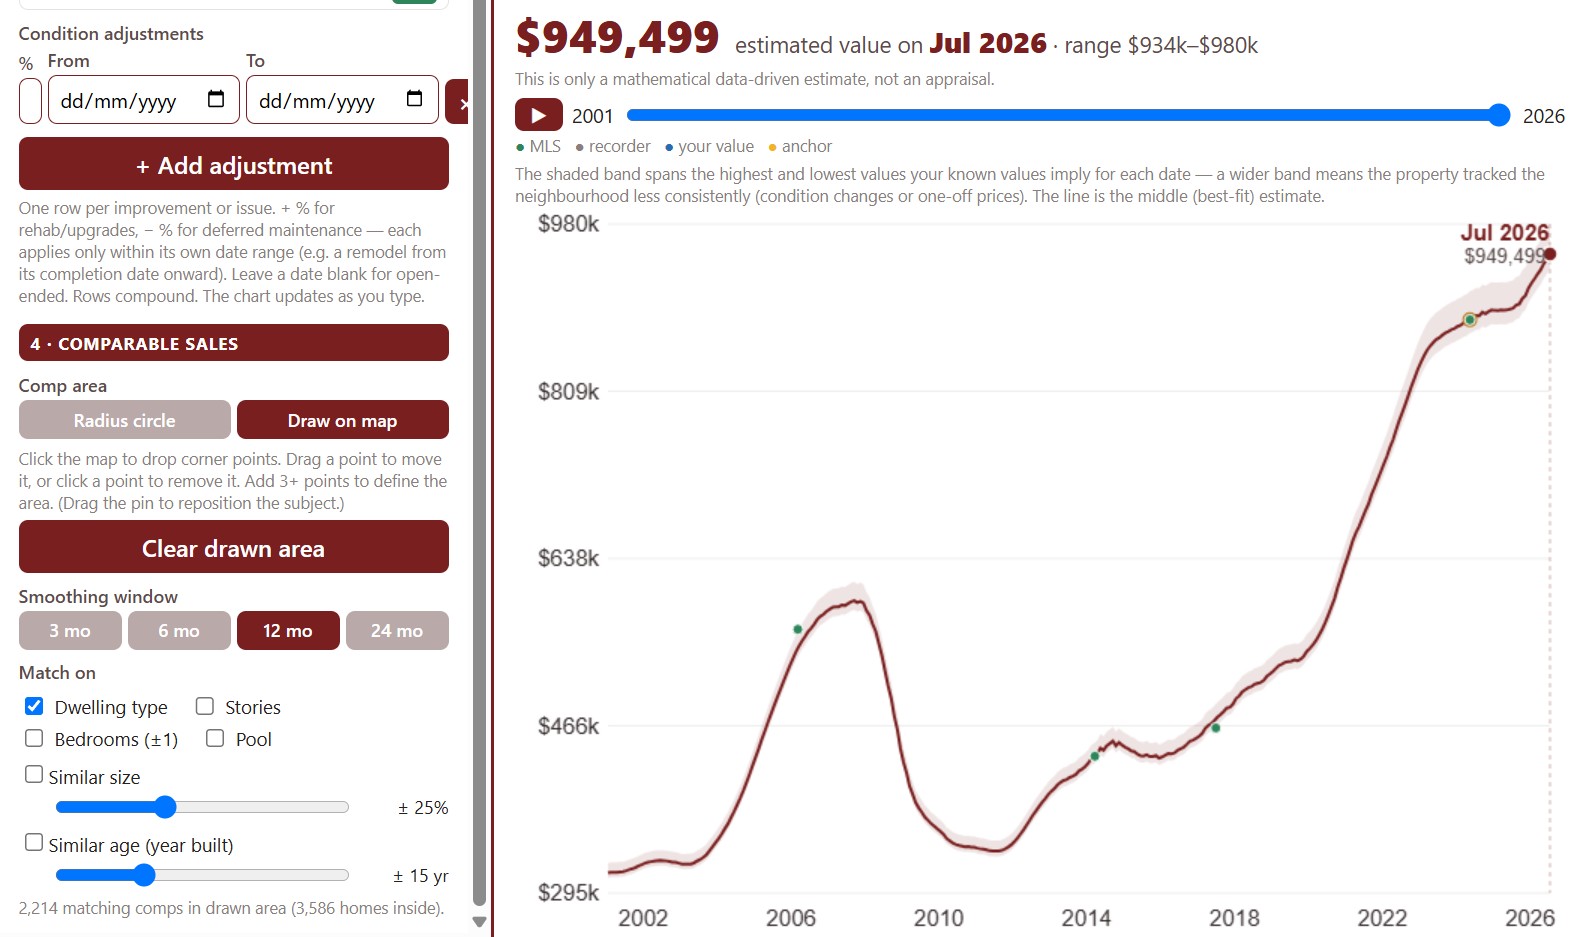
This tool estimates what a home is worth on any date, starting from a value you know on a known date, such as its last sale price, and moving it with the price trend of similar homes sold nearby. It is a data-driven estimate, not an appraisal.

Find the property by address, confirm its details (you know them better than the county does), and choose the estimate basis: a single sale or a blend of its sales. Set the area the comparable sales come from with the radius circle or by drawing on the map.

Add adjustments for upgrades or deferred maintenance, each over its own dates, and the chart updates as you type.
Turnover by ZIP Code

About this chart

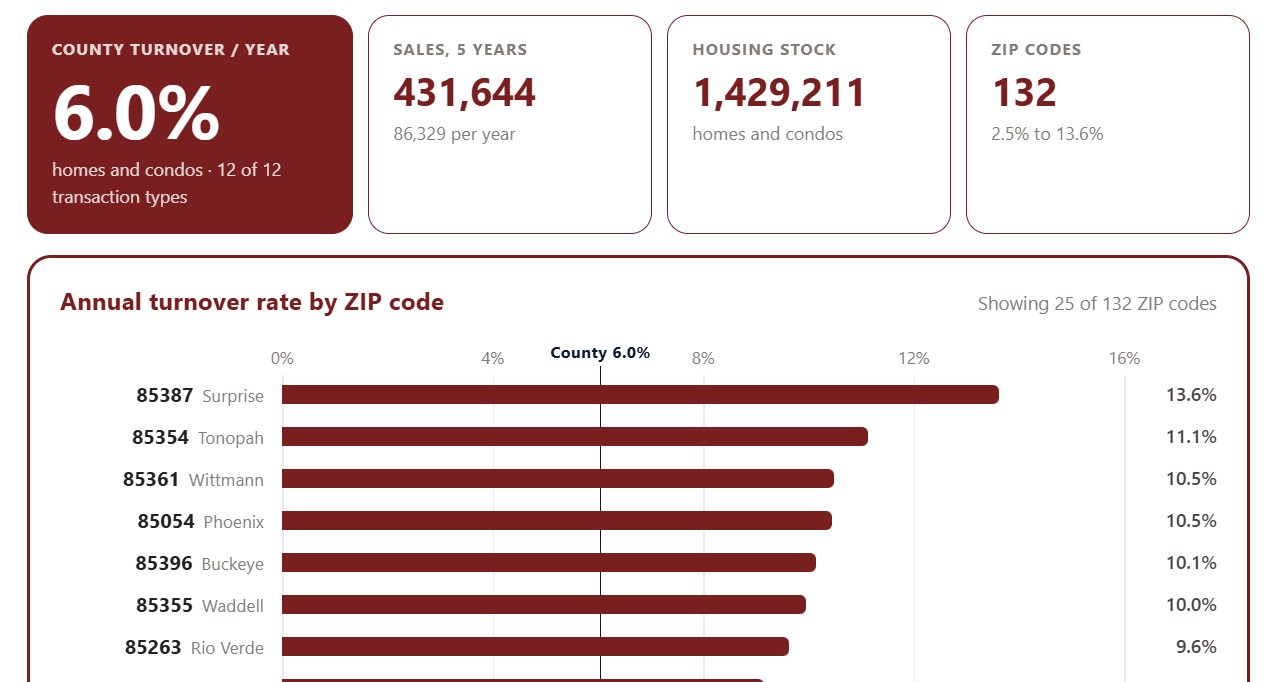
This chart ranks Maricopa County ZIP codes by turnover: the share of each ZIP code’s homes that change hands in a typical year, averaged over the last five years. High turnover marks an active market where homes come up for sale often; low turnover means owners tend to stay put.

It opens on the top 25 ZIP codes. Show switches to the top 50 or all ZIP codes, Sort ranks them by turnover, sales volume, housing stock, or ZIP code, and All, Homes, and Condos choose the property type. The transaction type boxes narrow the sales counted.

Chart and Table switch between the ranked bars and the same figures as a table.

Annual Average Sale Price per Square Foot by ZIP Code

About this chart

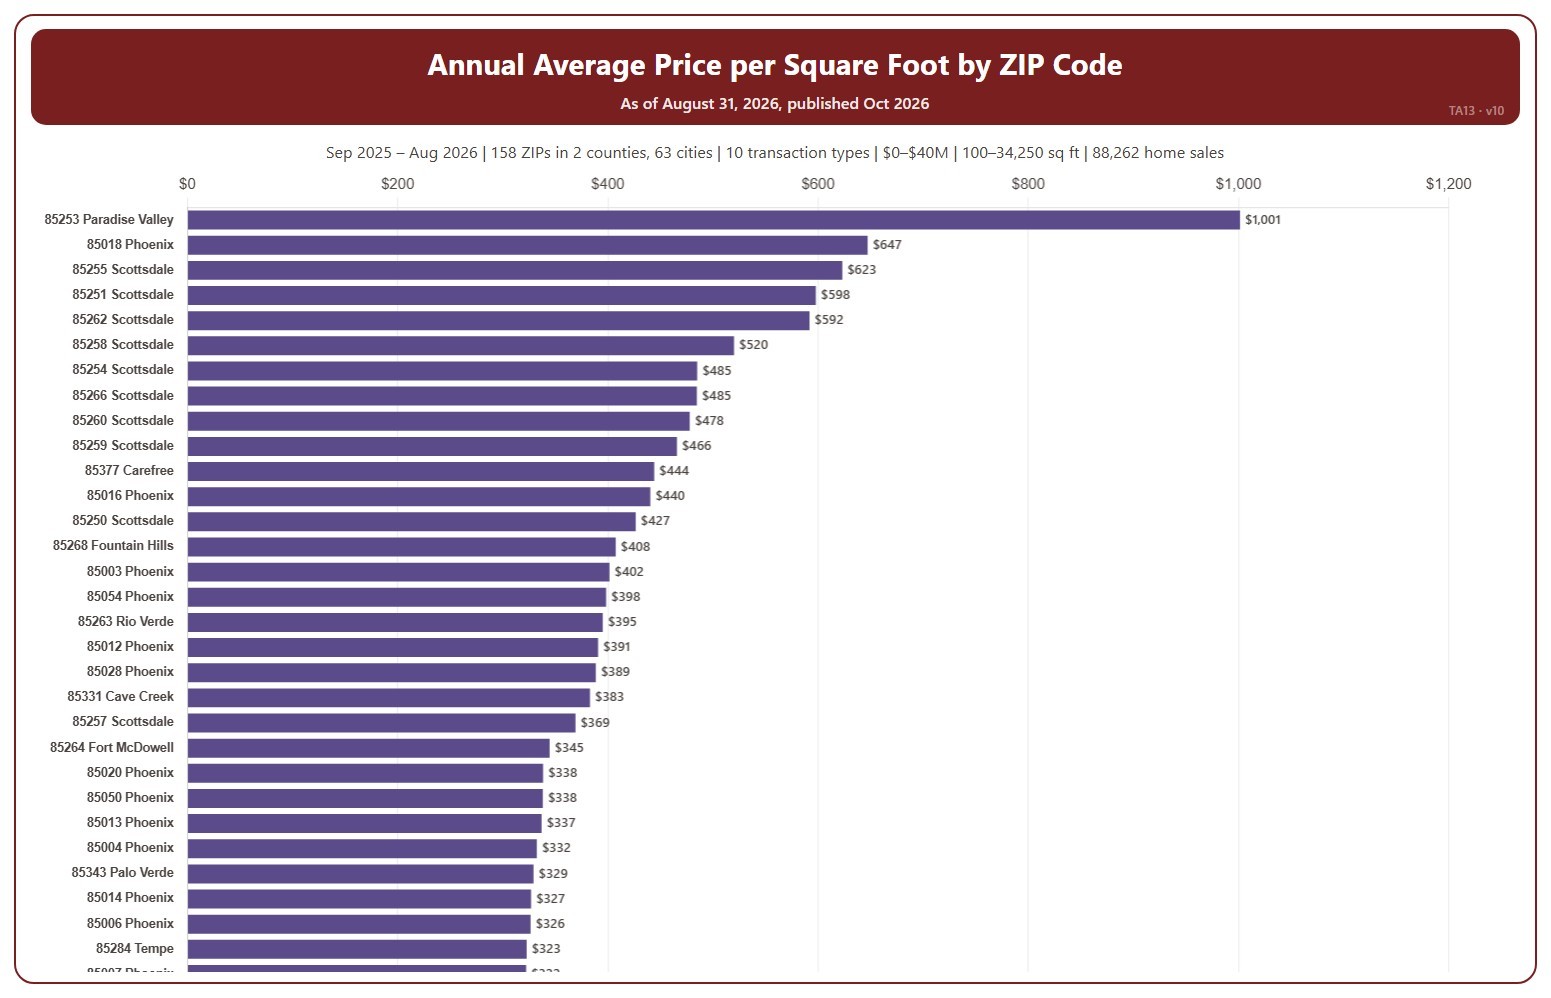
This chart ranks ZIP codes by the average price per square foot of the homes sold, from residential deeds recorded by Maricopa and Pinal Counties. Price per square foot lets you compare homes of different sizes. Because it is built from recorded deeds, it covers every recorded sale, not just homes listed on ARMLS: new homes, private sales, and investor deals are all included.

It opens on the last 12 months of records; use the Recording Month slider to choose the months covered. The list scrolls.

It opens on Maricopa and Pinal Counties with everything included. Narrow it with the County, City, and ZIP panels, the Transaction Type, Property Type, and 55+ Communities boxes, and the sale price and home size sliders.

Hover over a bar to see the exact figure for that ZIP code.

Annual Average Sales Price per Square Foot by City

About this chart

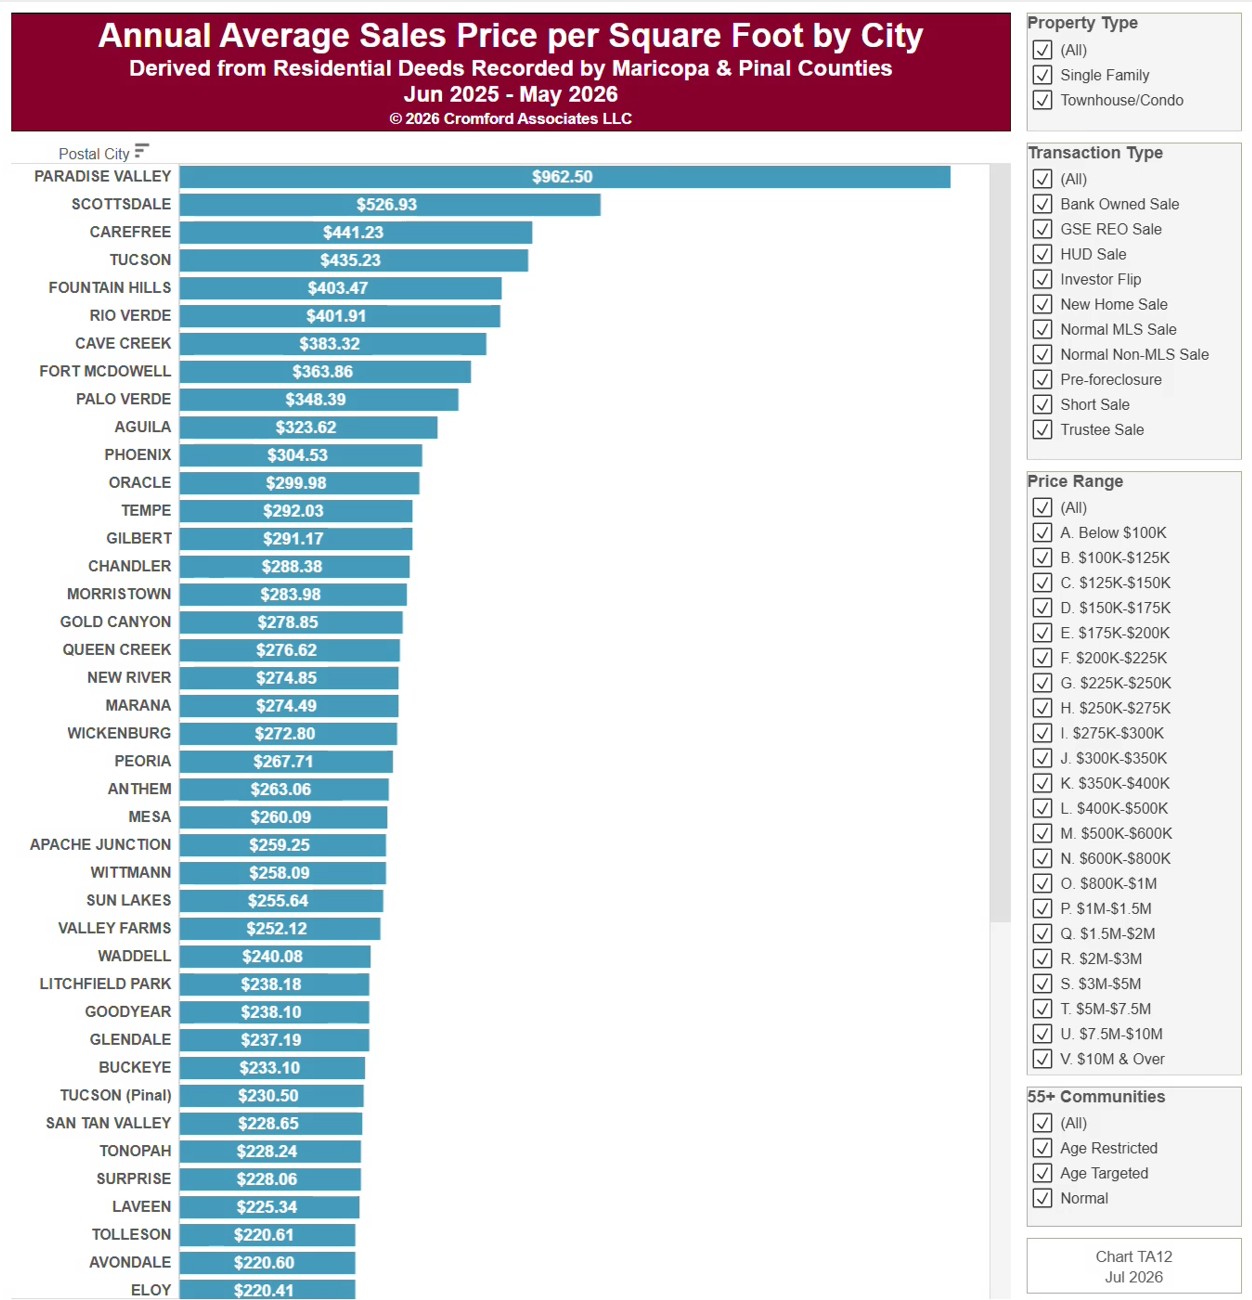
This chart ranks cities by the average price per square foot of the homes sold, from residential deeds recorded by Maricopa and Pinal Counties. Price per square foot lets you compare homes of different sizes. Because it is built from recorded deeds, it covers every recorded sale, not just homes listed on ARMLS: new homes, private sales, and investor deals are all included.

It opens on the last 12 months of records; use the Recording Month slider to choose the months covered. The list scrolls.

It opens on Maricopa and Pinal Counties with everything included. Narrow it with the County and City panels, the Transaction Type, Property Type, and 55+ Communities boxes, and the sale price and home size sliders.

Hover over a bar to see the exact figure for that city.

Annual Home Sales by ZIP Code

About this chart

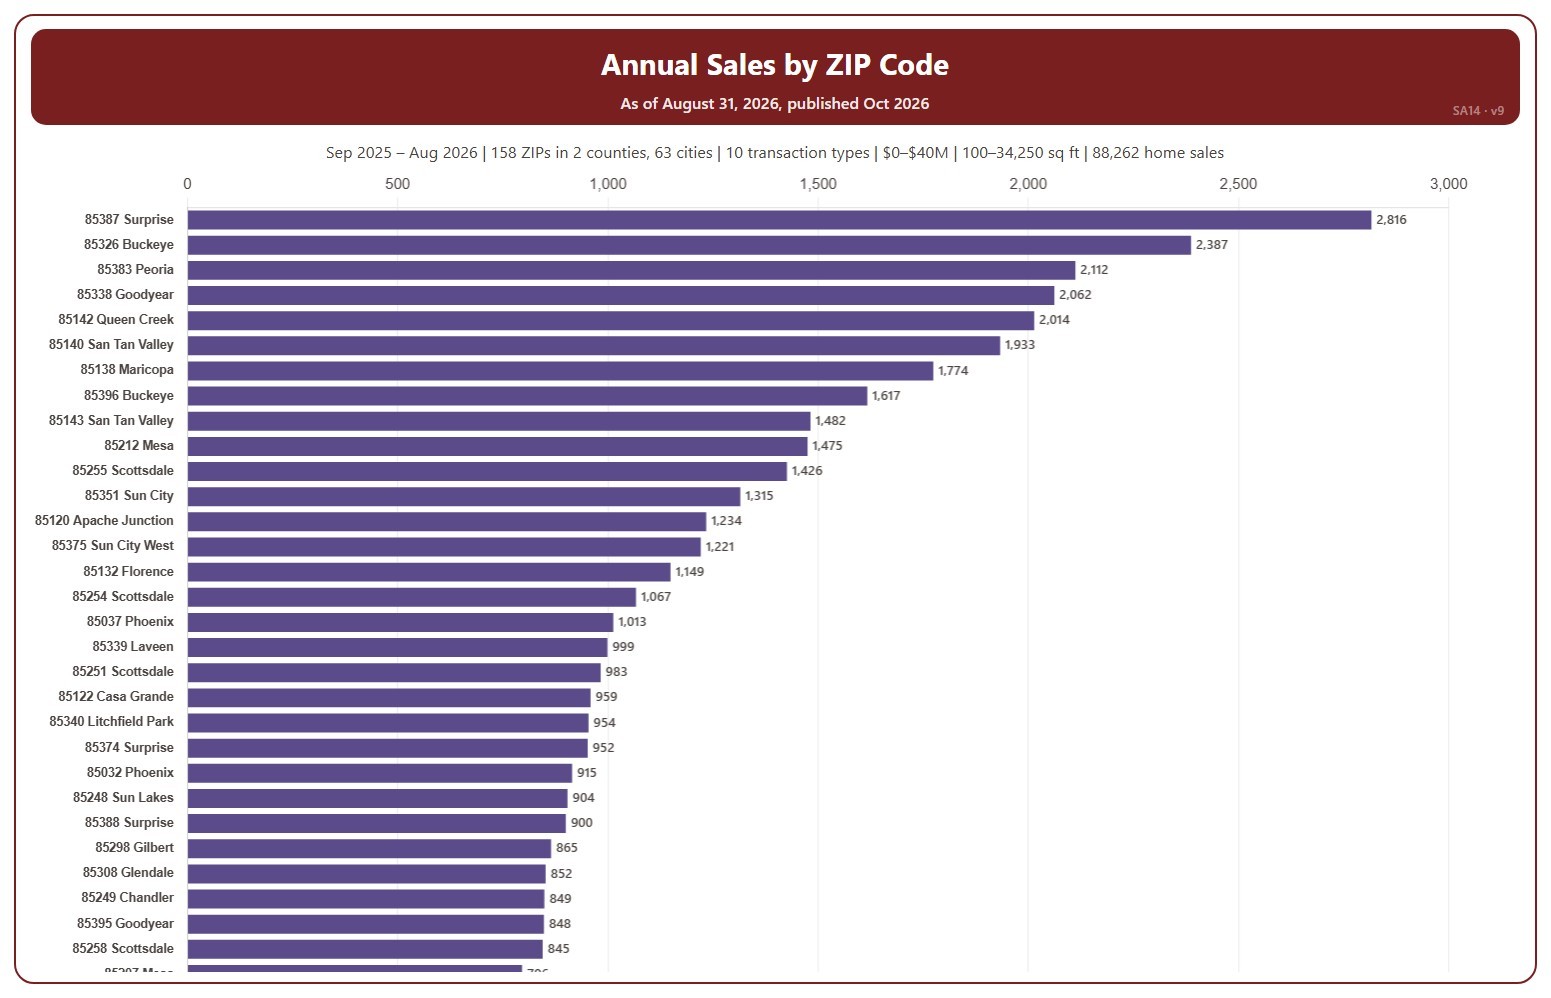
This chart ranks ZIP codes by the number of homes sold, from residential deeds recorded by Maricopa and Pinal Counties. Because it is built from recorded deeds, it covers every recorded sale, not just homes listed on ARMLS: new homes, private sales, and investor deals are all included.

It opens on the last 12 months of records; use the Recording Month slider to choose the months covered. The list scrolls.

It opens on Maricopa and Pinal Counties with everything included. Narrow it with the County, City, and ZIP panels, the Transaction Type, Property Type, and 55+ Communities boxes, and the sale price and home size sliders.

Hover over a bar to see the exact figure for that ZIP code.

Annual Sales by City

About this chart

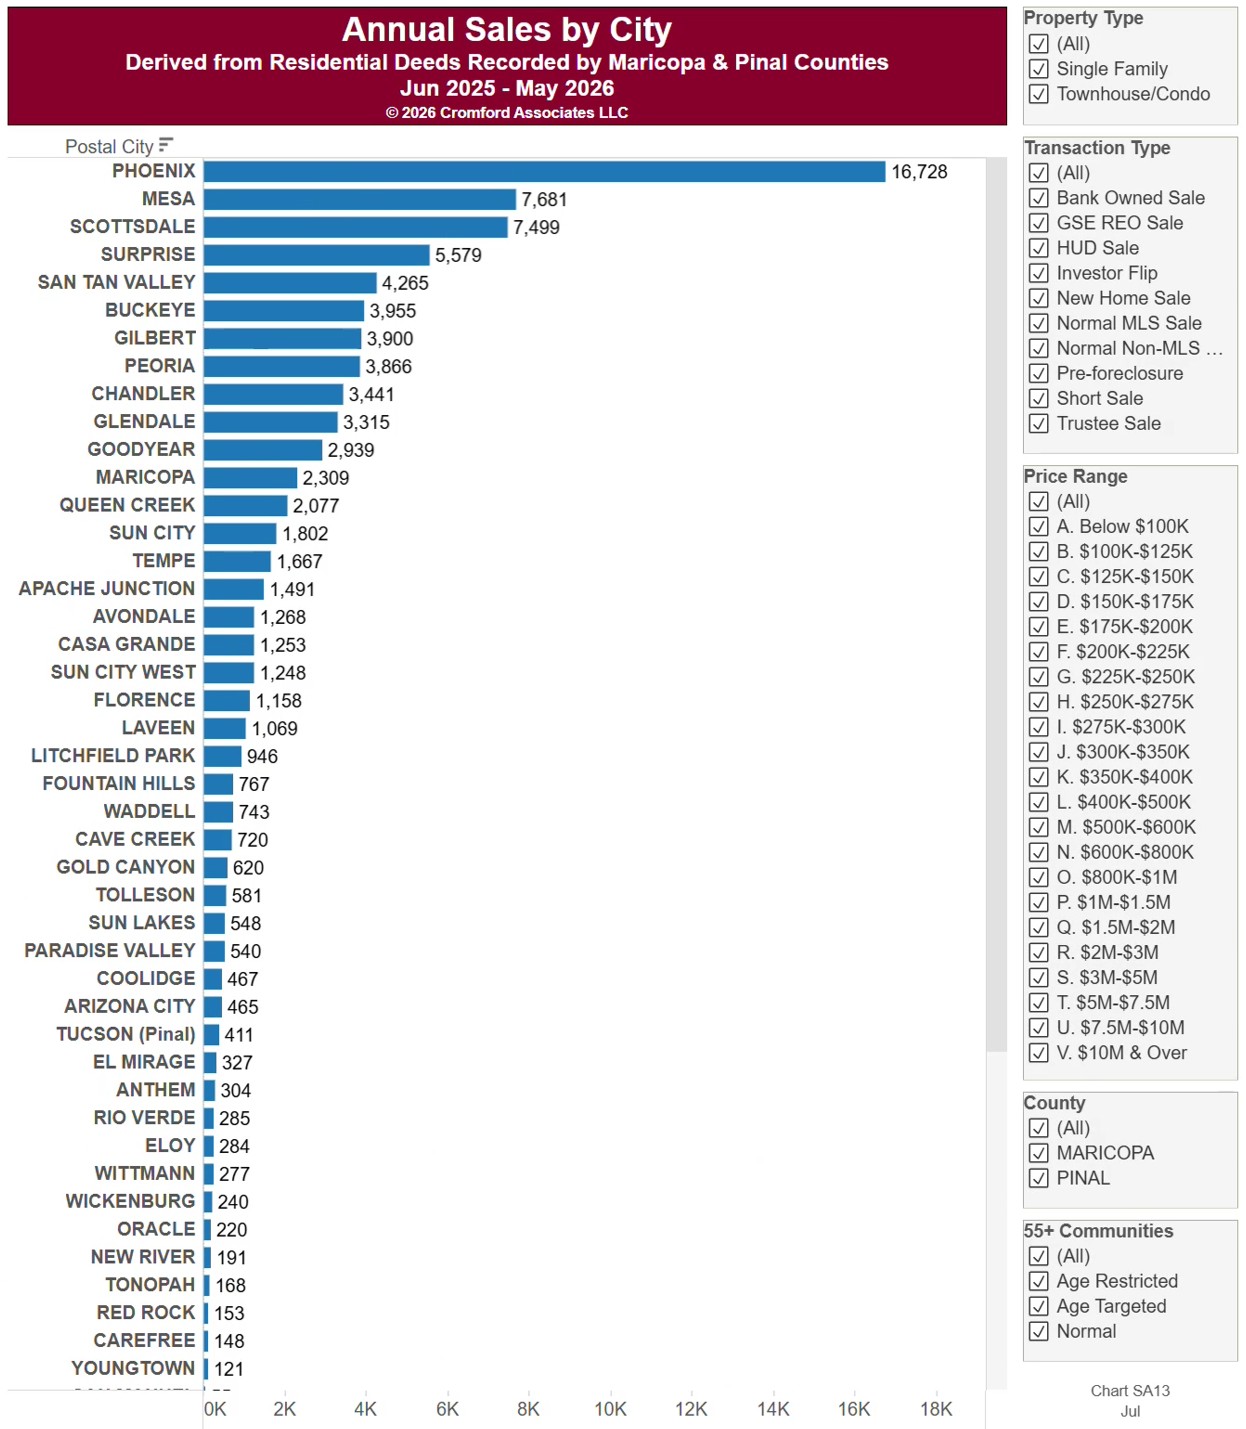
This chart ranks cities by the number of homes sold, from residential deeds recorded by Maricopa and Pinal Counties. Because it is built from recorded deeds, it covers every recorded sale, not just homes listed on ARMLS: new homes, private sales, and investor deals are all included.

It opens on the last 12 months of records; use the Recording Month slider to choose the months covered. The list scrolls.

It opens on Maricopa and Pinal Counties with everything included. Narrow it with the County and City panels, the Transaction Type, Property Type, and 55+ Communities boxes, and the sale price and home size sliders.

Hover over a bar to see the exact figure for that city.

New Home Closings Year-to-Date By Builder

About this chart

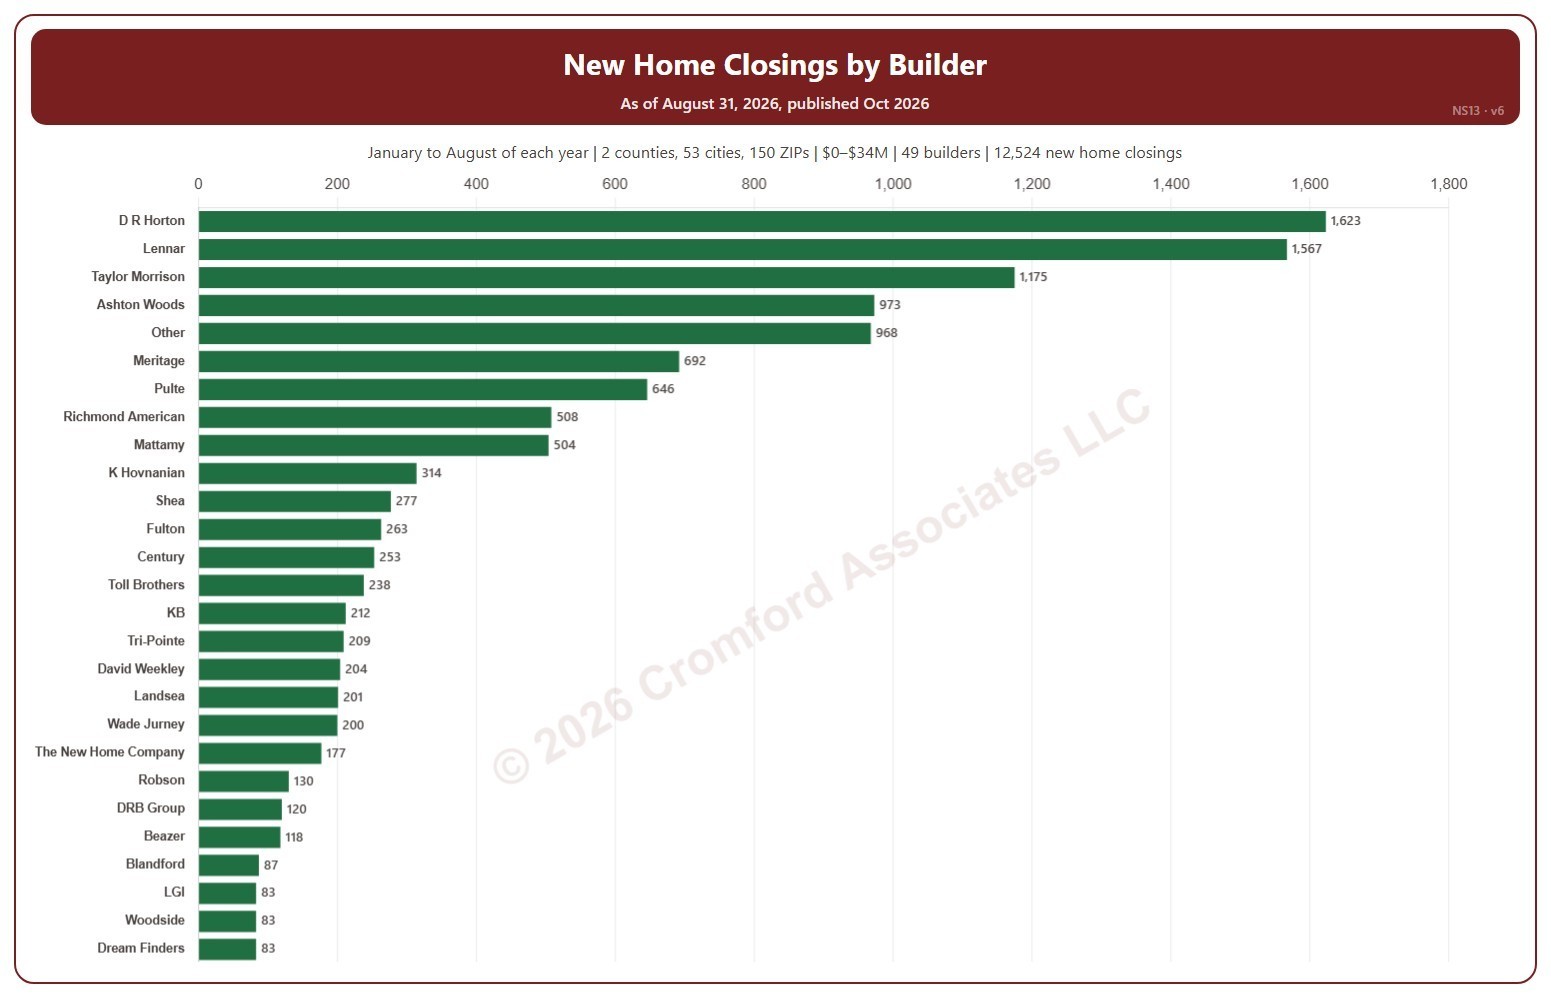
This chart ranks home builders by the number of new homes they closed in Maricopa and Pinal Counties. It is taken from recorded deeds, so it counts every builder closing, not just homes that were listed on ARMLS.

Each year is counted from January to the latest month available (shown at the top of the chart) so that years compare like for like. It opens on the current year; tick more years in the Year panel and their closings are added together. Data goes back to 2011.

Builders are named as the brand that sells today, so homes closed by a builder that was later acquired count under the buyer. “Other” collects the smaller builders and closings whose deed does not identify the builder.

Narrow the count with the County, City, ZIP, Builder, Property Type, 55+ Communities, and Sale Price controls. The list scrolls; Print and Download Image show every builder.

New Home Closings by Price Range

About this chart

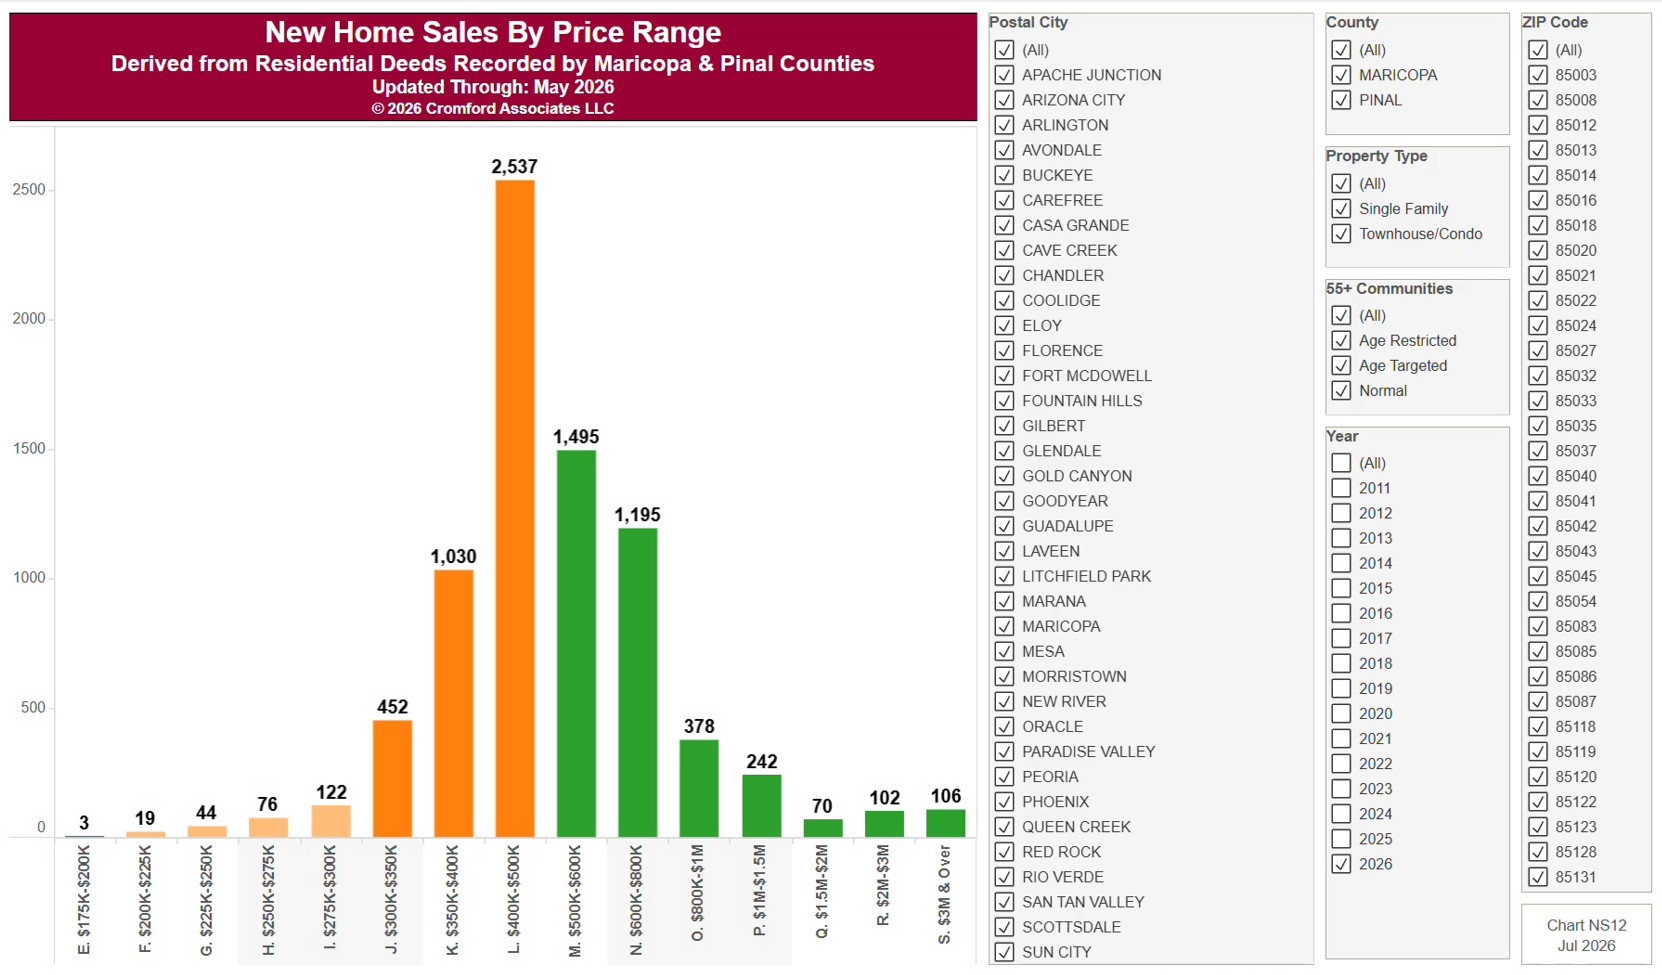
This chart counts new home closings in each price band, from below $100K up to $3M and over, from residential deeds recorded by Maricopa and Pinal Counties. It opens on the current year (January to the latest month recorded); tick more years in the Year panel to include them. To a builder a sale is the contract signature, months before the deed records, so we count closings.

It opens on Maricopa and Pinal Counties with everything included. Narrow it with the County, City, and ZIP panels and the Property Type and 55+ Communities boxes.

Hover over a bar to see the count for that price band.

Flip Sales – Median Measures by City

About this chart

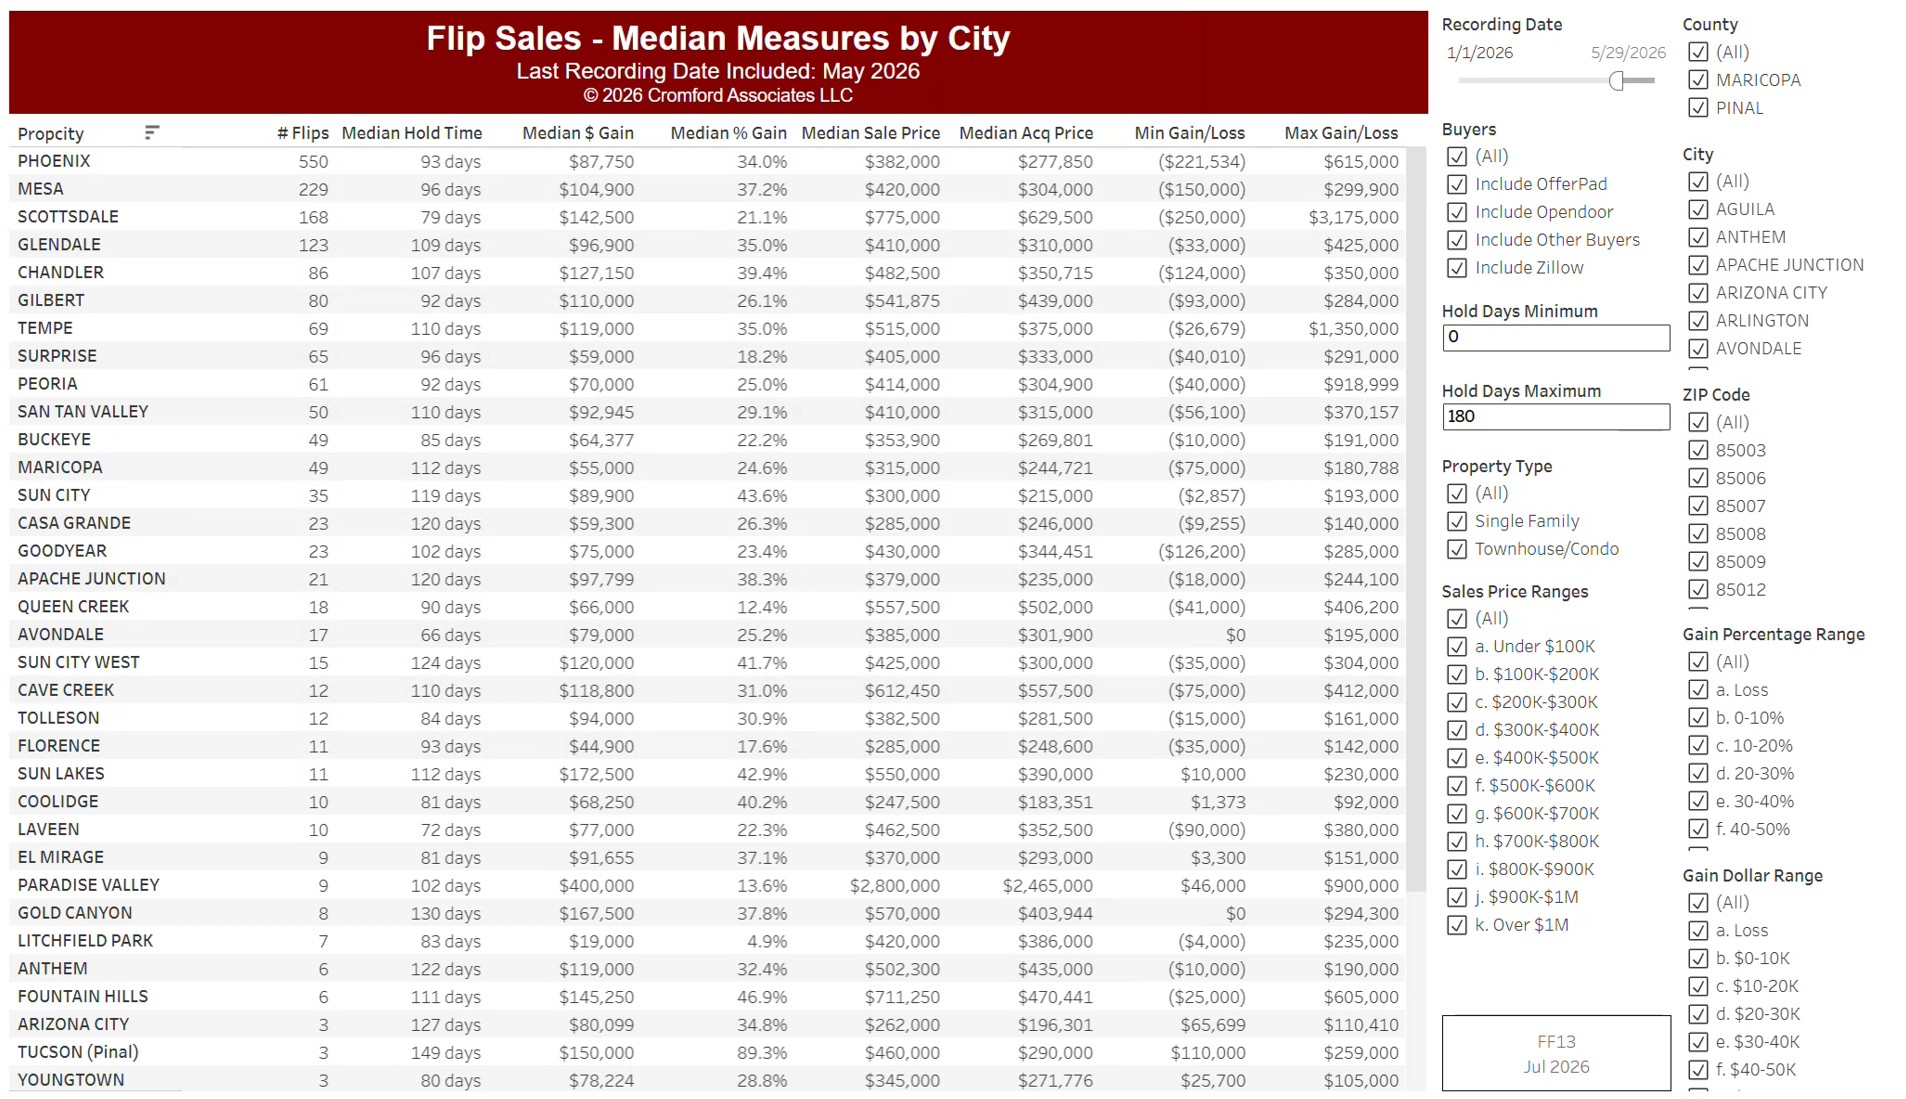
This table compares fix-and-flip sales by city, from residential deeds recorded by Maricopa and Pinal Counties: homes bought and resold by an investor. Each row is a city, with the number of flips, the median hold time in days, the median gross profit in dollars and as a percentage, the median sale and purchase prices, and the smallest and largest gross profit.

It opens on the months recorded so far this year; use the Recording Month slider to choose the period. It is sorted by the number of flips. Narrow it with the County, City, and ZIP panels, the Buyers and Property Type boxes, and the sale price, hold days, gross profit, and gross profit % sliders.

Gross profit is the difference between the purchase and resale prices, before renovation and selling costs.

Monthly Median Sales Price by ZIP Code

About this chart

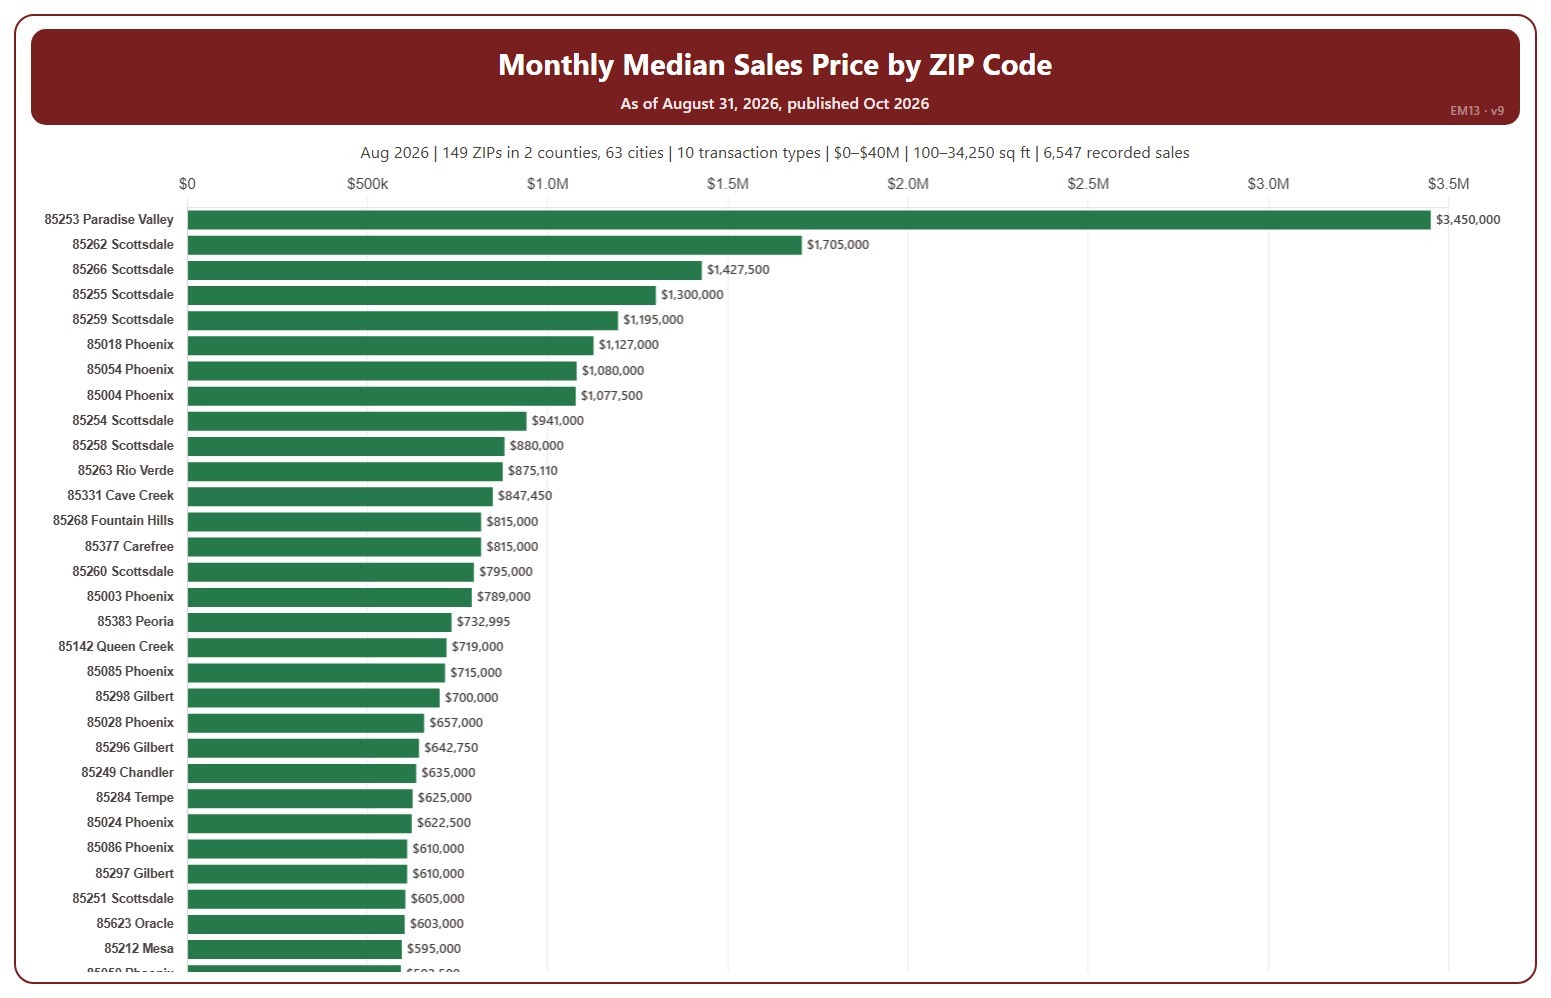
This chart ranks ZIP codes by the median sale price of the homes sold, from residential deeds recorded by Maricopa and Pinal Counties. The median is the price in the middle: half sold for more and half for less. Because it is built from recorded deeds, it covers every recorded sale, not just homes listed on ARMLS: new homes, private sales, and investor deals are all included.

It opens on the latest month recorded; use the Recording Month slider to widen it to more months. The list scrolls to show every ZIP code.

It opens on Maricopa and Pinal Counties with everything included. Narrow it with the County, City, and ZIP panels, the Transaction Type, Property Type, and 55+ Communities boxes, and the sale price and home size sliders.

Hover over a bar to see the exact figure for that ZIP code.