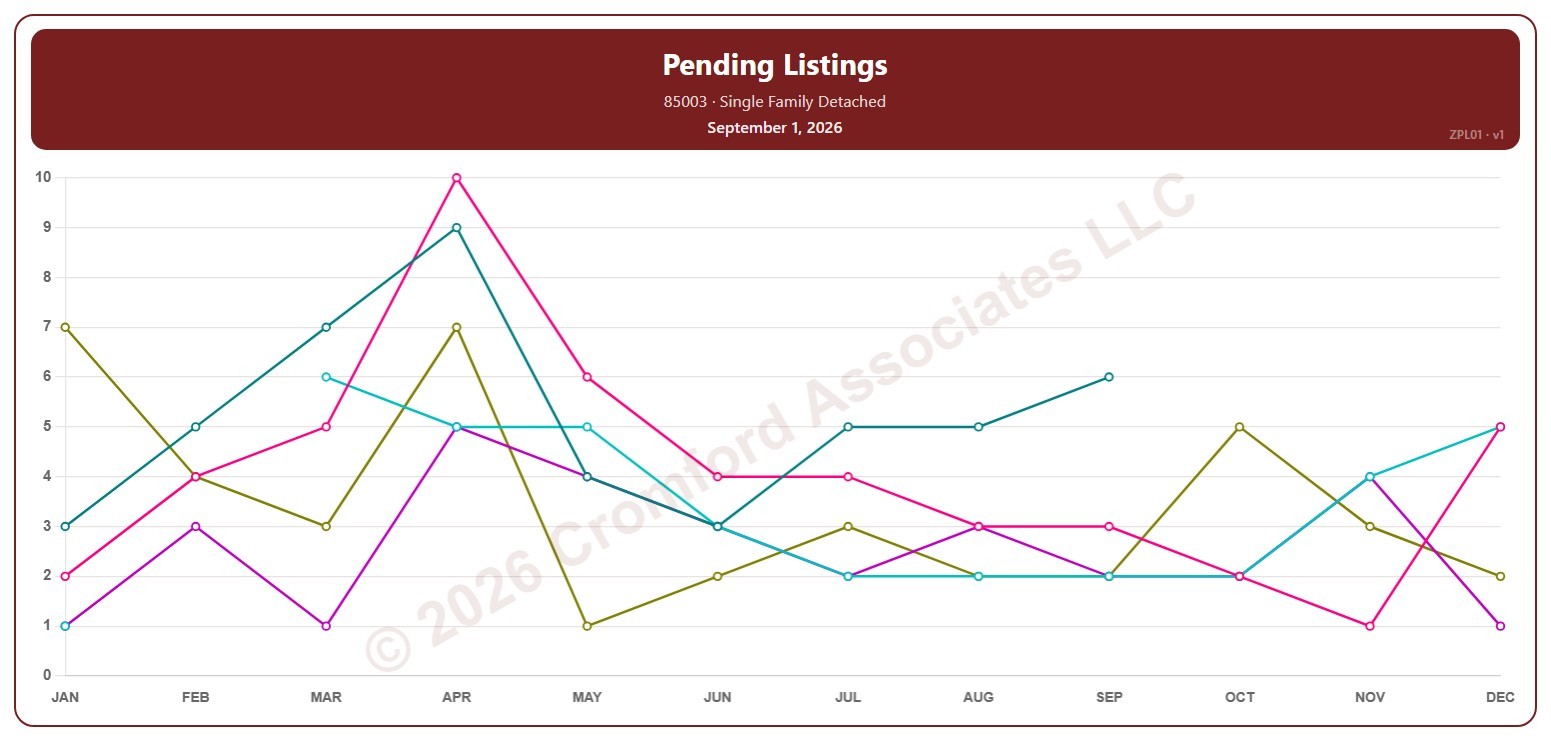
Pending Listings by ZIP Code – Monthly

About this chart

This chart counts the Pending listings for single-family detached homes on ARMLS in one ZIP code: homes under contract that have not yet closed. Each point is the reading on the 1st of the month.

Each year has its own line, laid out by month, so you can compare this year with earlier years at the same point in the season. Pick any of 149 ZIP codes from the ZIP Code list (it opens on 85003); the last three years are ticked to start with, and you can tick any year back to 2005.

Hover over a line to see the exact figure for that month.
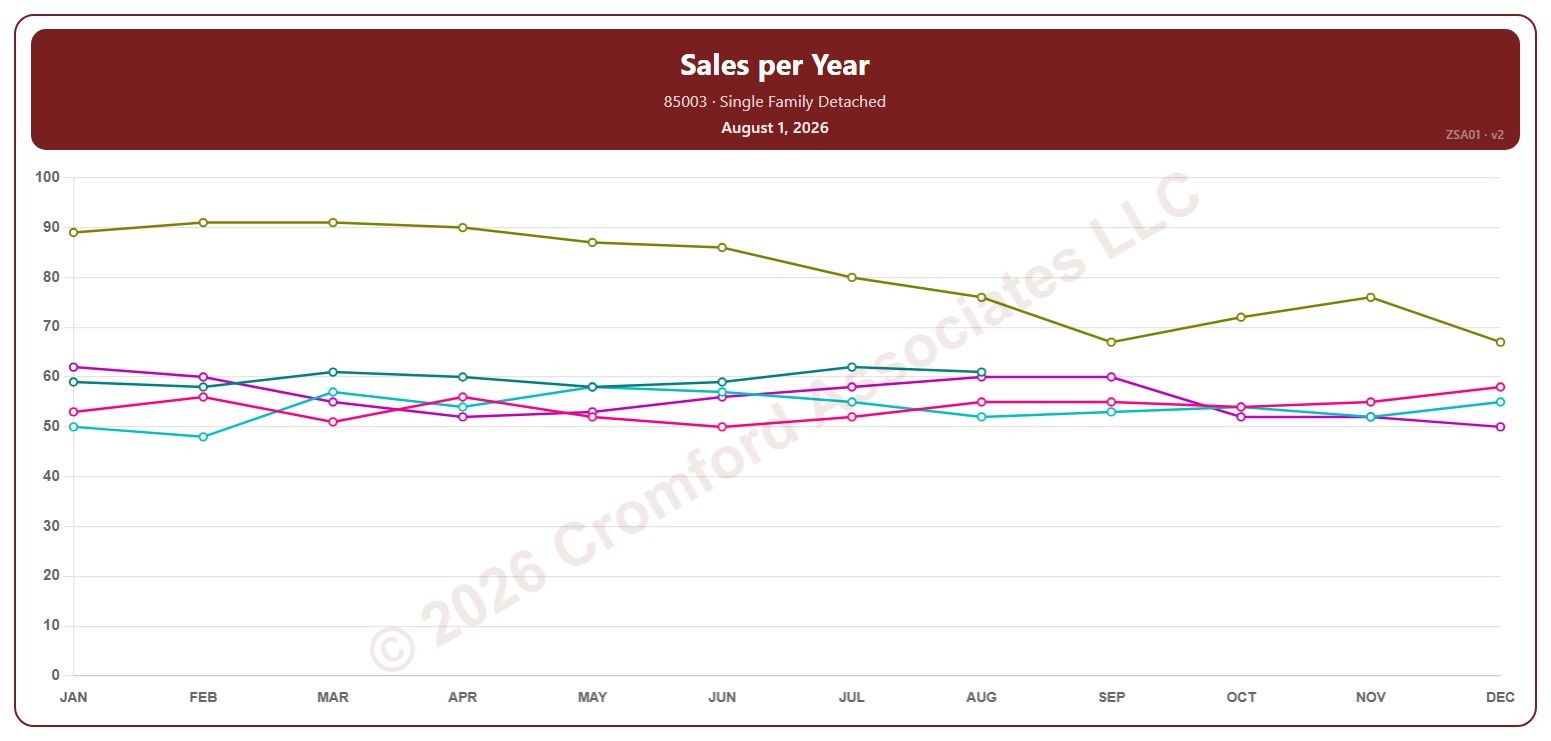
Sales per Year by ZIP Code – Monthly

About this chart

This chart counts the single-family detached homes that closed through ARMLS in one ZIP code over 12 months. Each point covers the 12 months ending with the month it sits at, so the point at August covers September 1 of the year before to August 31; the newest point is the last month that has finished.

Each year has its own line, laid out by month, so you can compare this year with earlier years at the same point in the season. Pick any of 149 ZIP codes from the ZIP Code list (it opens on 85003); the last three years are ticked to start with, and you can tick any year back to 2001.

Hover over a line to see the exact figure for that month.
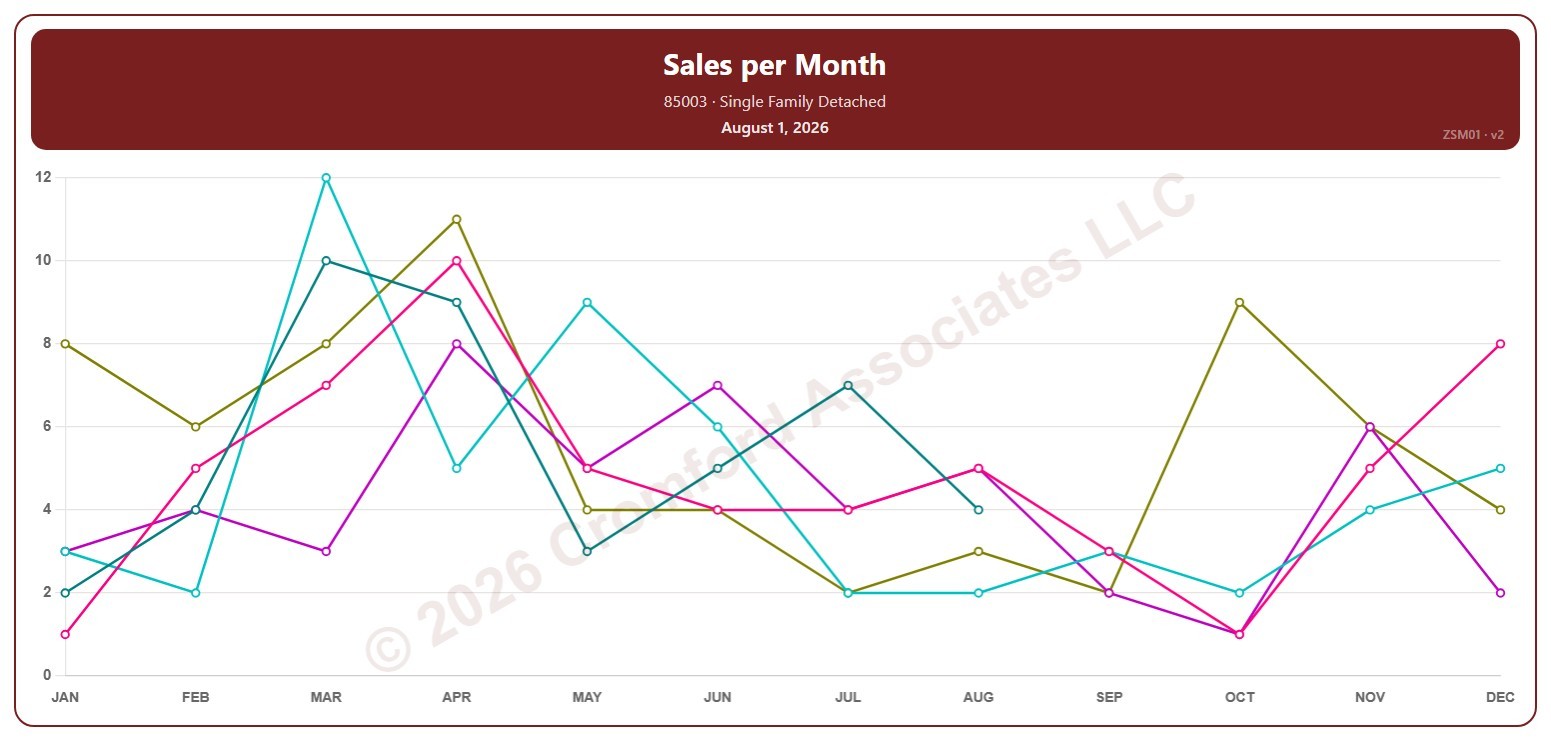
Sales per Month by ZIP Code – Monthly

About this chart

This chart counts the single-family detached homes that closed through ARMLS in one ZIP code each month. Each point covers the closings in that calendar month, so the point at August covers August 1 to 31; the newest point is the last month that has finished.

Each year has its own line, laid out by month, so you can compare this year with earlier years at the same point in the season. Pick any of 149 ZIP codes from the ZIP Code list (it opens on 85003); the last three years are ticked to start with, and you can tick any year back to 2001.

Hover over a line to see the exact figure for that month.
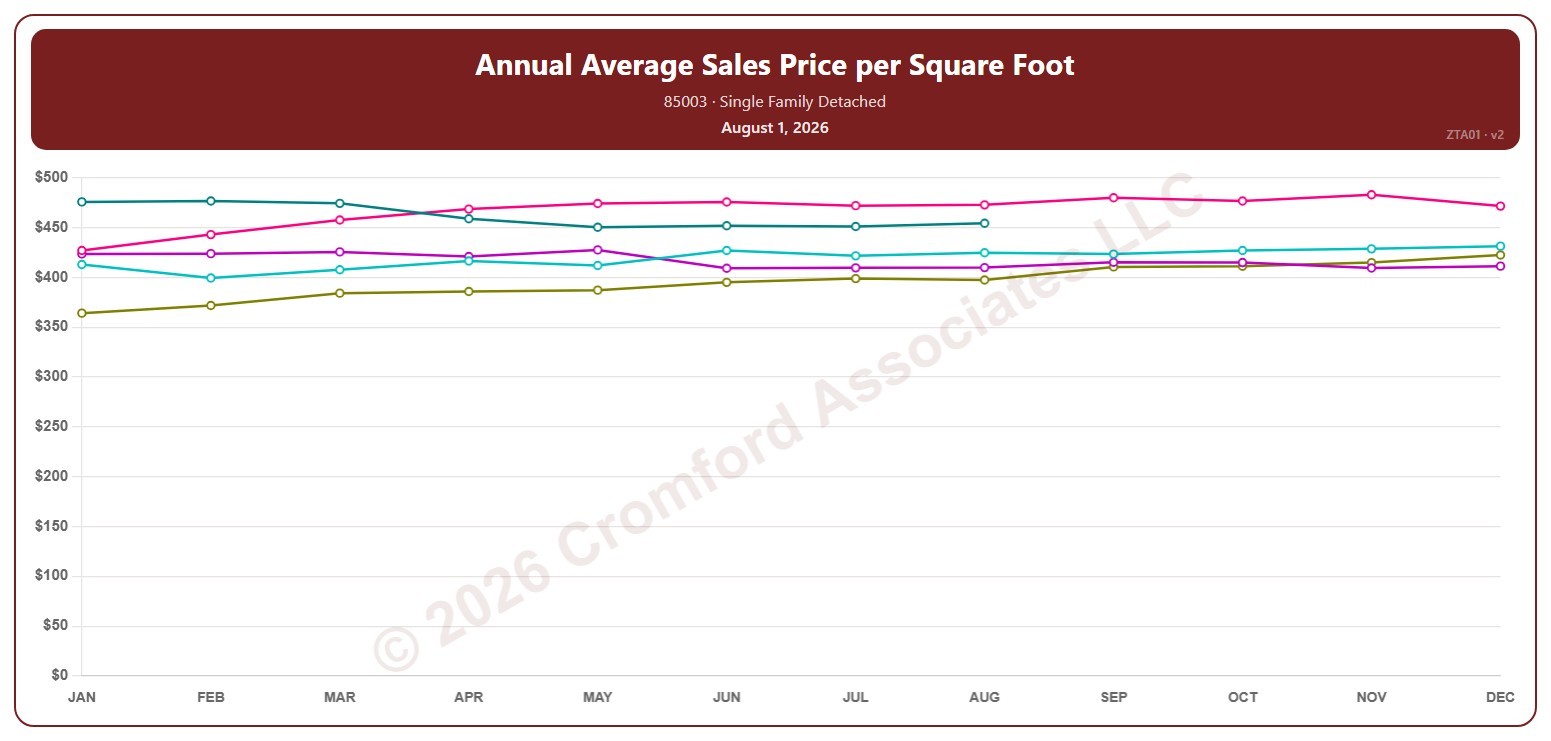
Annual Average Sales Price per Square Foot by ZIP Code – Monthly

About this chart

This chart shows the average sales price per square foot of single-family detached homes that closed through ARMLS in one ZIP code over 12 months. Each point covers the 12 months ending with the month it sits at, so the point at August covers September 1 of the year before to August 31; the newest point is the last month that has finished. Price per square foot lets you compare homes of different sizes.

Each year has its own line, laid out by month, so you can compare this year with earlier years at the same point in the season. Pick any of 149 ZIP codes from the ZIP Code list (it opens on 85003); the last three years are ticked to start with, and you can tick any year back to 2001.

Hover over a line to see the exact figure for that month.
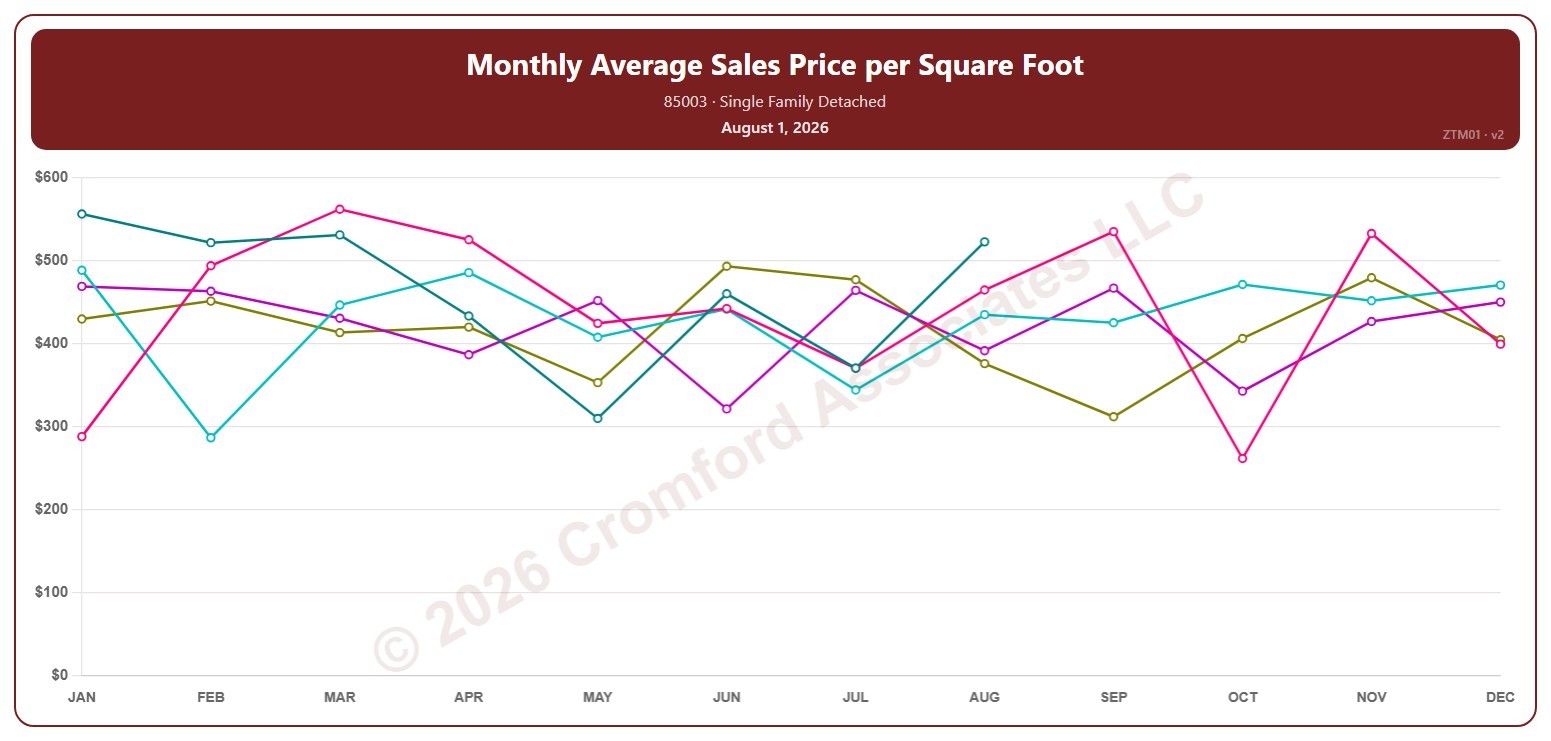
Monthly Average Sales Price per Square Foot by ZIP Code – Monthly

About this chart

This chart shows the average sales price per square foot of single-family detached homes that closed through ARMLS in one ZIP code, month by month. Each point covers the closings in that calendar month, so the point at August covers August 1 to 31; the newest point is the last month that has finished. Price per square foot lets you compare homes of different sizes.

Each year has its own line, laid out by month, so you can compare this year with earlier years at the same point in the season. Pick any of 149 ZIP codes from the ZIP Code list (it opens on 85003); the last three years are ticked to start with, and you can tick any year back to 2001.

Hover over a line to see the exact figure for that month.
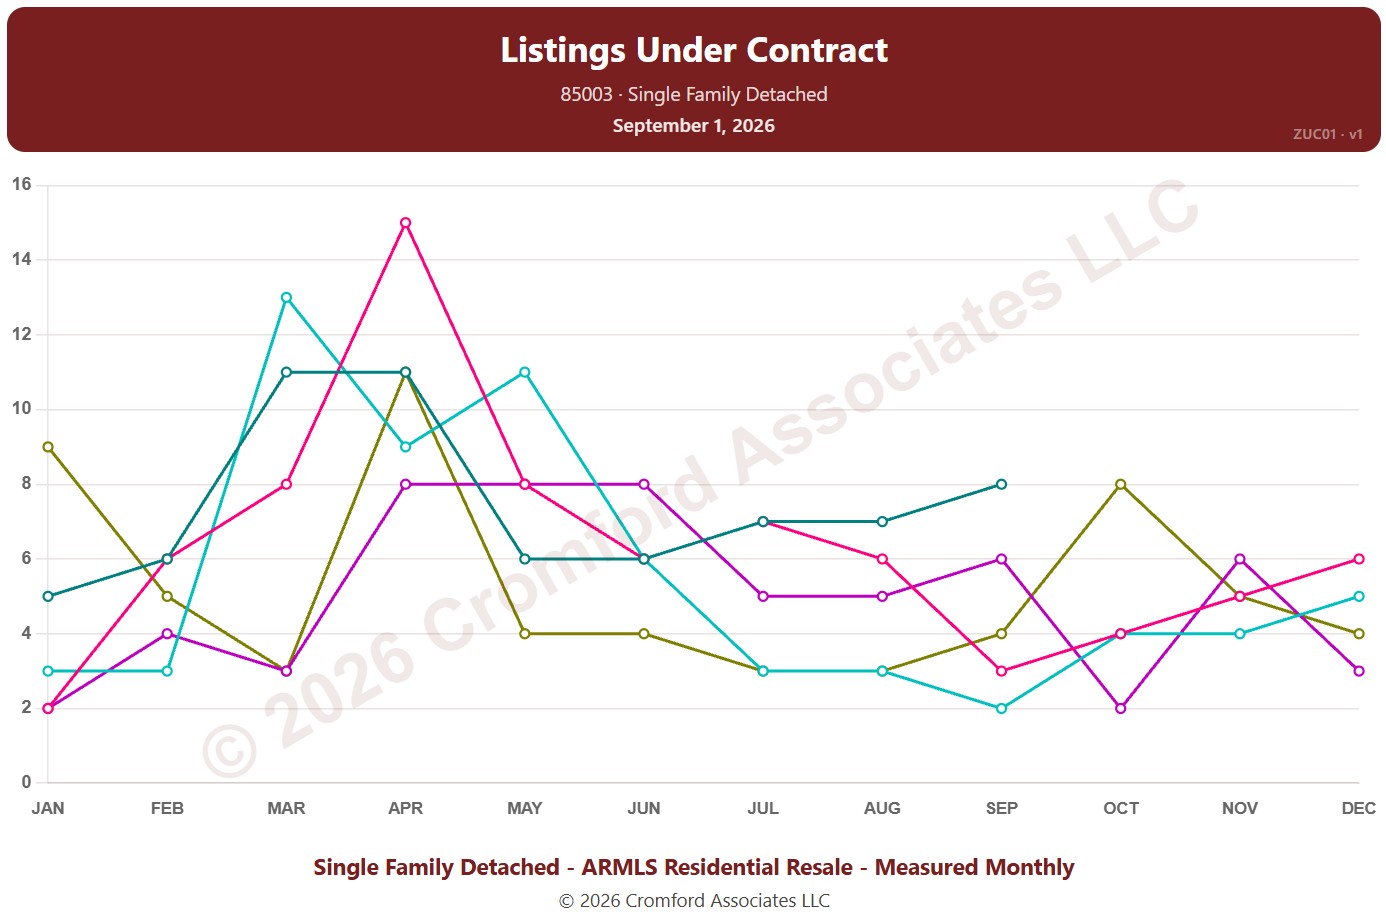
Listings Under Contract by ZIP Code – Monthly

About this chart

This chart counts the listings under contract for single-family detached homes on ARMLS in one ZIP code: Pending listings plus UCB / CCBS listings. Each point is the reading on the 1st of the month. It shows how much buying activity is under way.

Each year has its own line, laid out by month, so you can compare this year with earlier years at the same point in the season. Pick any of 149 ZIP codes from the ZIP Code list (it opens on 85003); the last three years are ticked to start with, and you can tick any year back to 2011.

Hover over a line to see the exact figure for that month.
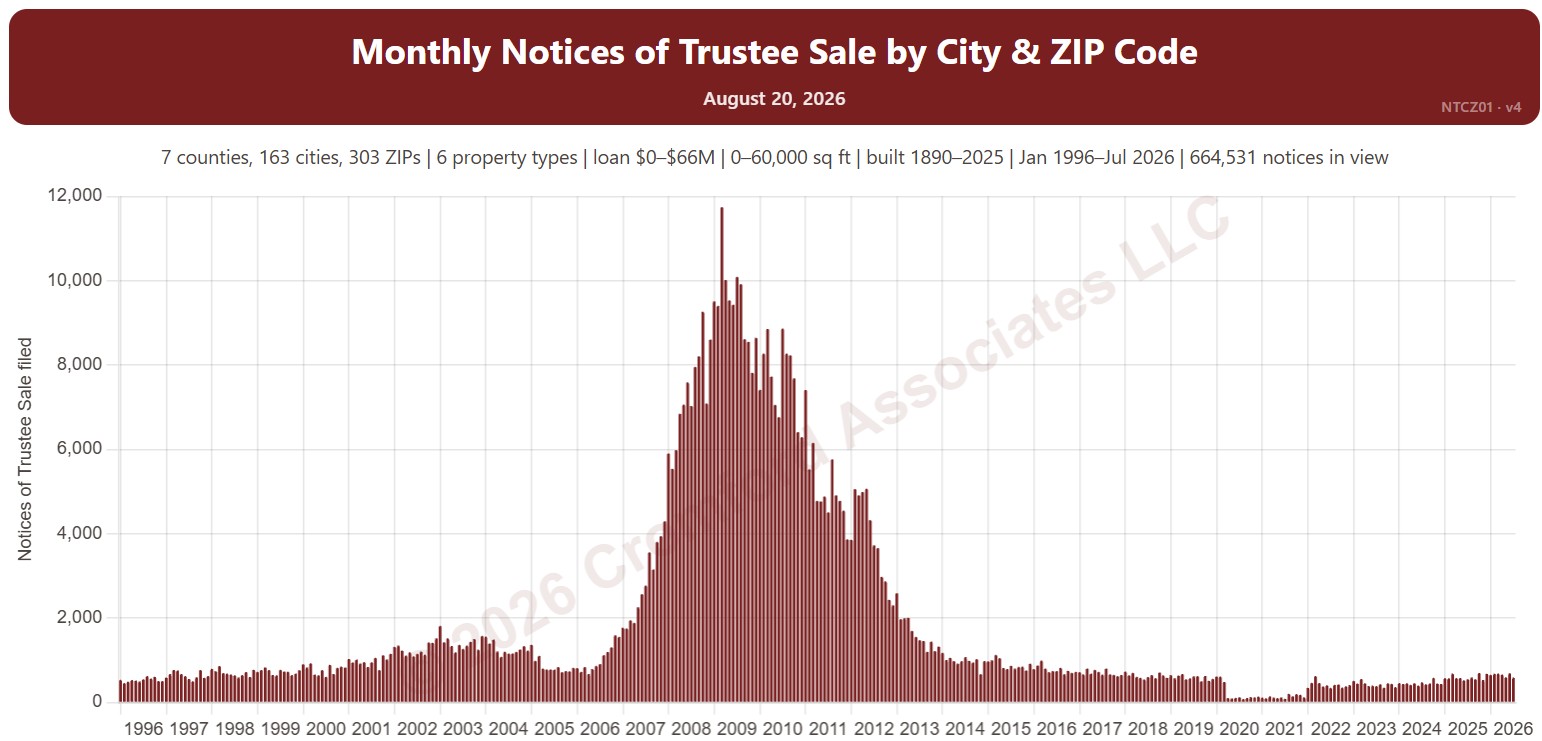
Monthly Notices of Trustee Sale – City Comparison

About this chart

This chart compares Notices of Trustee Sale between cities, one line per city, recorded each month. A notice is the document a lender records when it starts to foreclose on a home; many are later canceled, so it is an early sign of distress rather than a count of foreclosures. The lines show a 12-month average to smooth out month-to-month swings.

It opens on Phoenix, Mesa, Glendale, Scottsdale, Chandler, and Gilbert in Maricopa and Pinal Counties. Tick other cities under Cities to Compare, or add Cochise, Coconino, Mohave, Santa Cruz, or Yavapai Counties. Vacant land and commercial property are left out by default.

Narrow it with the Property Type box and the loan amount, home size, and year built sliders. Use the date slider, or Full range, to choose the stretch of history shown.

Hover over a line to see the figure for that month.

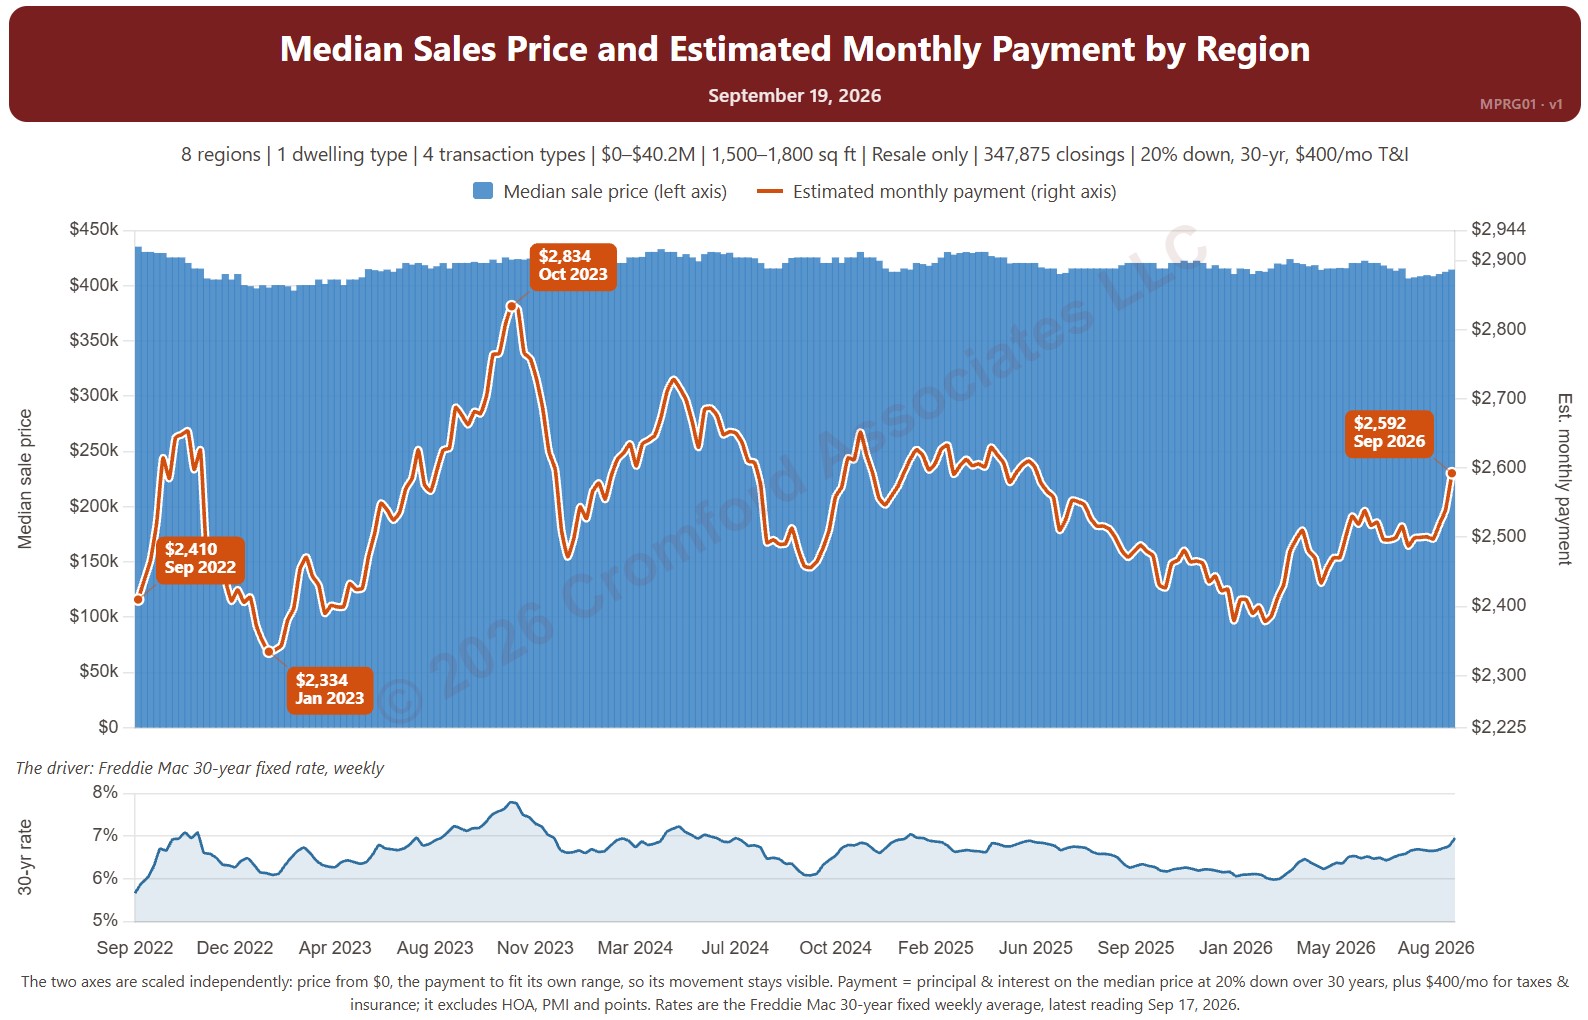
Median Sales Price and Estimated Monthly Payment by Region

About this chart

This chart sets the median sales price beside the estimated monthly payment needed to buy a home at that price, measured every week, with the 30-year fixed mortgage rate (Freddie Mac Primary Mortgage Market Survey®) in the panel below. It shows how affordability changes as both prices and rates move.

The default view is single-family resale homes of every size over the last four years. The payment assumes 20% down, a 30-year loan, and taxes and insurance of 1.2% of the sales price a year. The Payment panel changes the assumptions, and Reset assumptions puts them back.

It opens with every region included. Use the Region panel to focus on one region or compare a combination of them. Narrow it with the Dwelling Type, Transaction Type, and New / Resale boxes and the sales price and home size sliders. The 1 yr, 3 yr, 5 yr, 10 yr, and Full range buttons set the stretch of history shown.

Hover over the chart to see the figures for that week.

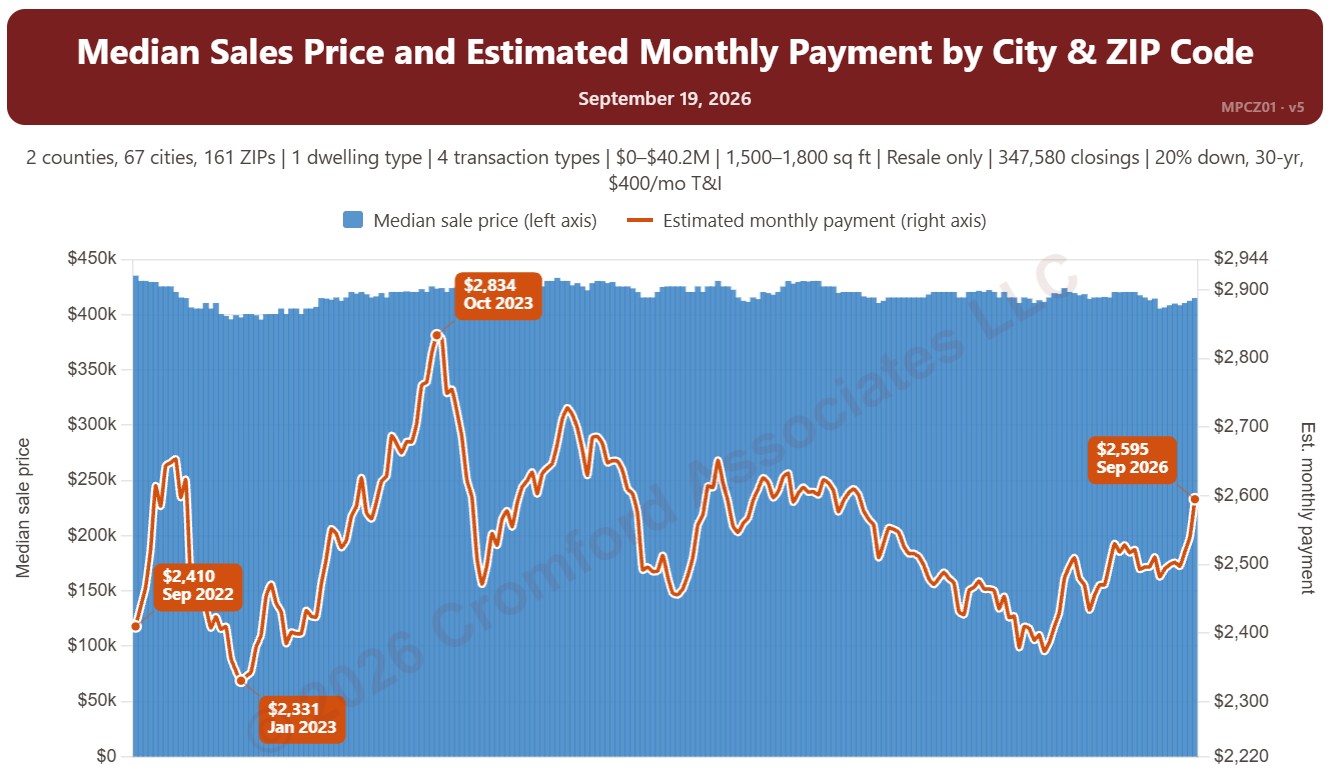
Median Sales Price and Estimated Monthly Payment by City and ZIP Code

About this chart

This chart sets the median sales price beside the estimated monthly payment needed to buy a home at that price, measured every week, with the 30-year fixed mortgage rate (Freddie Mac Primary Mortgage Market Survey®) in the panel below. It shows how affordability changes as both prices and rates move.

The default view is single-family resale homes of every size over the last four years. The payment assumes 20% down, a 30-year loan, and taxes and insurance of 1.2% of the sales price a year. The Payment panel changes the assumptions, and Reset assumptions puts them back.

It opens on Maricopa and Pinal Counties with every city and ZIP code included. Use the County, City, and ZIP panels to focus on any area, from a whole county down to a single ZIP code. Narrow it with the Dwelling Type, Transaction Type, and New / Resale boxes and the sales price and home size sliders. The 1 yr, 3 yr, 5 yr, 10 yr, and Full range buttons set the stretch of history shown.

Hover over the chart to see the figures for that week.

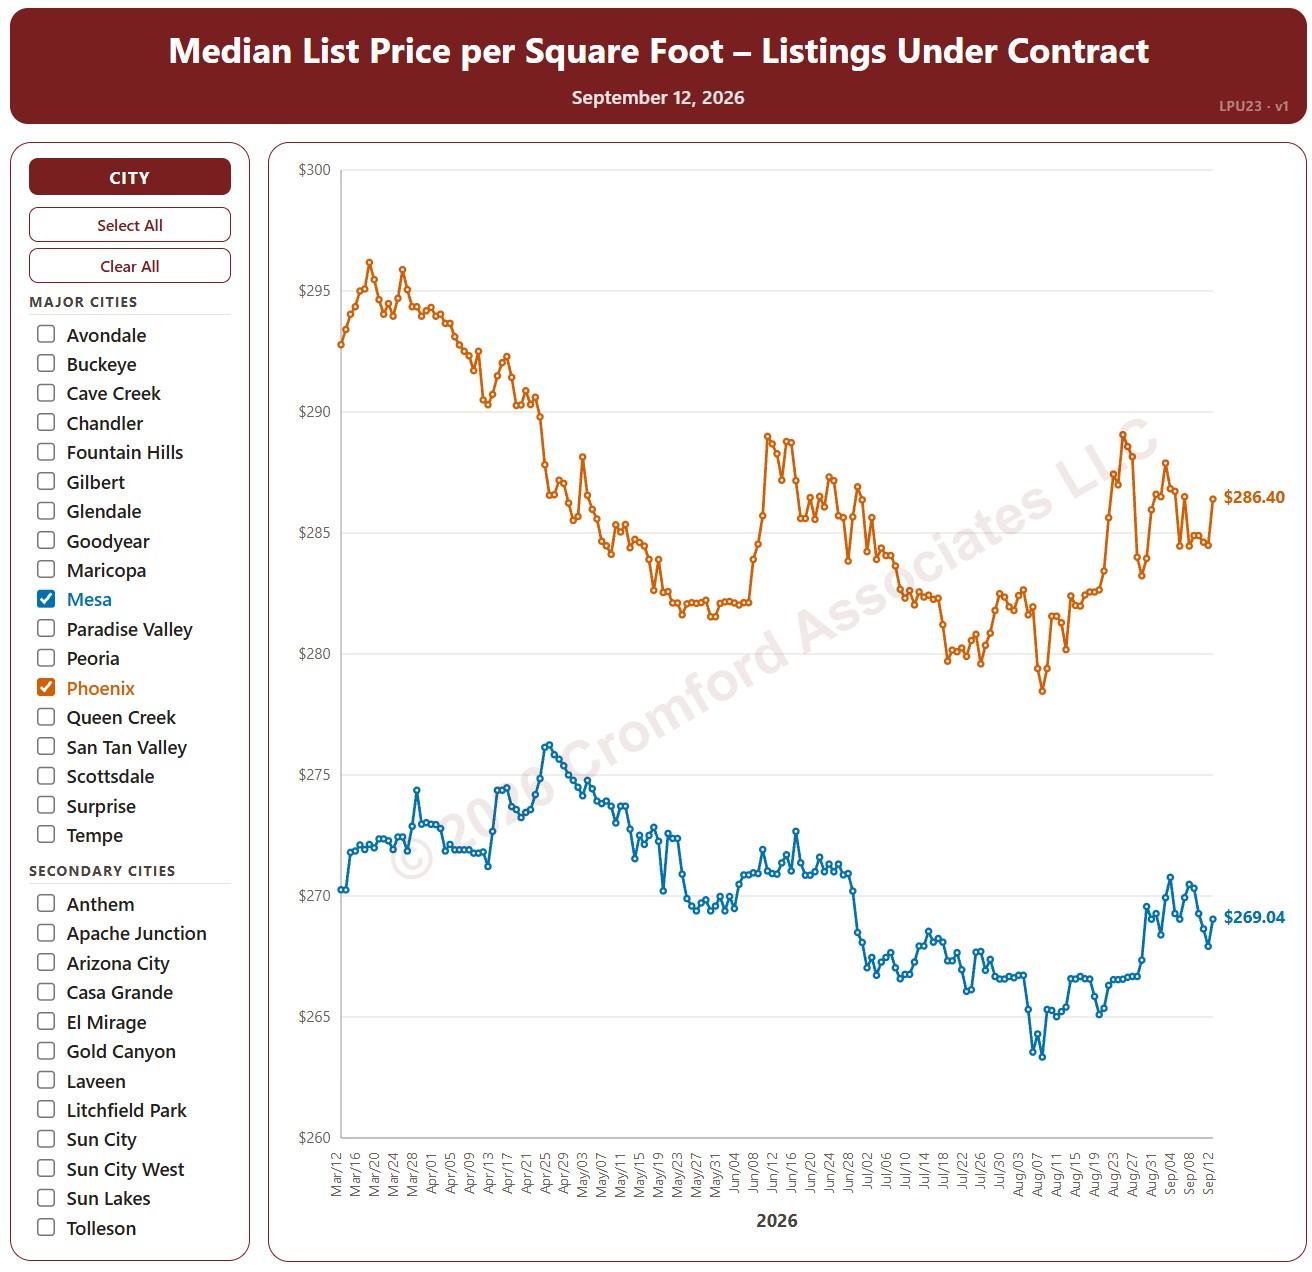
Median List Price per Square Foot by City – Listings Under Contract

About this chart

This chart compares the median list price per square foot of listings under contract (Pending plus UCB / CCBS) across 34 cities in and around Greater Phoenix, every day over the last six months, for single-family detached homes on ARMLS. It shows the asking prices of the homes buyers have agreed to buy.

The 18 major cities are drawn as solid lines and the 16 secondary cities as dashed lines. It opens on Mesa and Phoenix; use the city check boxes, or Select All and Clear All, to choose which cities are shown.

Hover over a line to see the exact figure for that day.