About this chart
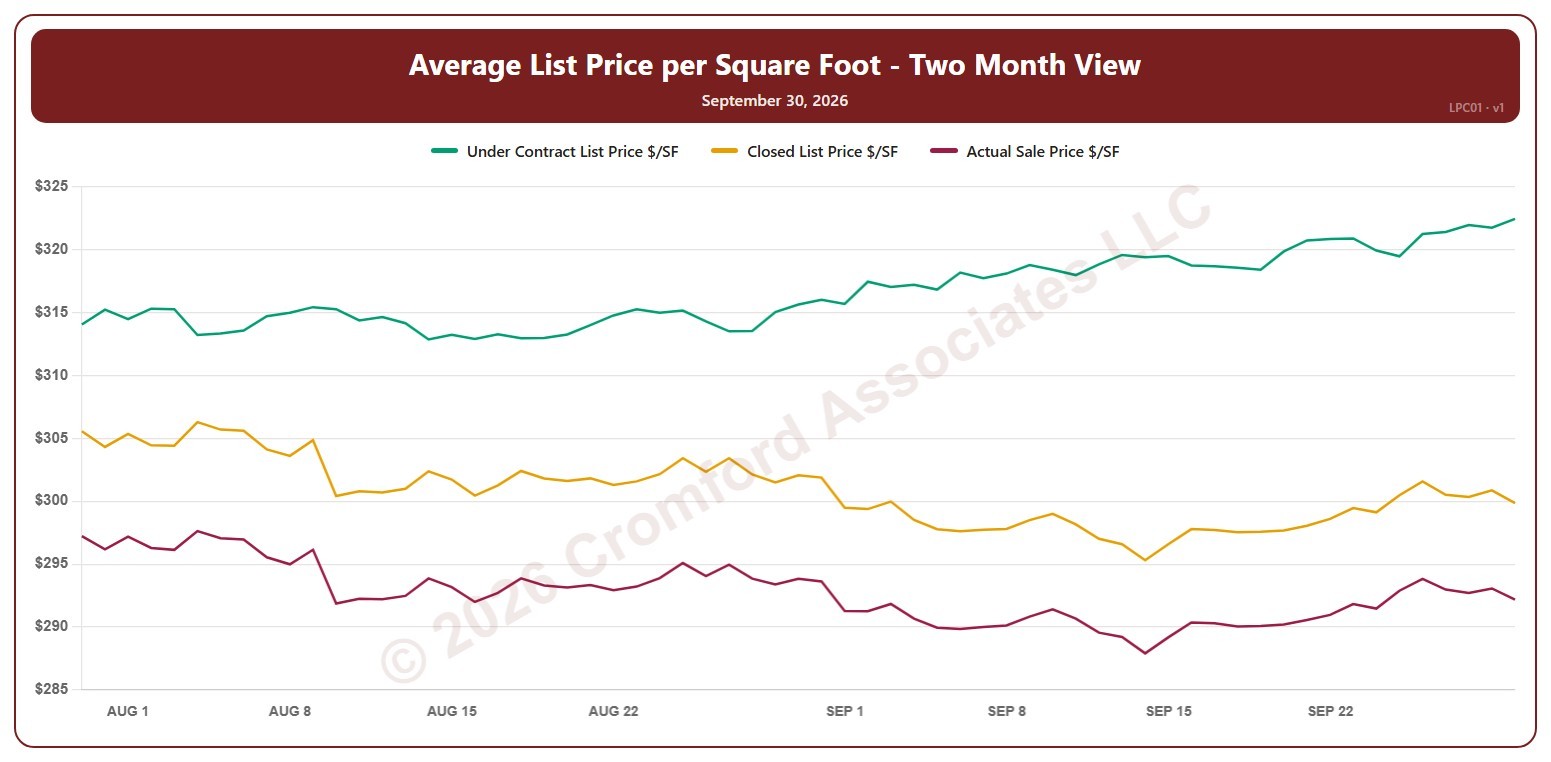
This chart shows three average prices per square foot for the whole ARMLS market, all areas and all dwelling types, every day over the last two months: the list price of listings under contract, the final list price of the homes that closed in the month up to that day, and the price those homes actually sold for. The gap between the lines shows how far buyers are paying above or below the asking price.
Click the buttons above the chart to show or hide each line. Hover over the chart to see each figure for that day.