Average Home Size – Monthly Sales – Weekly

About this chart

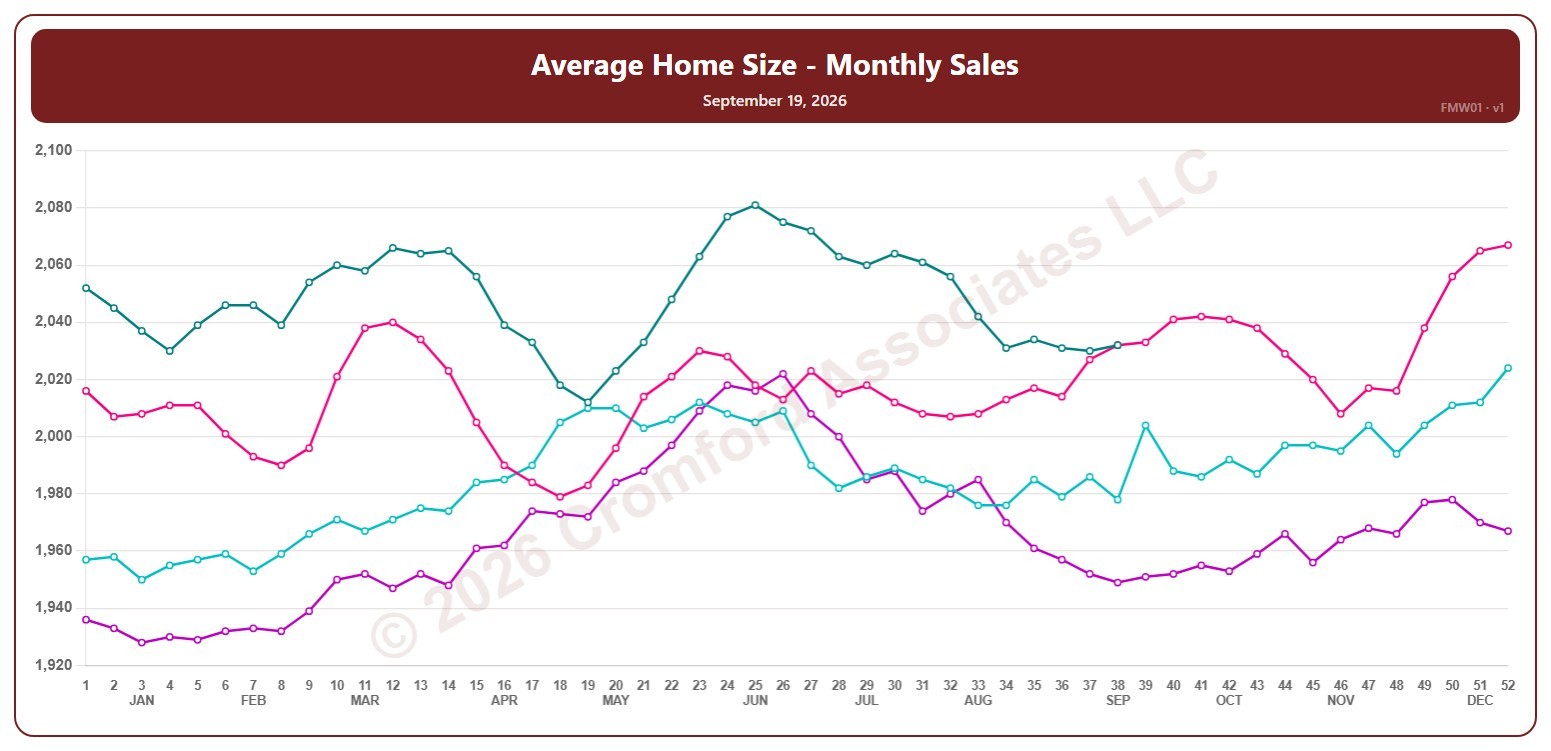
This chart shows the average size, in square feet, of the homes that closed in a month, for the whole ARMLS market, all areas and all dwelling types, measured every week. Each point covers the closings in the month up to that Saturday.

Each year has its own line, laid out by week of the year (each Saturday), so you can compare this year with earlier years at the same point in the season. It opens on the last four years; tick any year back to 2001 in the Year panel.

Hover over a line to see the exact figure for that week.
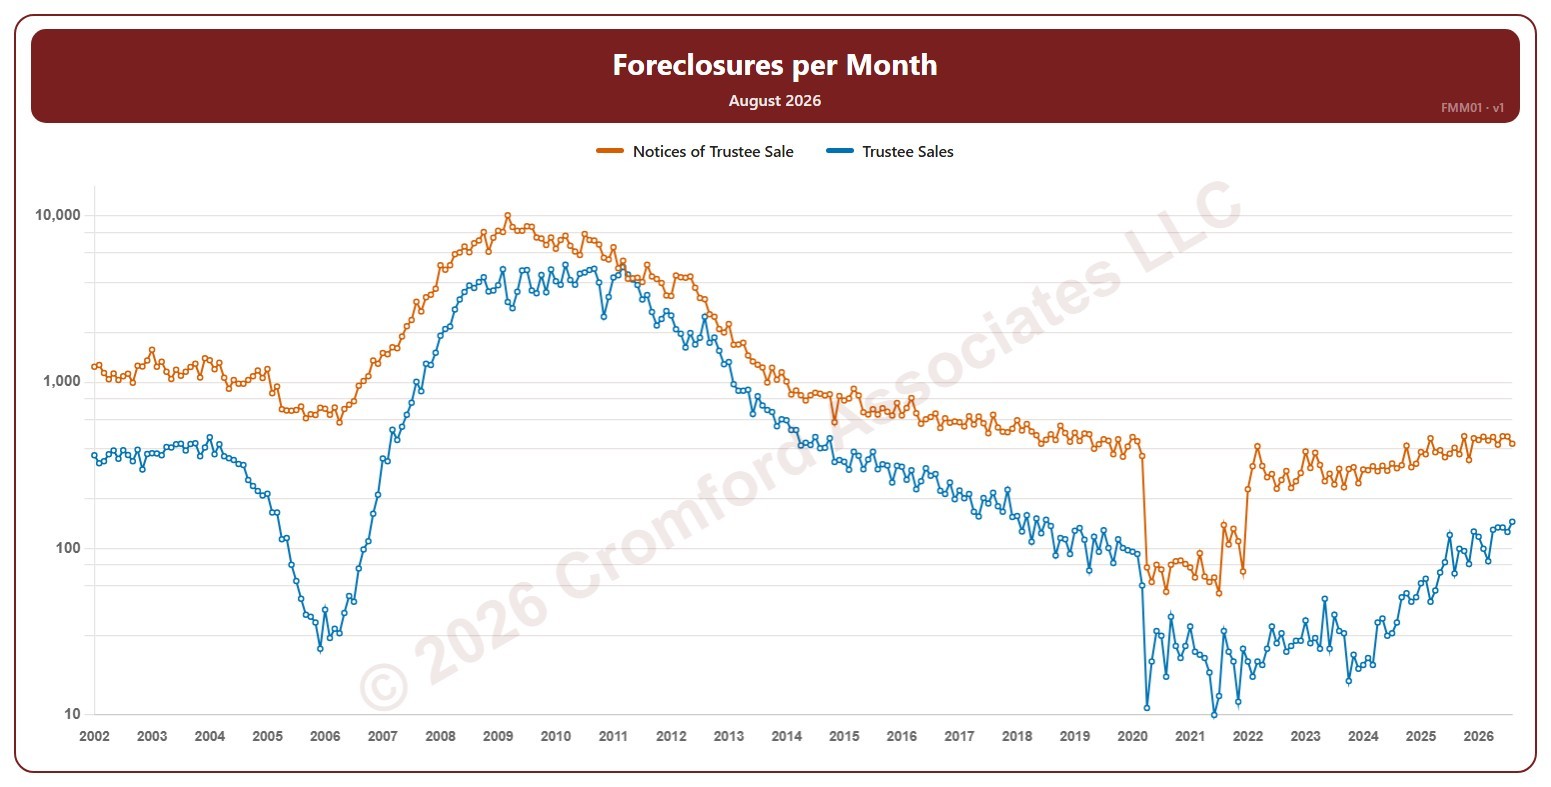
Foreclosures per Month – Monthly

About this chart

This chart shows foreclosure activity on residential properties in Maricopa County, recorded each month since January 2002, as two lines: Notices of Trustee Sale (a lender starting to foreclose) and Trustee Sales (the foreclosure auctions that went ahead). Many notices are later canceled, which is why the notices line runs well above the sales line. The value axis is logarithmic, so equal steps up the axis are equal percentage changes; this keeps both the extreme years and today readable.

Use the Notices of Trustee Sale and Trustee Sales buttons to show or hide each line. Hover over the chart to see the figures for that month.

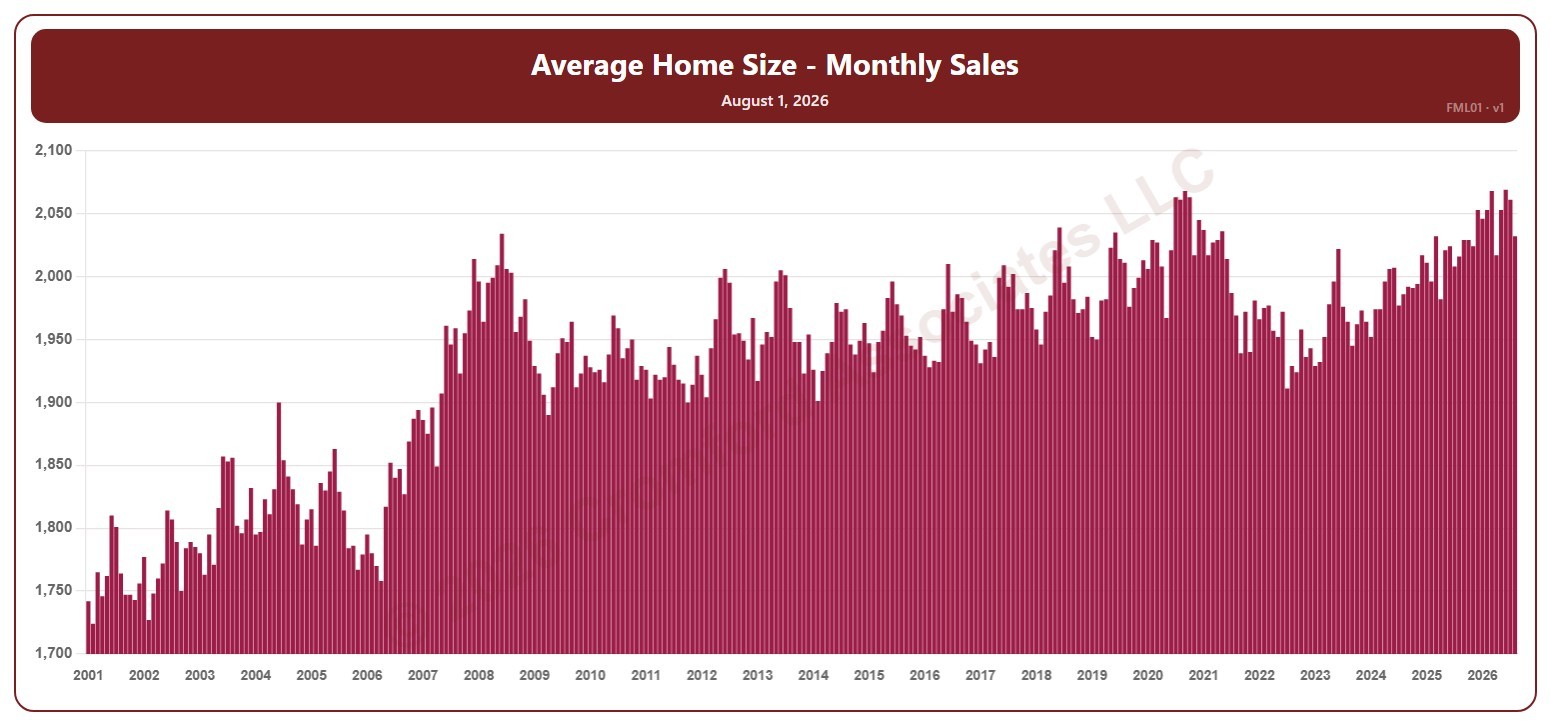
Average Home Size – Monthly Sales – Long Term

About this chart

This chart shows the average size, in square feet, of the homes that closed in a month, for the whole ARMLS market, all areas and all dwelling types, as one bar per month since January 2001. Each bar covers the closings in that calendar month.

Hover over a bar to see the exact figure for that month.

Listing Success Rate – Weekly

About this chart

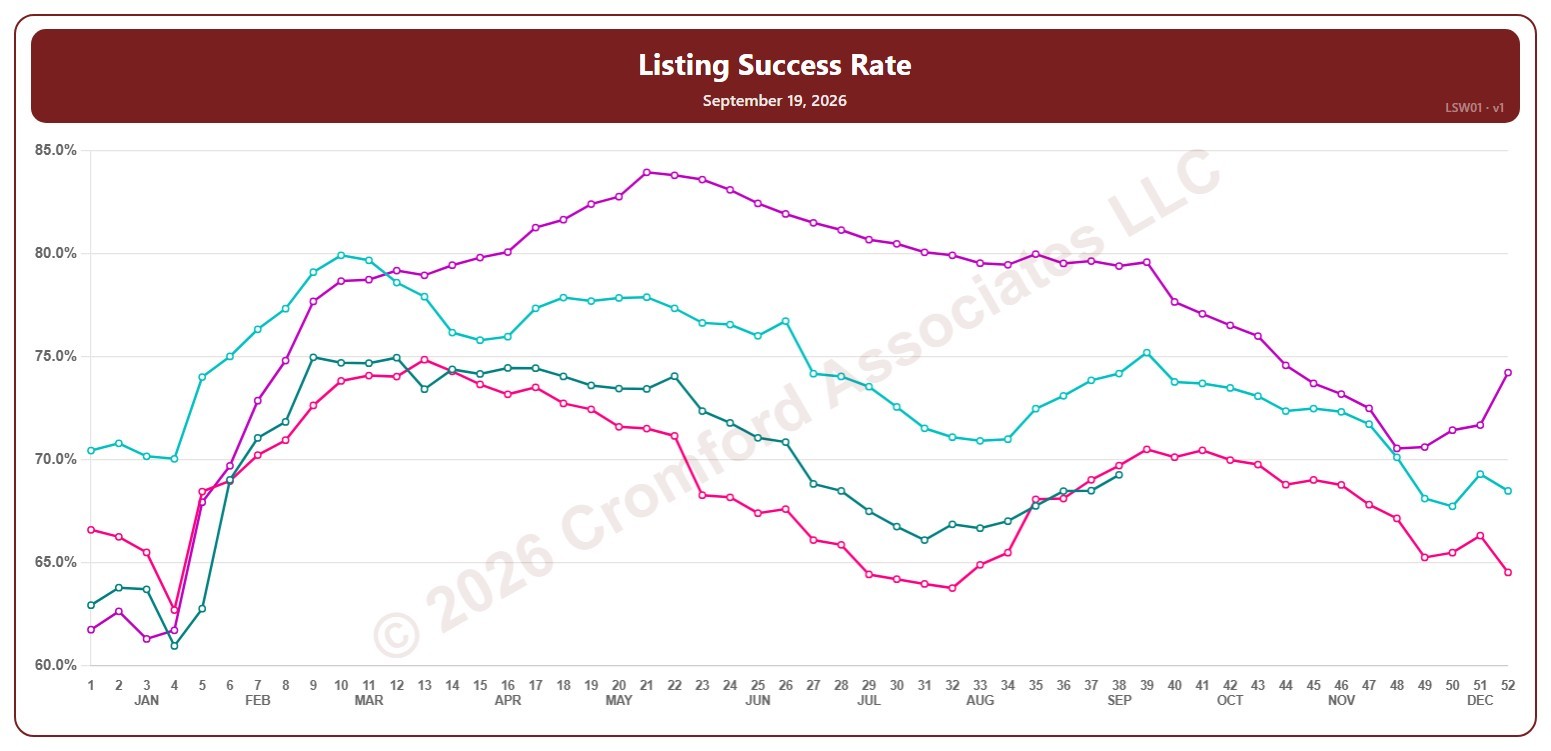
This chart shows the listing success rate: the share of listings that ended in a sale rather than being canceled or expiring, over a month, for the whole ARMLS market, all areas and all dwelling types, measured every week. Each point covers the listings that ended (sold, canceled, or expired) in the month up to that Saturday. A higher rate means more listings are ending in a sale.

Each year has its own line, laid out by week of the year (each Saturday), so you can compare this year with earlier years at the same point in the season. It opens on the last four years; tick any year back to 2002 in the Year panel.

Hover over a line to see the exact figure for that week.

Average Sales Price – Monthly – Long Term

About this chart

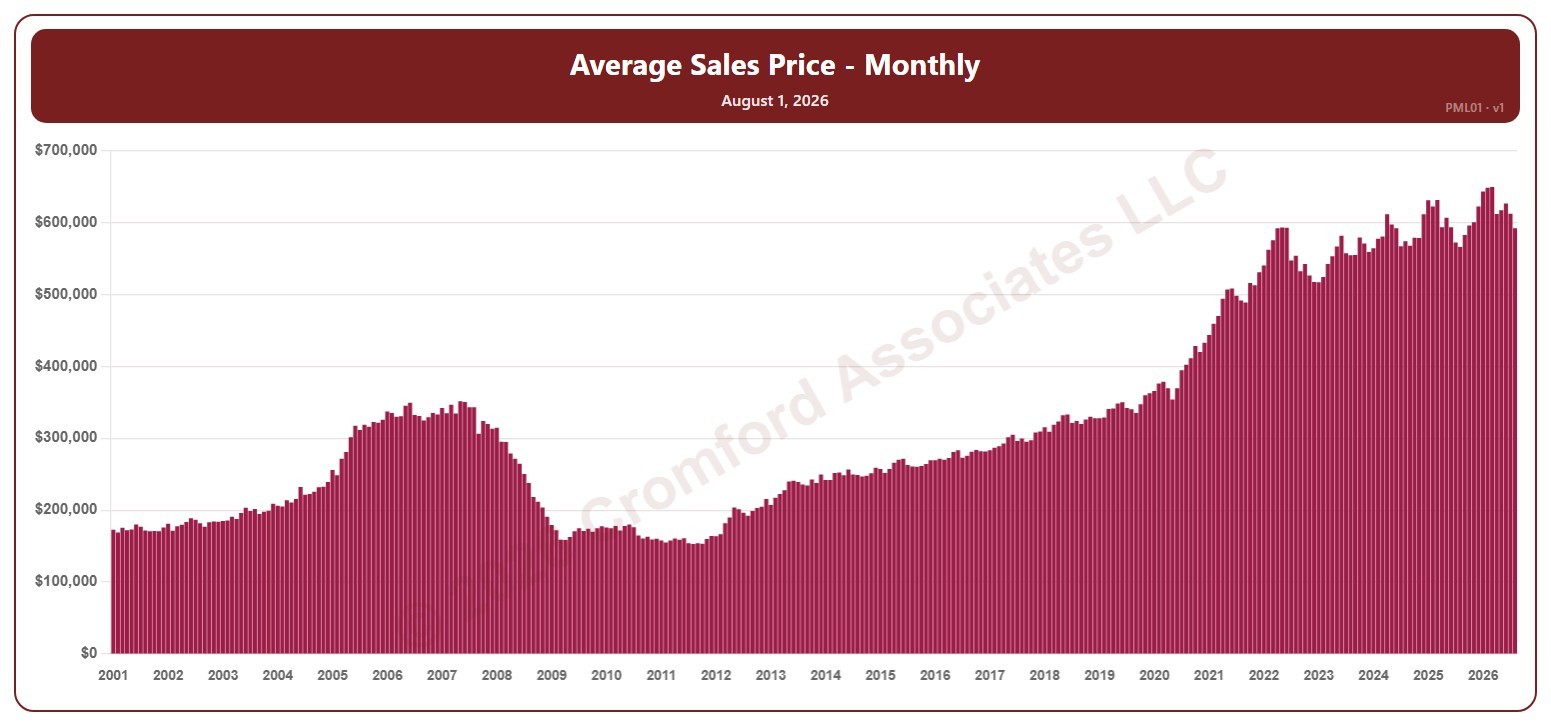
This chart shows the average sales price of the homes that closed in a month, for the whole ARMLS market, all areas and all dwelling types, as one bar per month since January 2001. Each bar covers the closings in that calendar month. Sales of large, expensive homes pull the average up more than the median.

Hover over a bar to see the exact figure for that month.

Average Sales Price – Monthly – Measured Monthly

About this chart

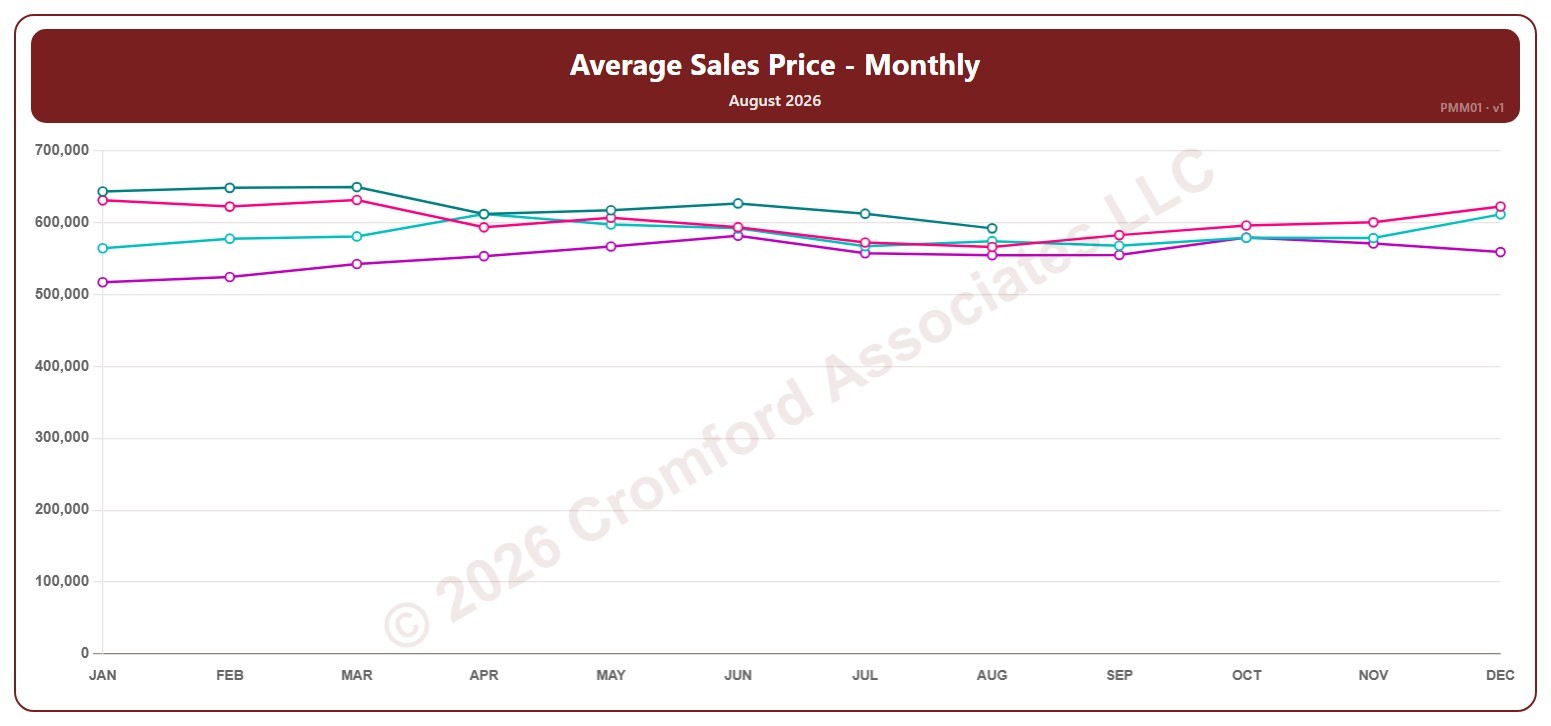
This chart shows the average sales price of the homes that closed in a month, for the whole ARMLS market, all areas and all dwelling types, measured monthly. Each point covers the closings in that calendar month. Sales of large, expensive homes pull the average up more than the median.

Each year has its own line, laid out by month, so you can compare this year with earlier years at the same point in the season. It opens on the last four years; tick any year back to 2001 in the Year panel.

Hover over a line to see the exact figure for that month.

Average Sales Price – Monthly – Weekly

About this chart

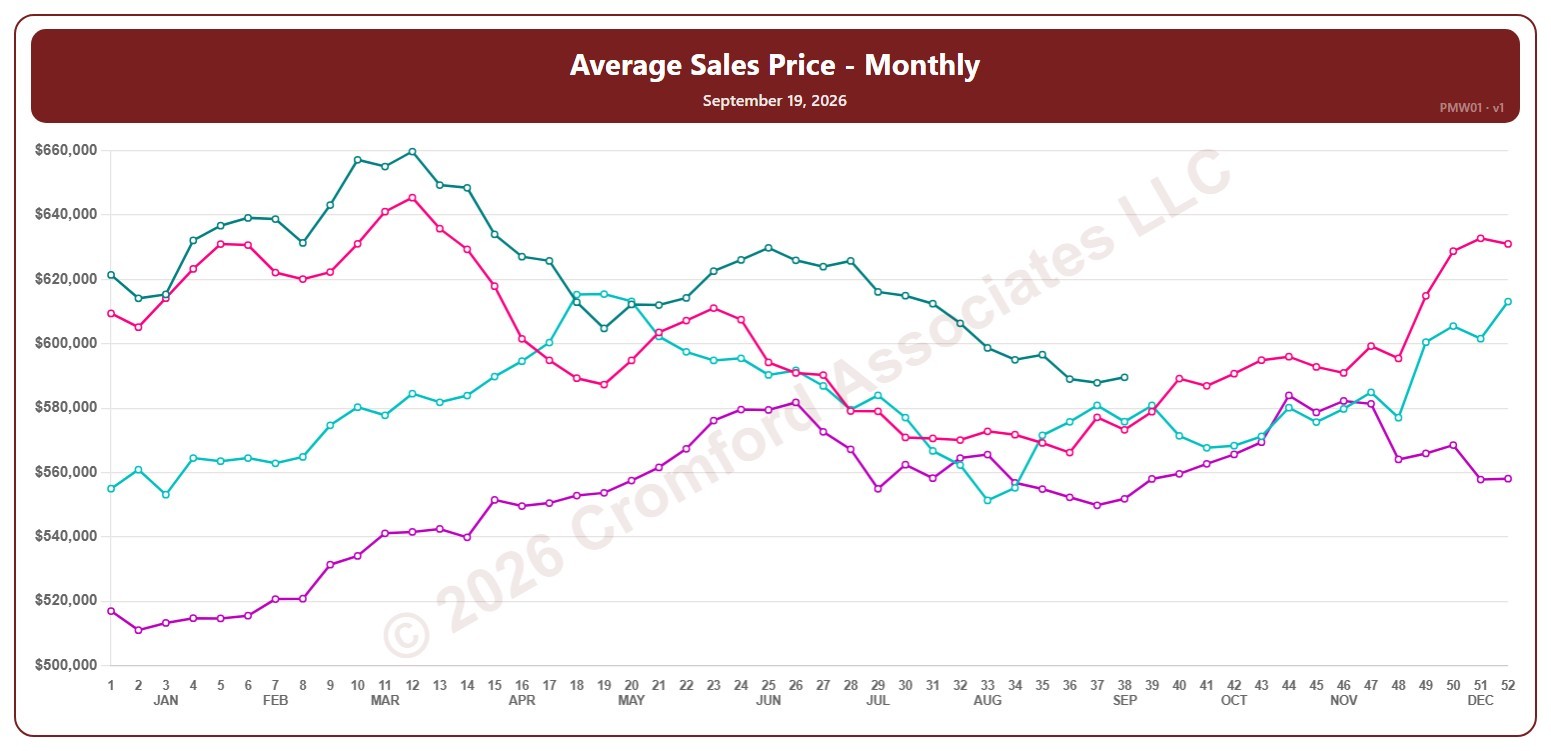
This chart shows the average sales price of the homes that closed in a month, for the whole ARMLS market, all areas and all dwelling types, measured every week. Each point covers the closings in the month up to that Saturday. Sales of large, expensive homes pull the average up more than the median.

Each year has its own line, laid out by week of the year (each Saturday), so you can compare this year with earlier years at the same point in the season. It opens on the last four years; tick any year back to 2001 in the Year panel.

Hover over a line to see the exact figure for that week.
Sales per Month – Long Term

About this chart

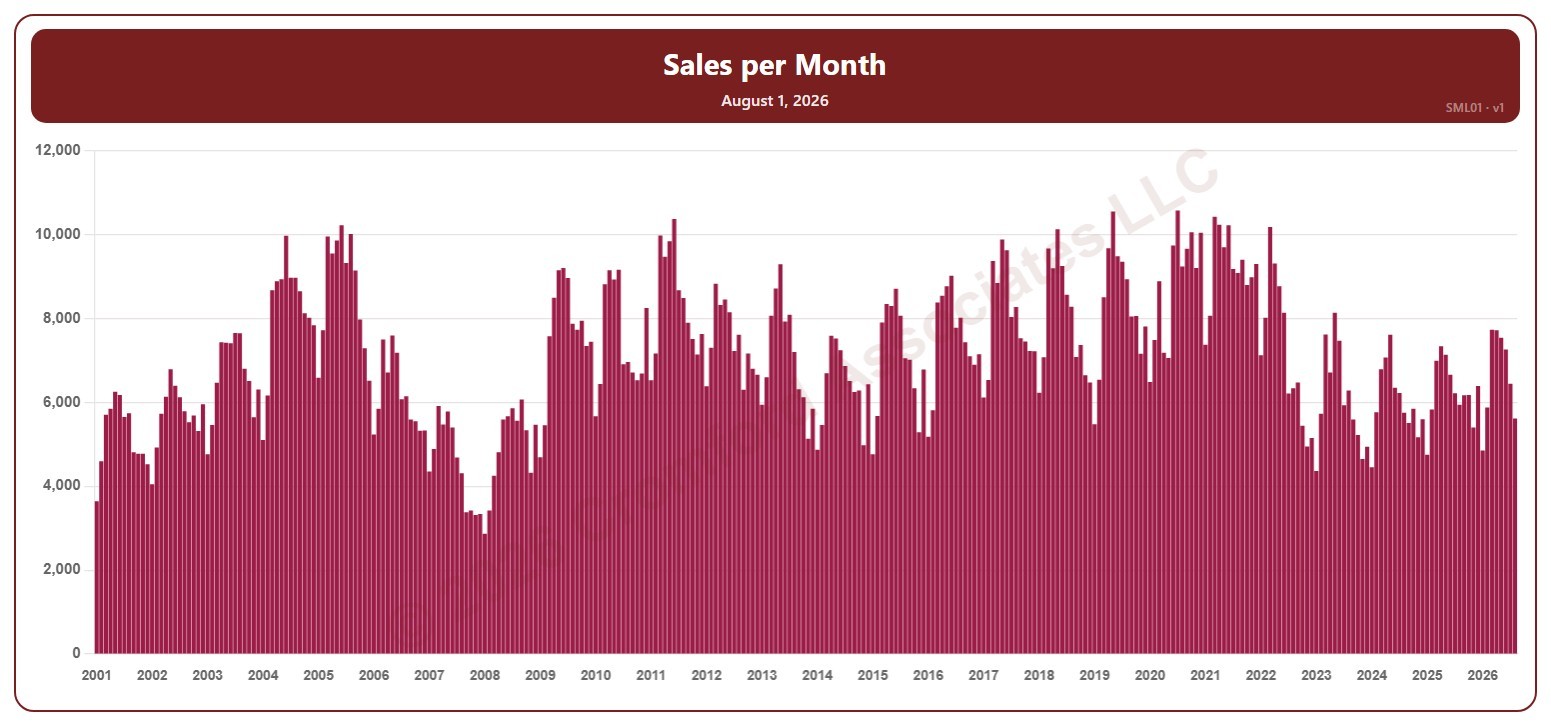
This chart shows the number of homes that closed in a month (sales per month), for the whole ARMLS market, all areas and all dwelling types, as one bar per month since January 2001. Each bar covers the closings in that calendar month.

Hover over a bar to see the exact figure for that month.

Sales per Month – Monthly

About this chart

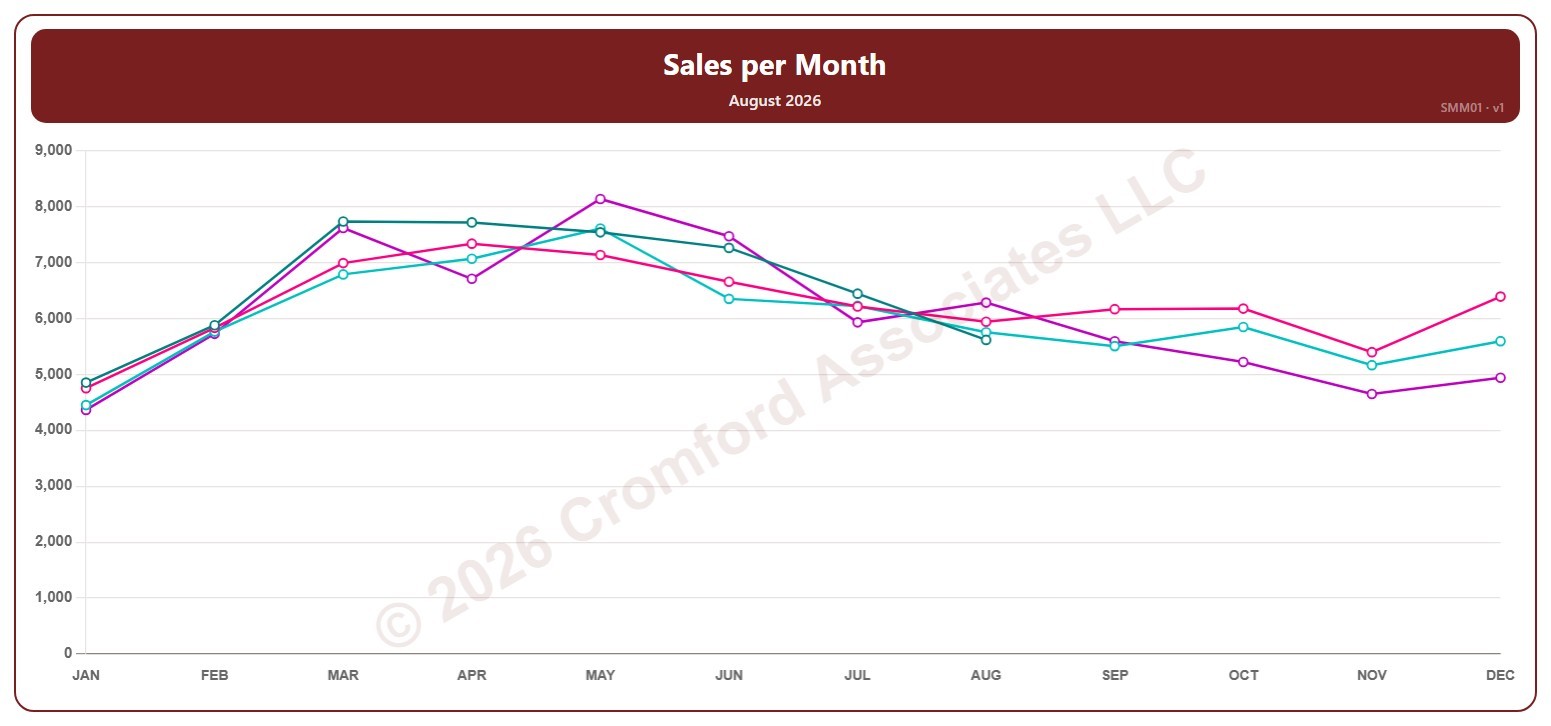
This chart shows the number of homes that closed in a month (sales per month), for the whole ARMLS market, all areas and all dwelling types, measured monthly. Each point covers the closings in that calendar month.

Each year has its own line, laid out by month, so you can compare this year with earlier years at the same point in the season. It opens on the last four years; tick any year back to 2001 in the Year panel.

Hover over a line to see the exact figure for that month.

Sales per Month – Weekly

About this chart

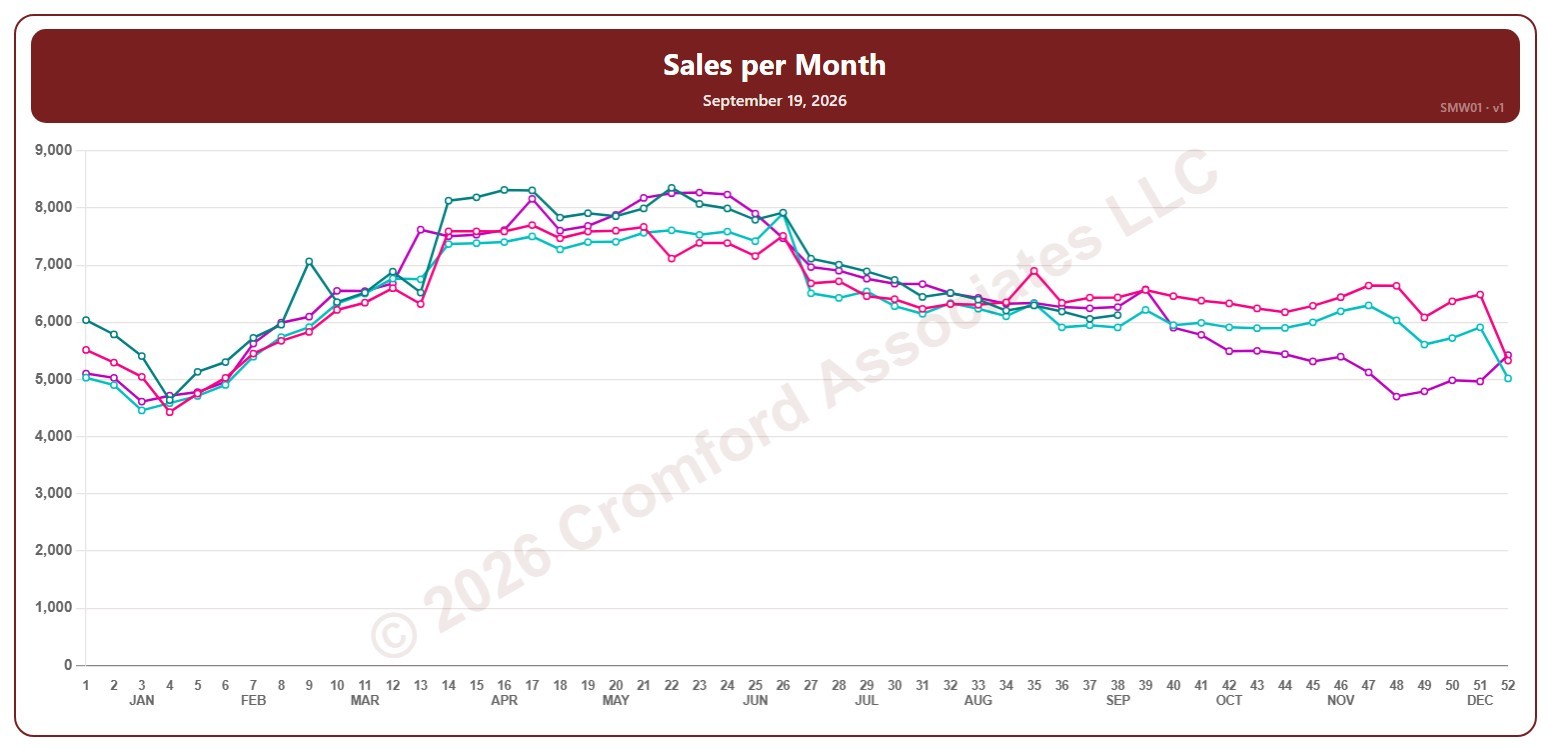
This chart shows the number of homes that closed in a month (sales per month), for the whole ARMLS market, all areas and all dwelling types, measured every week. Each point covers the closings in the month up to that Saturday.

Each year has its own line, laid out by week of the year (each Saturday), so you can compare this year with earlier years at the same point in the season. It opens on the last four years; tick any year back to 2001 in the Year panel.

Hover over a line to see the exact figure for that week.