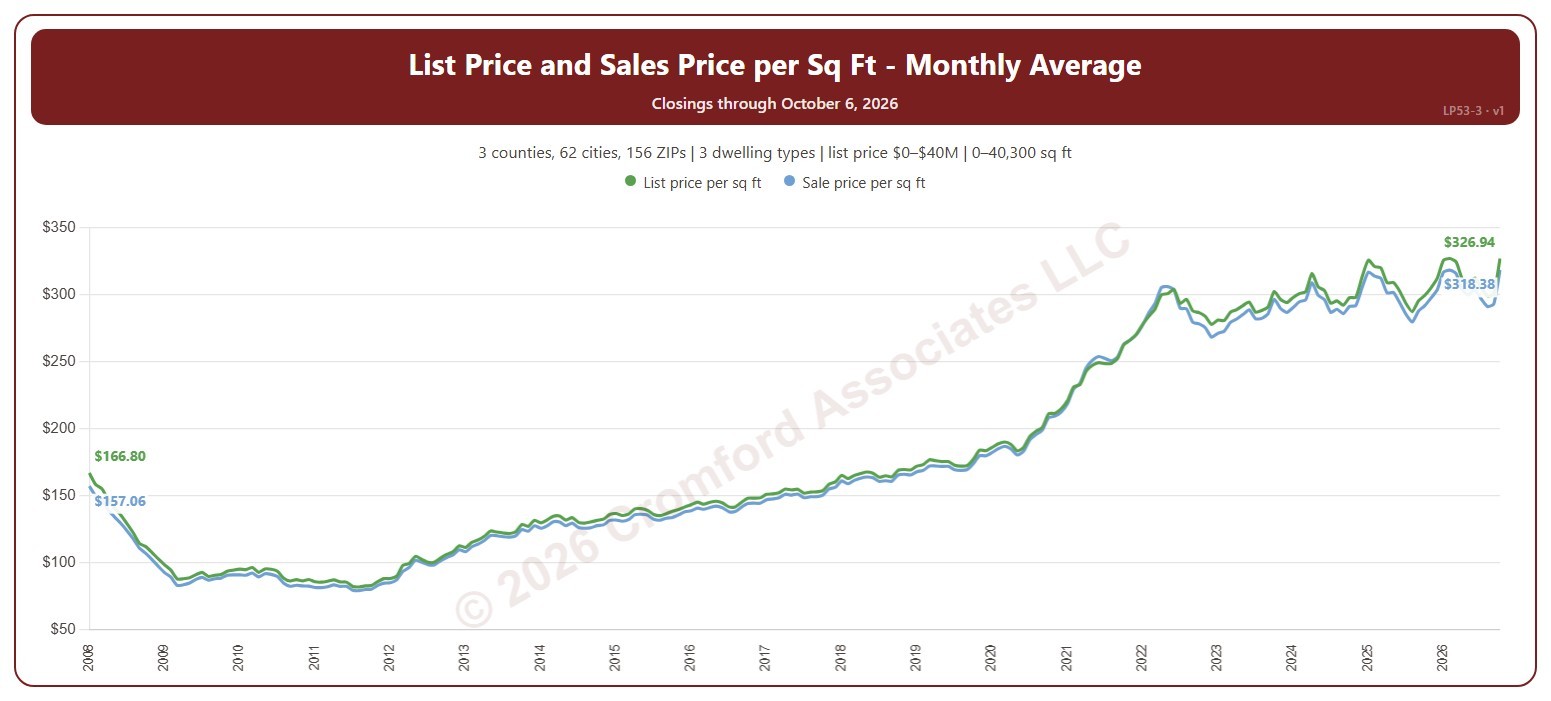
List Price and Sales Price per Square Foot

About this chart

This chart shows two lines for the homes that closed through ARMLS: the list price per square foot and the sale price per square foot, each calendar month. The gap between them shows how far below (or above) their asking price homes are selling.

It opens on the years since 2008; tick any year back to 2000 in the Year panel. The newest month is the month so far.

It opens on the Greater Phoenix area: the counties, cities, and ZIP codes that make it up are ticked to start with. Tick or untick any of them to change the area, including counties beyond Greater Phoenix. Narrow it further with the Dwelling Type (condo, mobile, single family), Transaction Type, and New / Resale boxes and the list price, home size, and year built sliders.

Hover over the chart to see the figures for that month.
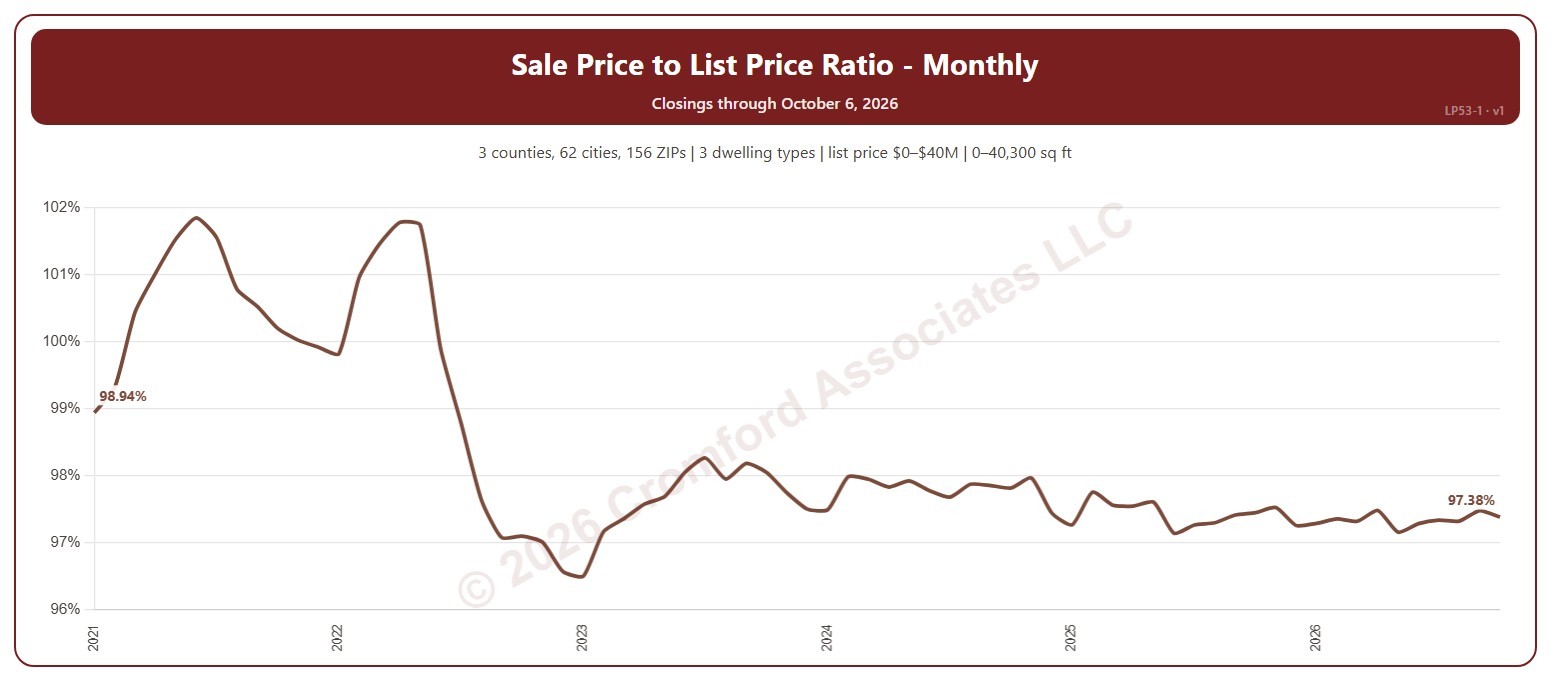
Sales Price to List Price Ratio – Monthly

About this chart

This chart shows the sale price to list price ratio of the homes that closed through ARMLS each calendar month: the total of the sale prices as a percentage of the total of the final list prices. Above 100%, homes are selling for more than their asking price on average; below 100%, buyers are negotiating prices down.

It opens on the years since 2021; tick any year back to 2000 in the Year panel. The newest month is the month so far.

It opens on the Greater Phoenix area: the counties, cities, and ZIP codes that make it up are ticked to start with. Tick or untick any of them to change the area, including counties beyond Greater Phoenix. Narrow it further with the Dwelling Type (condo, mobile, single family), Transaction Type, and New / Resale boxes and the list price, home size, and year built sliders.

Hover over the chart to see the figures for that month.
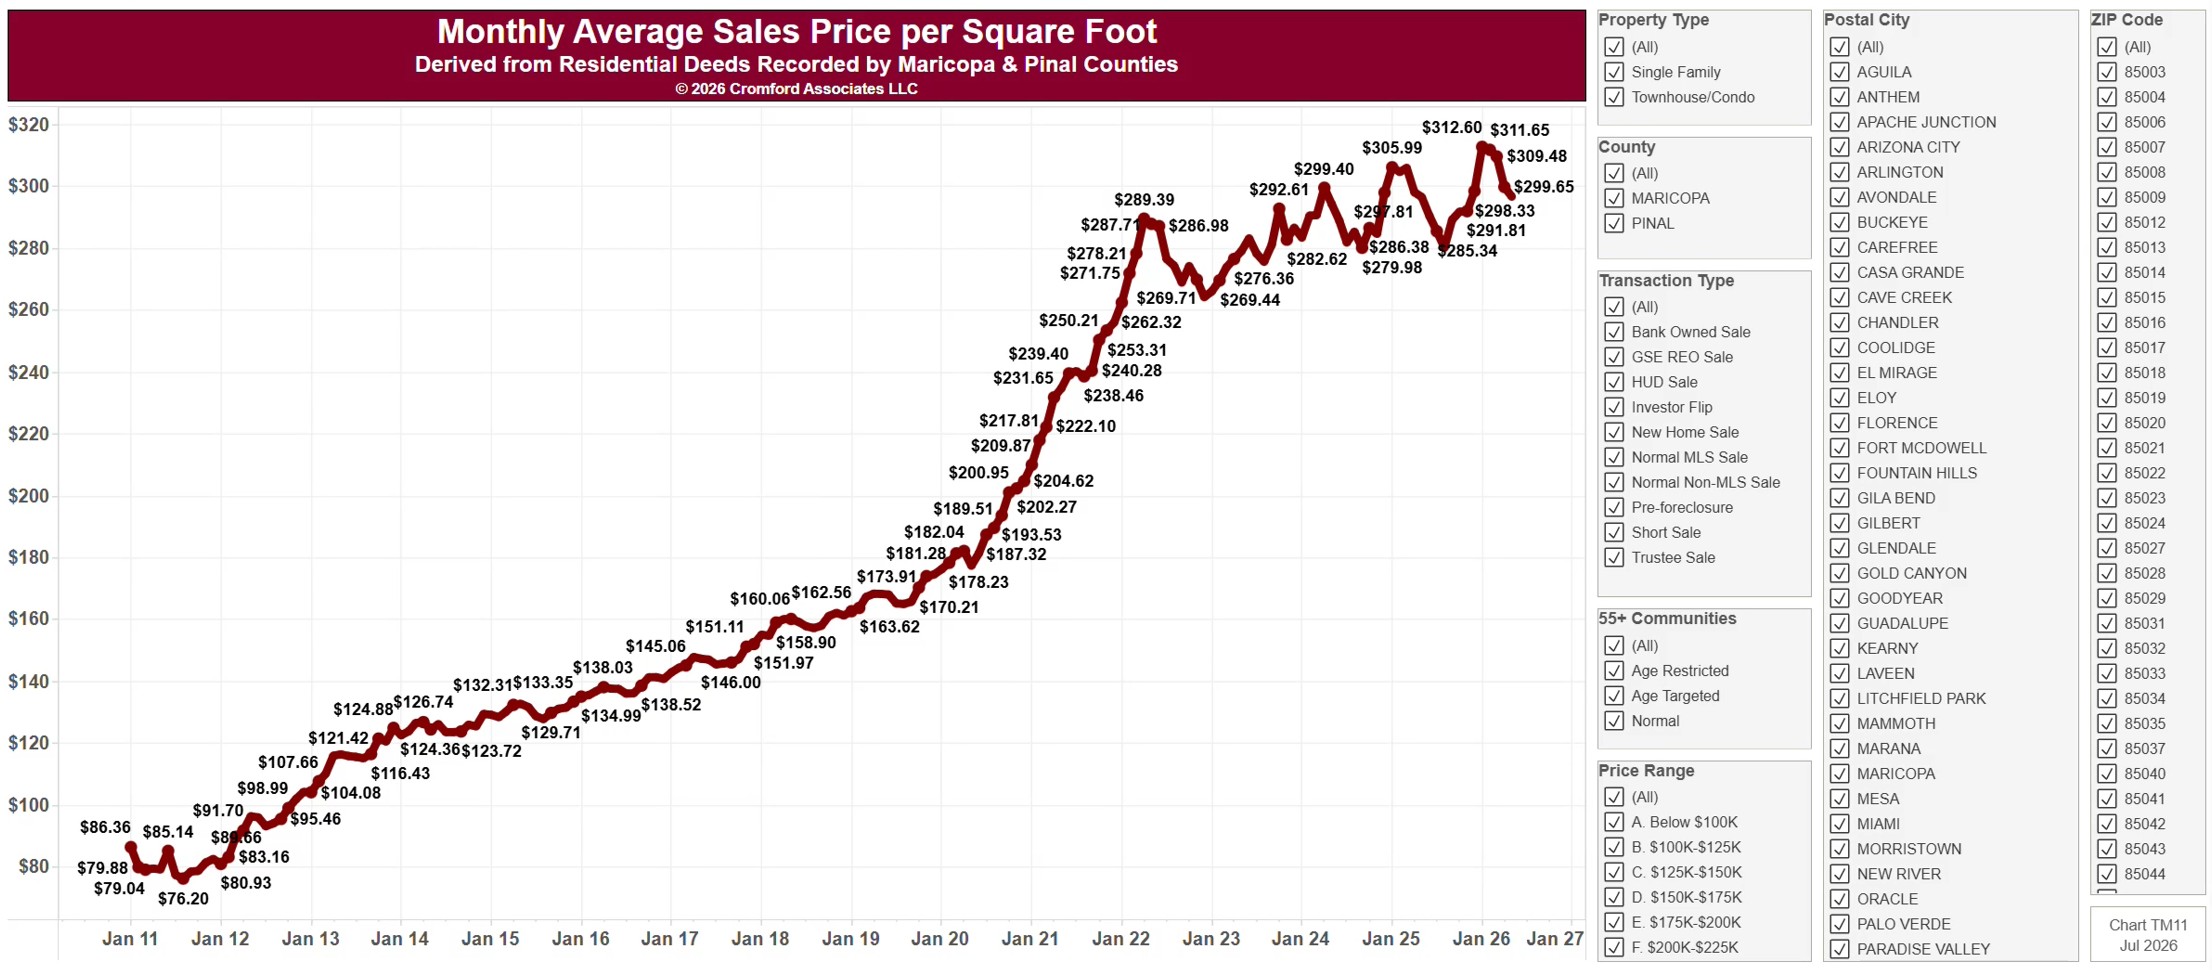
Monthly Average Sales Price per Square Foot

About this chart

This chart shows the average price per square foot of homes sold, as a line by calendar month since January 2011, from residential deeds recorded by Maricopa and Pinal Counties. Price per square foot lets you compare homes of different sizes. Because it is built from recorded deeds, it covers every recorded sale, not just homes listed on ARMLS: new homes, private sales, and investor deals are all included.

It opens on Maricopa and Pinal Counties with everything included. Narrow it with the County, City, and ZIP panels, the Transaction Type, Property Type, and 55+ Communities boxes, and the sale price and home size sliders. Untick years in the Year panel to drop them from the chart.

The records run to the end of last month and are updated monthly. Hover over the line to see the exact figure for that month.

Monthly Closed Sales by Transaction Type

About this chart

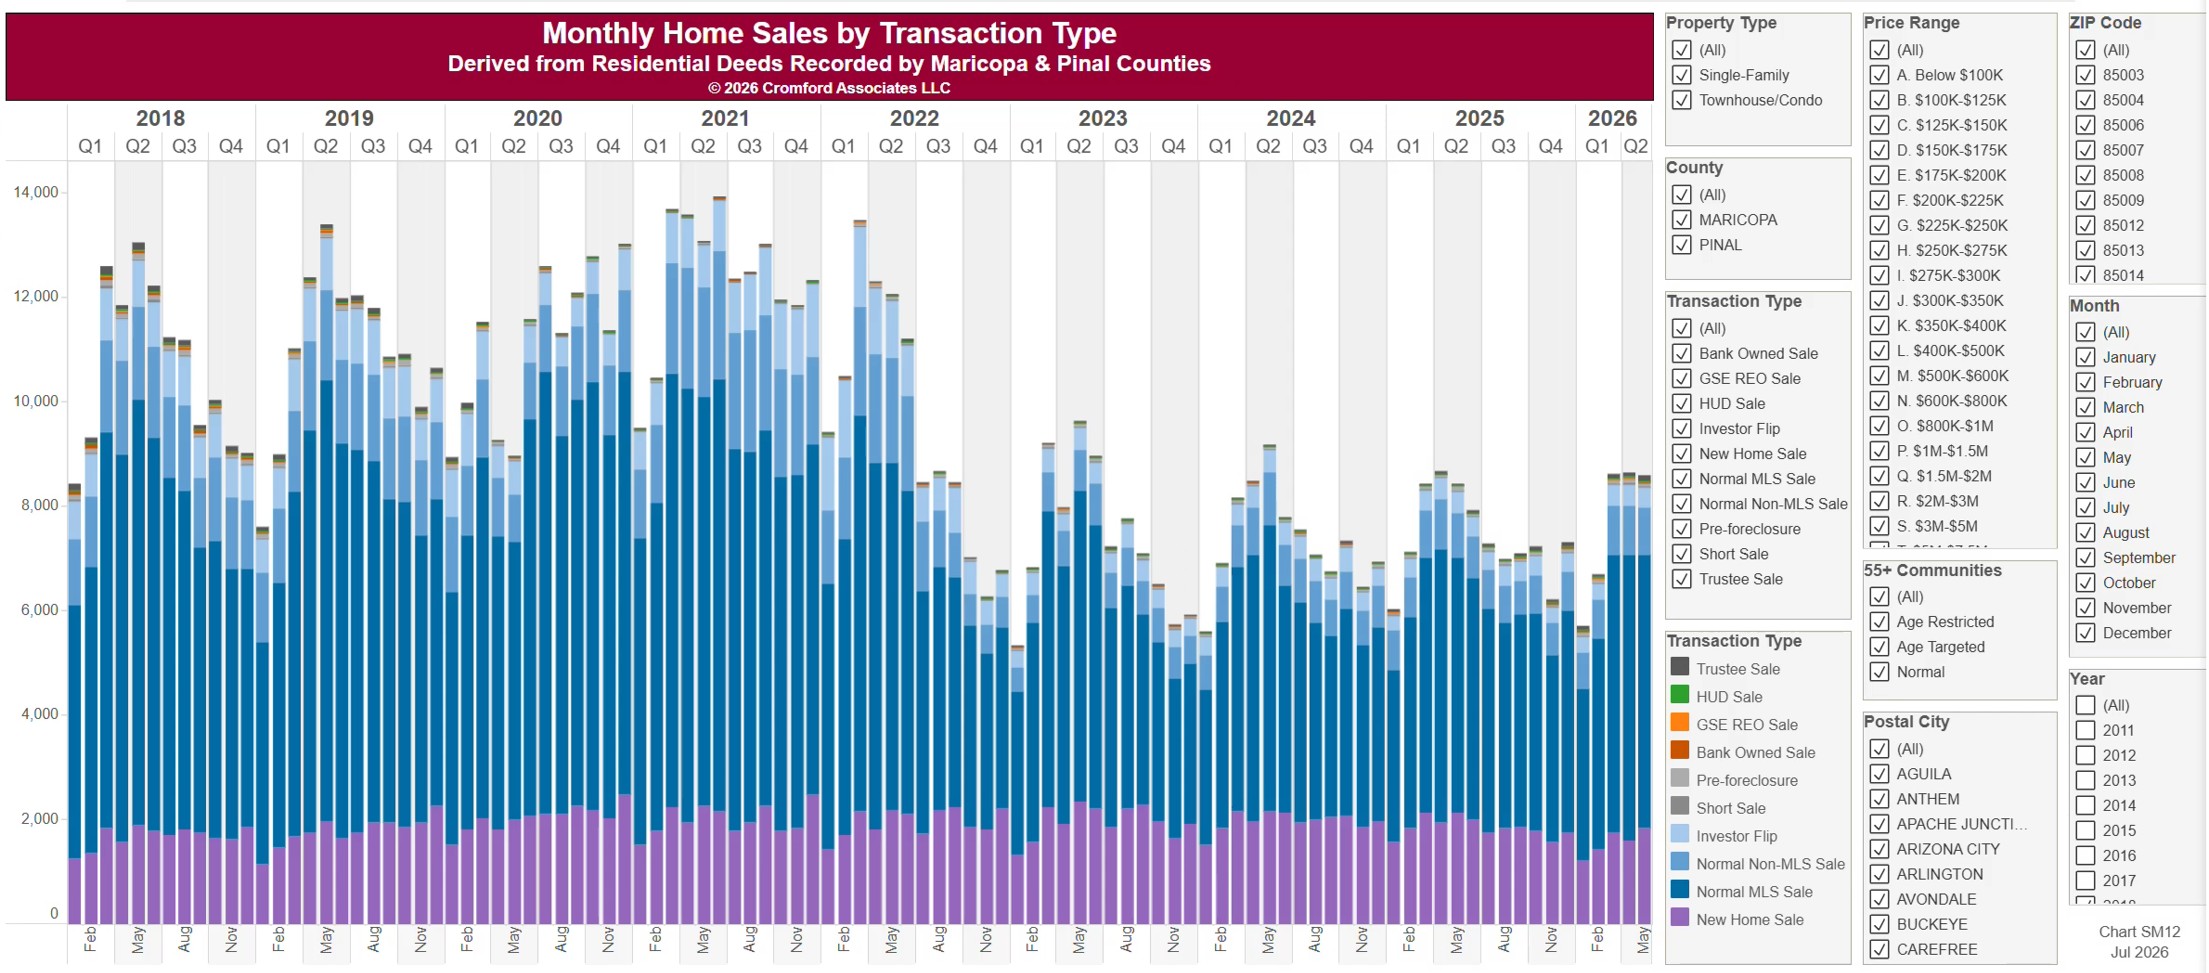
This chart counts the homes sold each calendar month since January 2011, from residential deeds recorded by Maricopa and Pinal Counties, with each bar split by transaction type: normal MLS and non-MLS sales, new home sales, investor flips, short sales and pre-foreclosures, trustee sales, and lender-owned and HUD sales. It shows how the mix of the market changes over time. Because it is built from recorded deeds, it covers every recorded sale, not just homes listed on ARMLS: new homes, private sales, and investor deals are all included.

It opens on Maricopa and Pinal Counties with everything included. Narrow it with the County, City, and ZIP panels, the Transaction Type, Property Type, and 55+ Communities boxes, and the sale price and home size sliders. Untick years in the Year panel to drop them from the chart.

The records run to the end of last month and are updated monthly. Hover over a bar to see the counts for that month.

Monthly Home Sales

About this chart

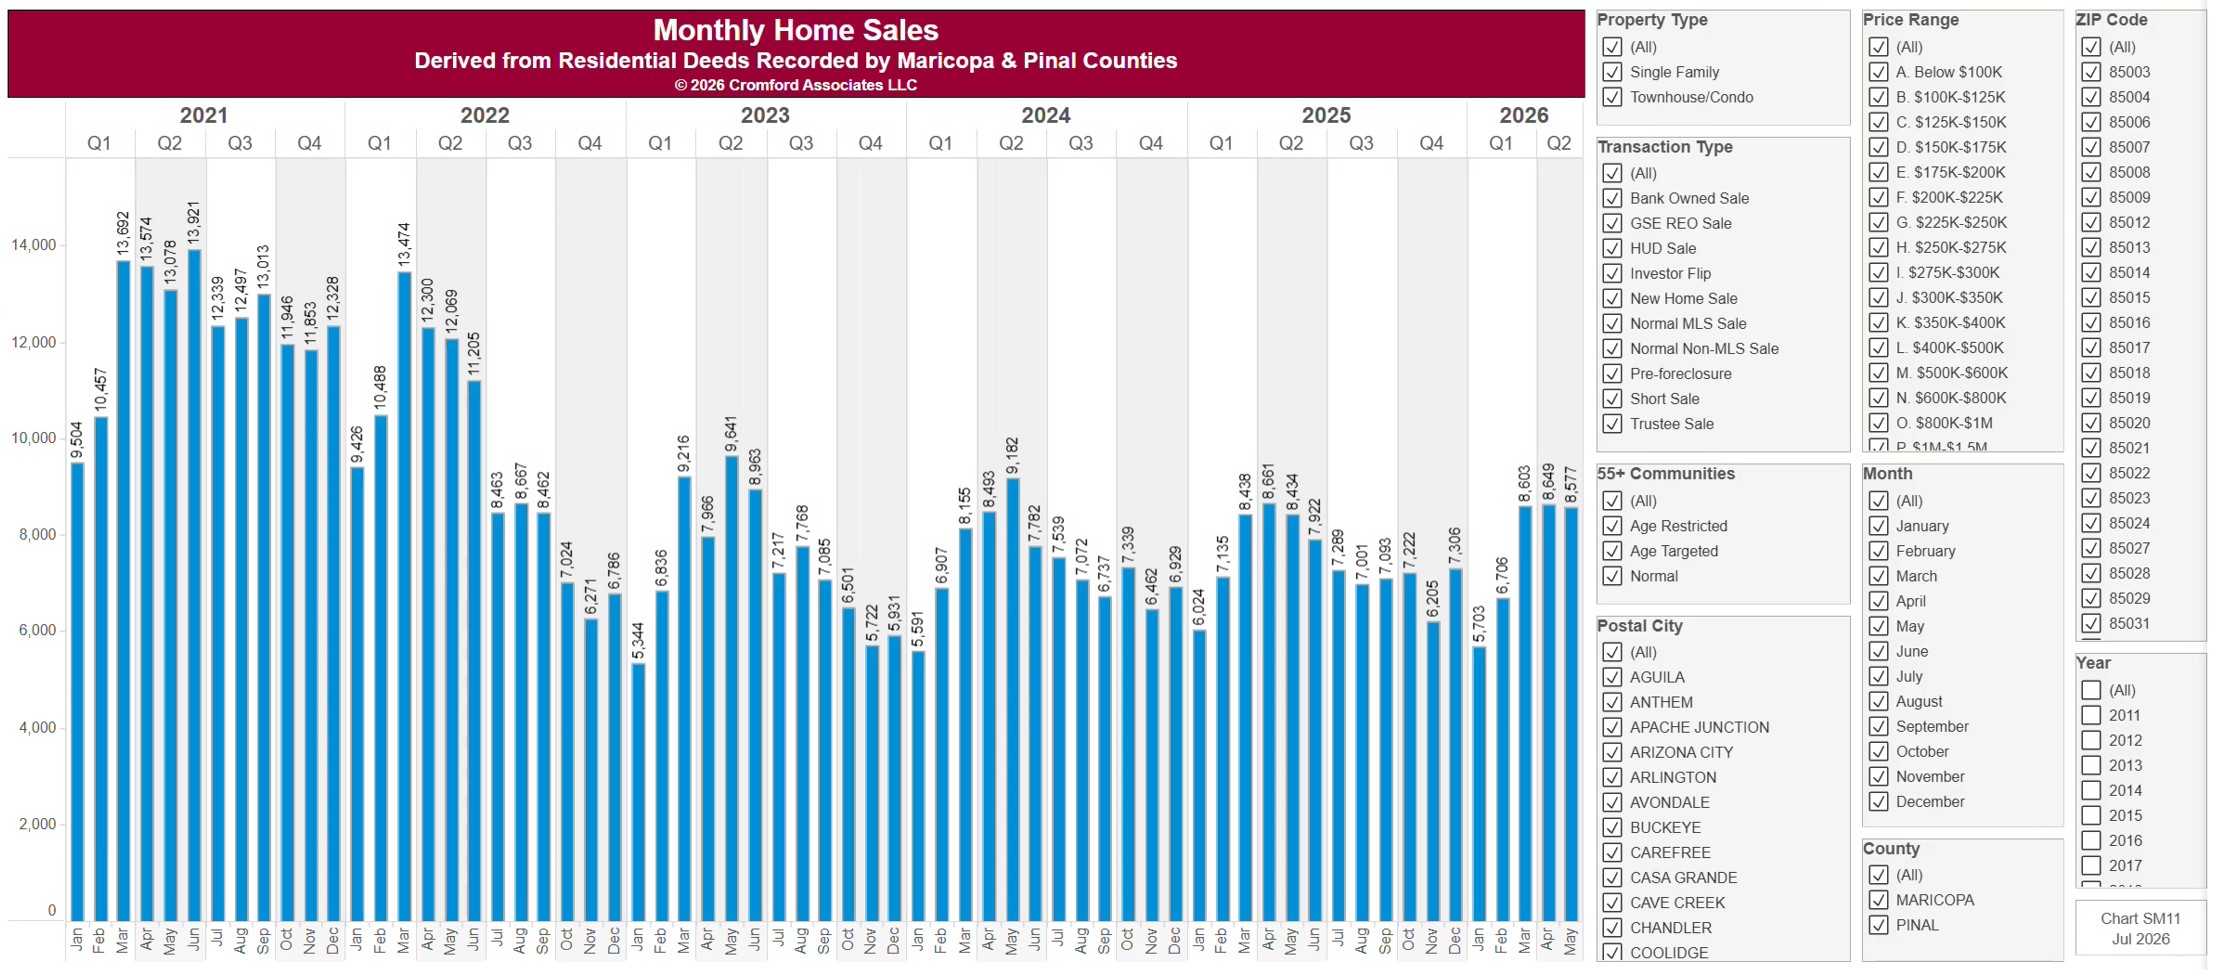
This chart counts the homes sold each calendar month since January 2011, from residential deeds recorded by Maricopa and Pinal Counties. Because it is built from recorded deeds, it covers every recorded sale, not just homes listed on ARMLS: new homes, private sales, and investor deals are all included.

It opens on Maricopa and Pinal Counties with everything included. Narrow it with the County, City, and ZIP panels, the Transaction Type, Property Type, and 55+ Communities boxes, and the sale price slider. Untick years in the Year panel to drop them from the chart.

The records run to the end of last month and are updated monthly. Hover over a bar to see the exact figure for that month.

Monthly Average Sales Price

About this chart

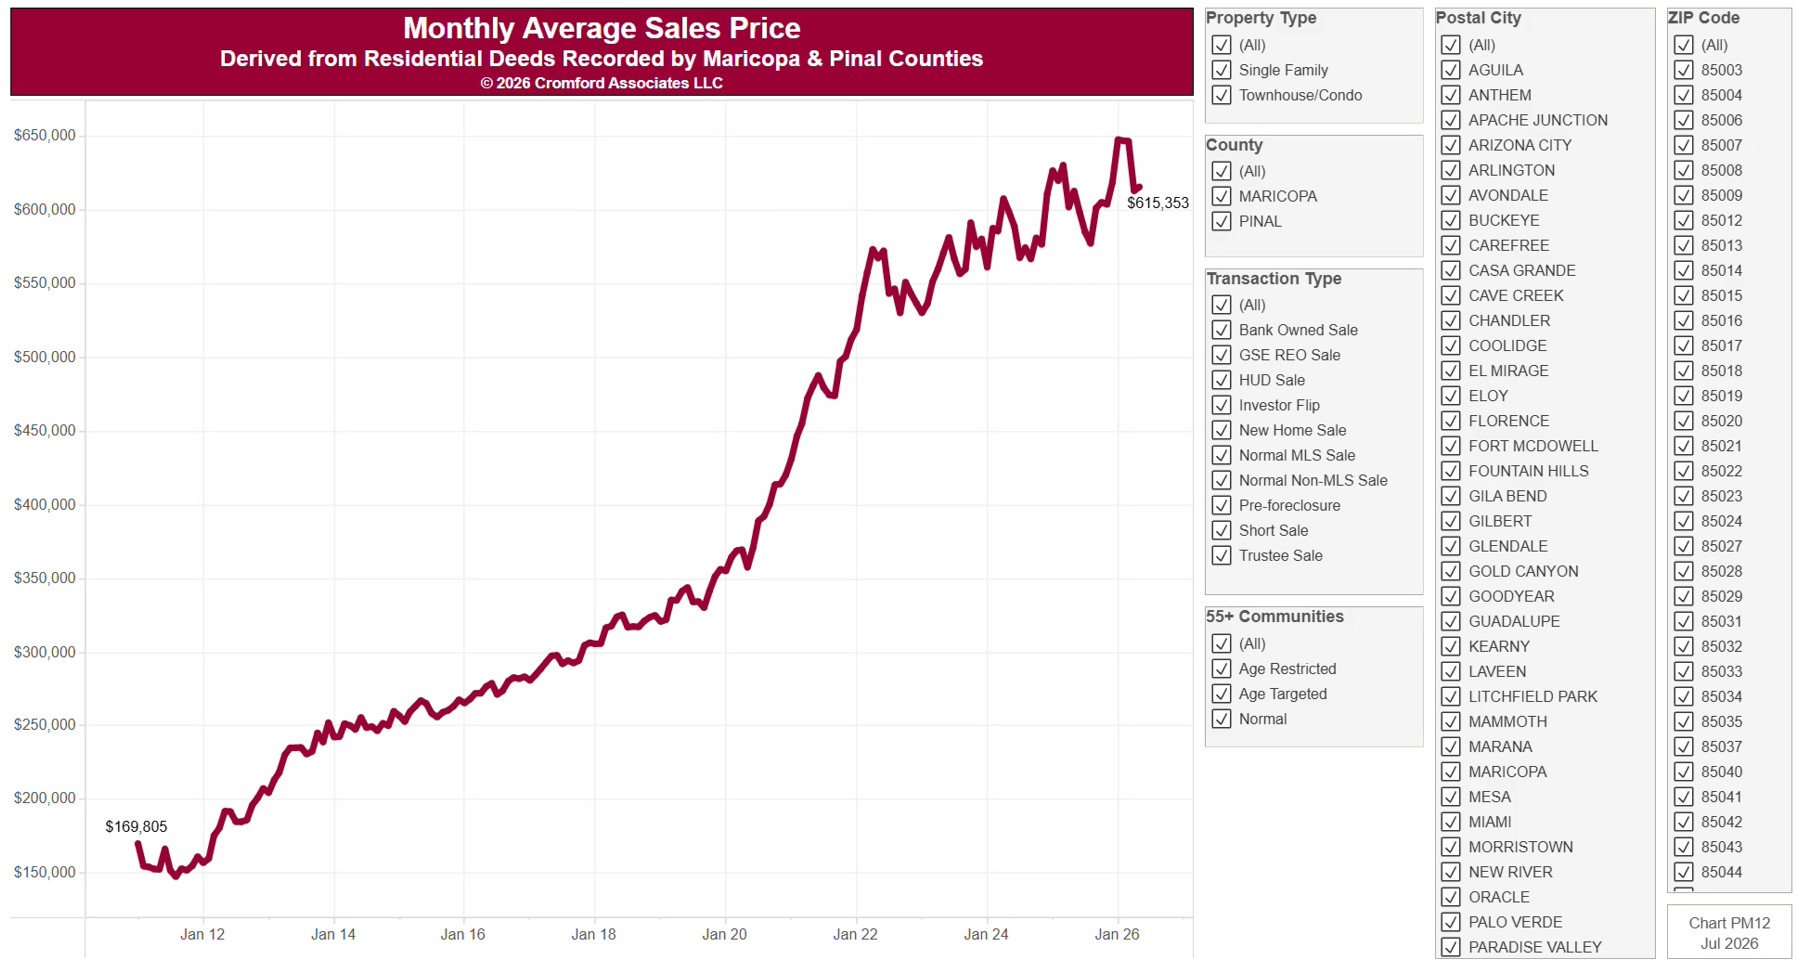
This chart shows the average sale price of homes as a line by calendar month since January 2011, from residential deeds recorded by Maricopa and Pinal Counties. It is the same series as PM11, drawn as a line. Sales of large, expensive homes pull the average up more than the median. Because it is built from recorded deeds, it covers every recorded sale, not just homes listed on ARMLS: new homes, private sales, and investor deals are all included.

It opens on Maricopa and Pinal Counties with everything included. Narrow it with the County, City, and ZIP panels, the Transaction Type, Property Type, and 55+ Communities boxes, and the sale price and home size sliders.

The records run to the end of last month and are updated monthly. Hover over the line to see the exact figure for that month.

Monthly Average Sale Price

About this chart

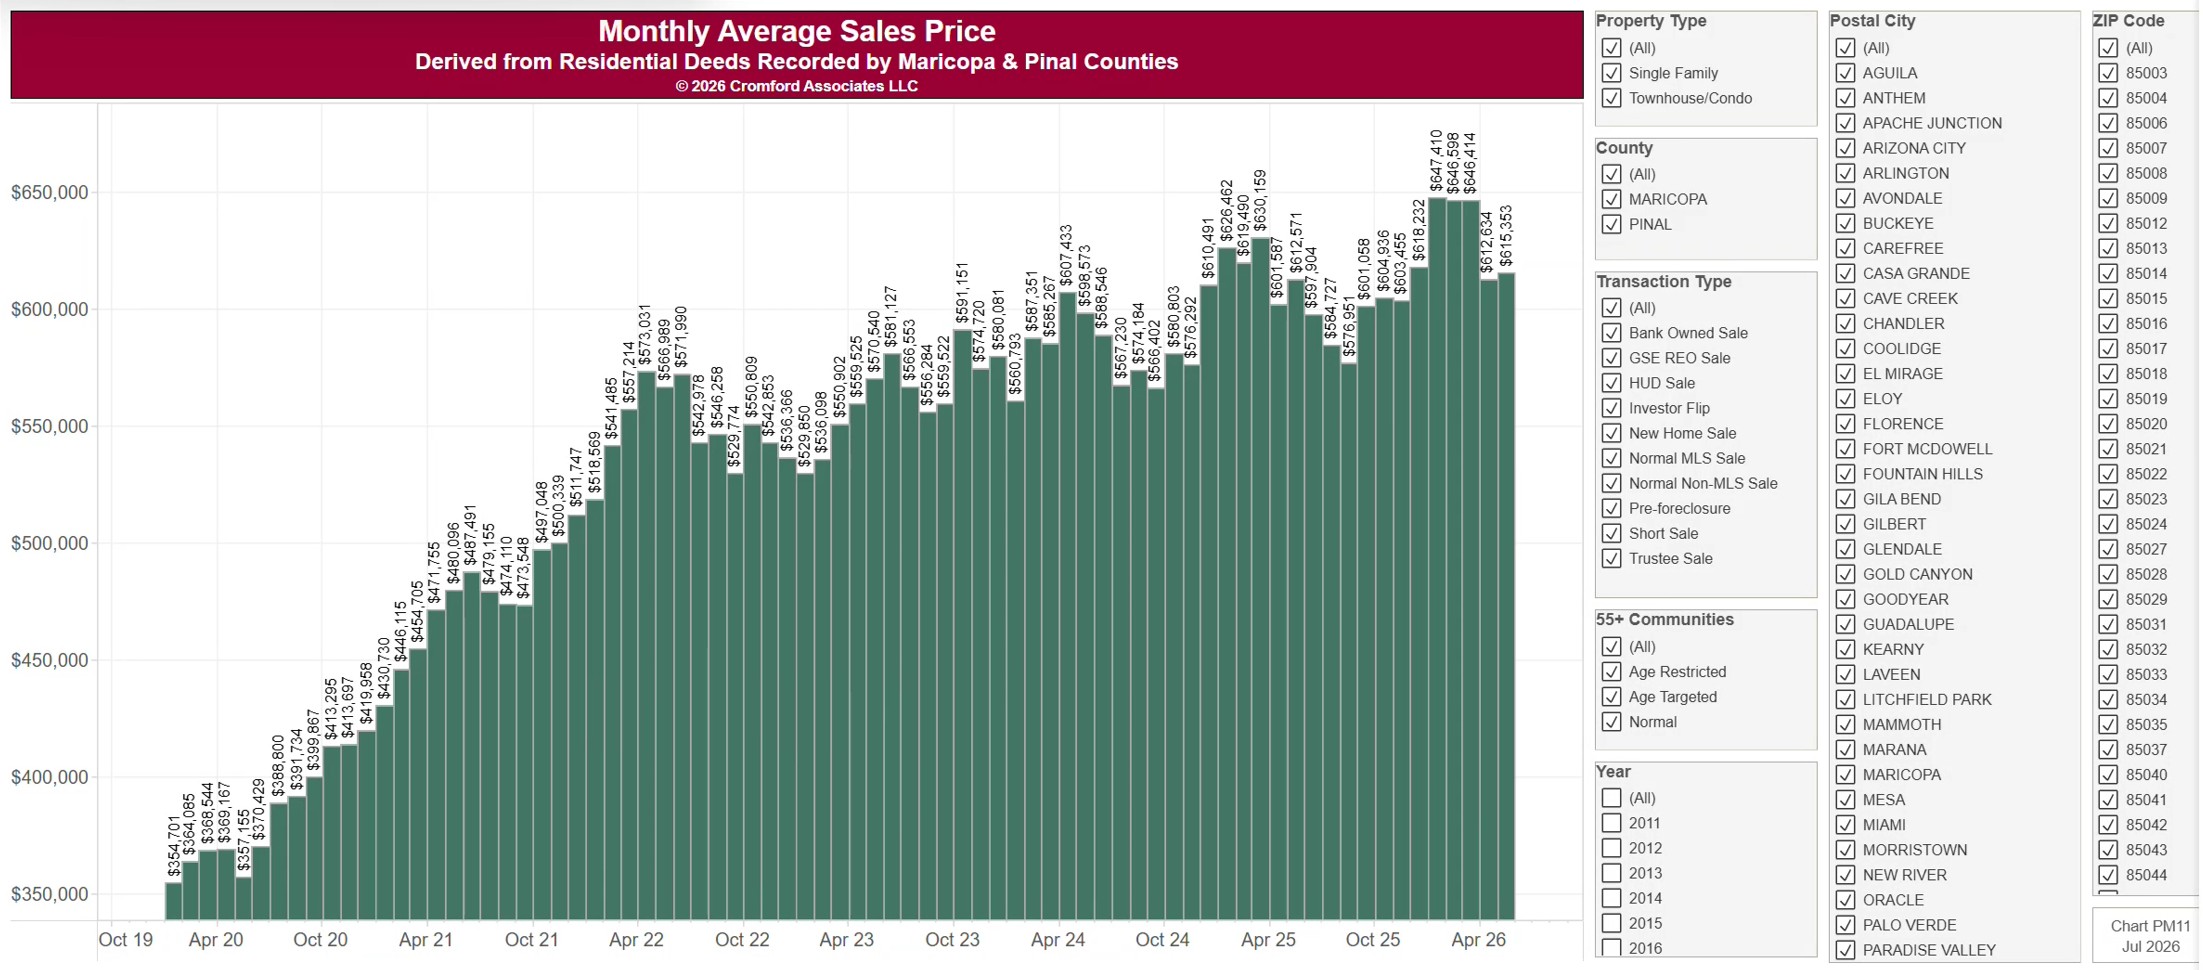
This chart shows the average sale price of homes, one bar per calendar month since January 2011, from residential deeds recorded by Maricopa and Pinal Counties. Sales of large, expensive homes pull the average up more than the median. Because it is built from recorded deeds, it covers every recorded sale, not just homes listed on ARMLS: new homes, private sales, and investor deals are all included.

It opens on Maricopa and Pinal Counties with everything included. Narrow it with the County, City, and ZIP panels, the Transaction Type, Property Type, and 55+ Communities boxes, and the sale price slider. Untick years in the Year panel to drop them from the chart.

The records run to the end of last month and are updated monthly. Hover over a bar to see the exact figure for that month.

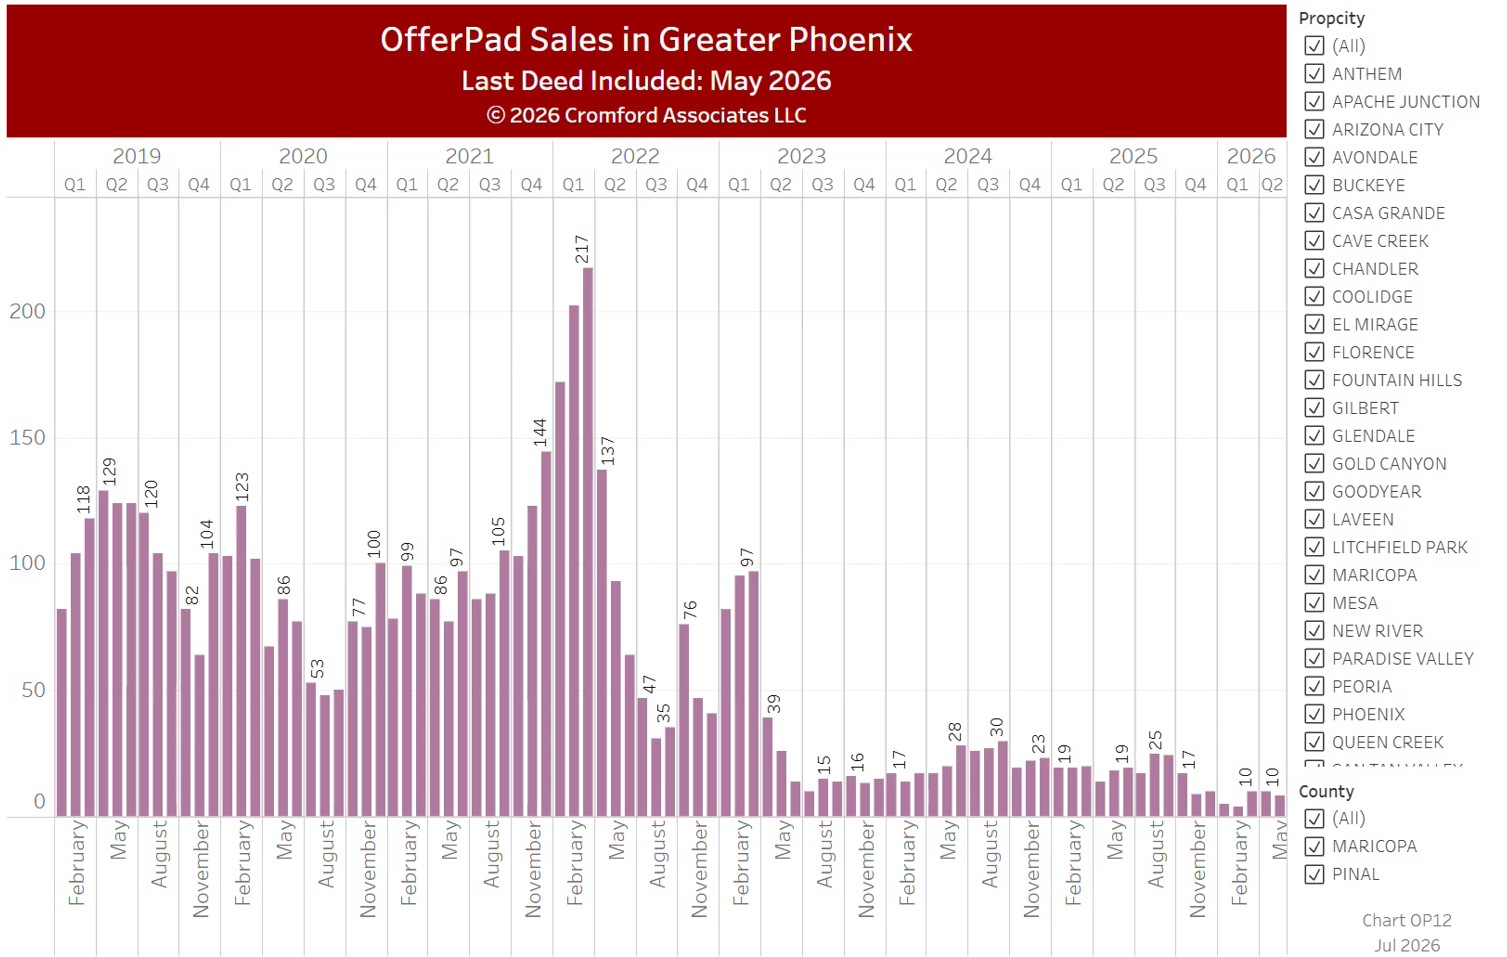
OfferPad Sales in Greater Phoenix

About this chart

This chart counts the homes OfferPad sold each calendar month since January 2016, from residential deeds recorded by Maricopa and Pinal Counties. OfferPad is an iBuyer: it buys homes directly from owners and resells them. OP11 shows the homes it bought, so the two together show whether it is building up or running down its inventory.

It opens on Maricopa and Pinal Counties with everything included. Narrow it with the County, City, and ZIP panels, the Transaction Type, Property Type, and 55+ Communities boxes, and the sale price slider. Untick years in the Year panel to drop them from the chart.

The records run to the end of last month and are updated monthly. Hover over a bar to see the exact figure for that month.

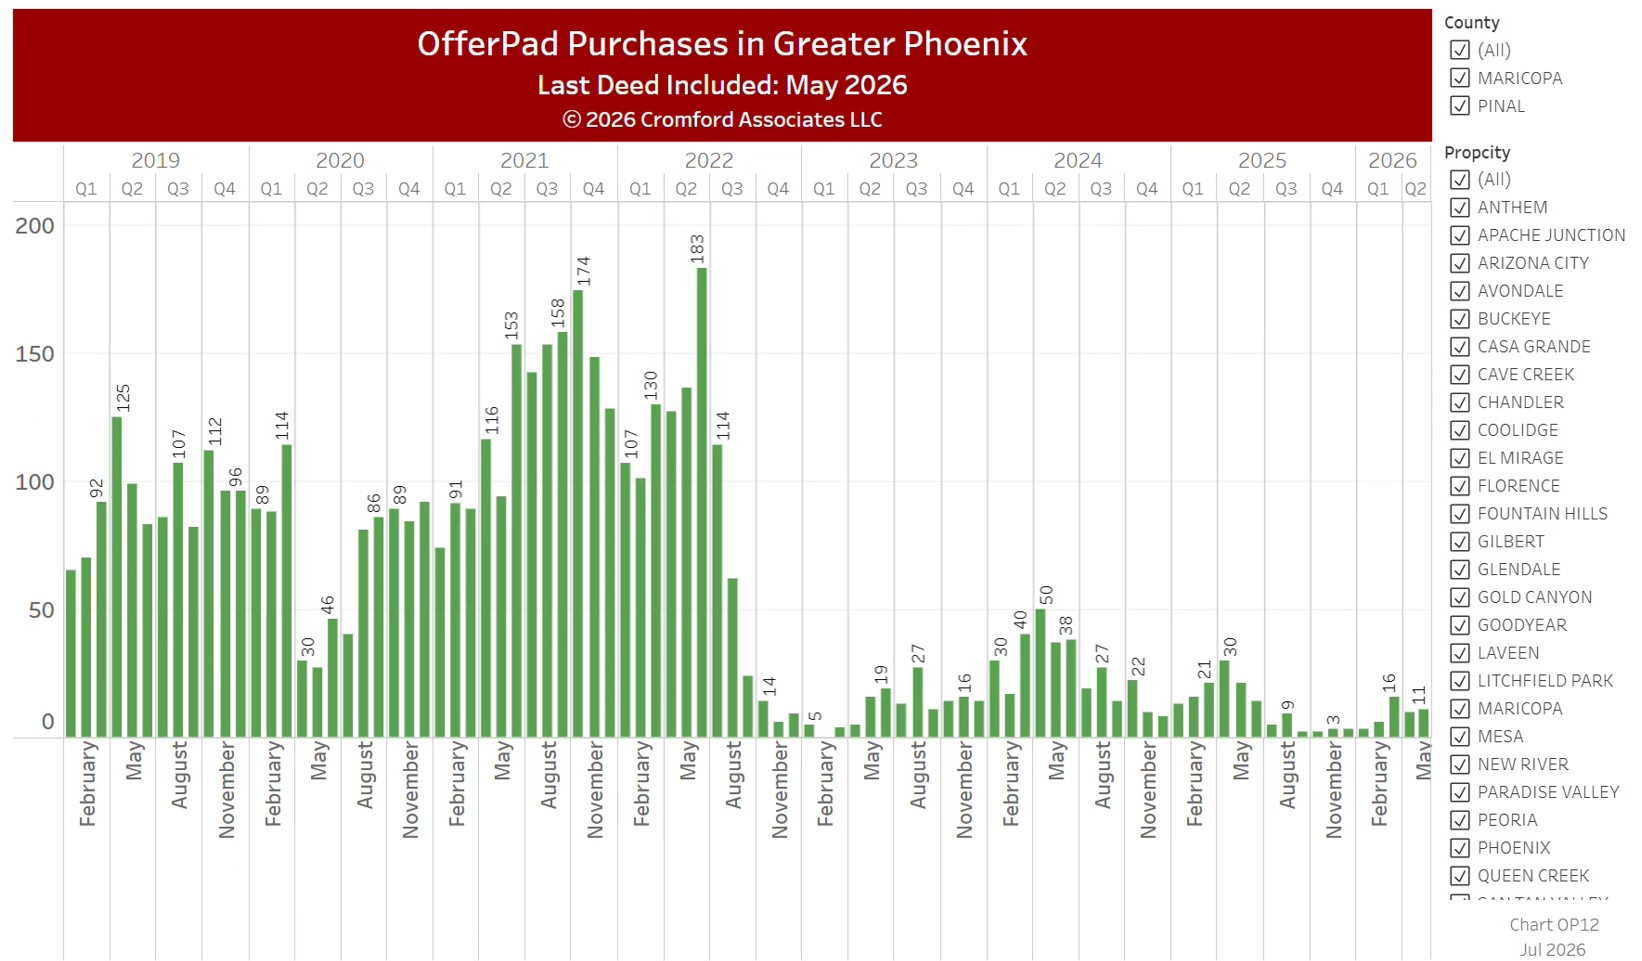
OfferPad Purchases in Greater Phoenix

About this chart

This chart counts the homes OfferPad bought each calendar month since November 2015, from residential deeds recorded by Maricopa and Pinal Counties. OfferPad is an iBuyer: it buys homes directly from owners and resells them. OP12 shows the homes it sold, so the two together show whether it is building up or running down its inventory.

It opens on Maricopa and Pinal Counties with everything included. Narrow it with the County, City, and ZIP panels, the Transaction Type, Property Type, and 55+ Communities boxes, and the sale price slider. Untick years in the Year panel to drop them from the chart.

The records run to the end of last month and are updated monthly. Hover over a bar to see the exact figure for that month.

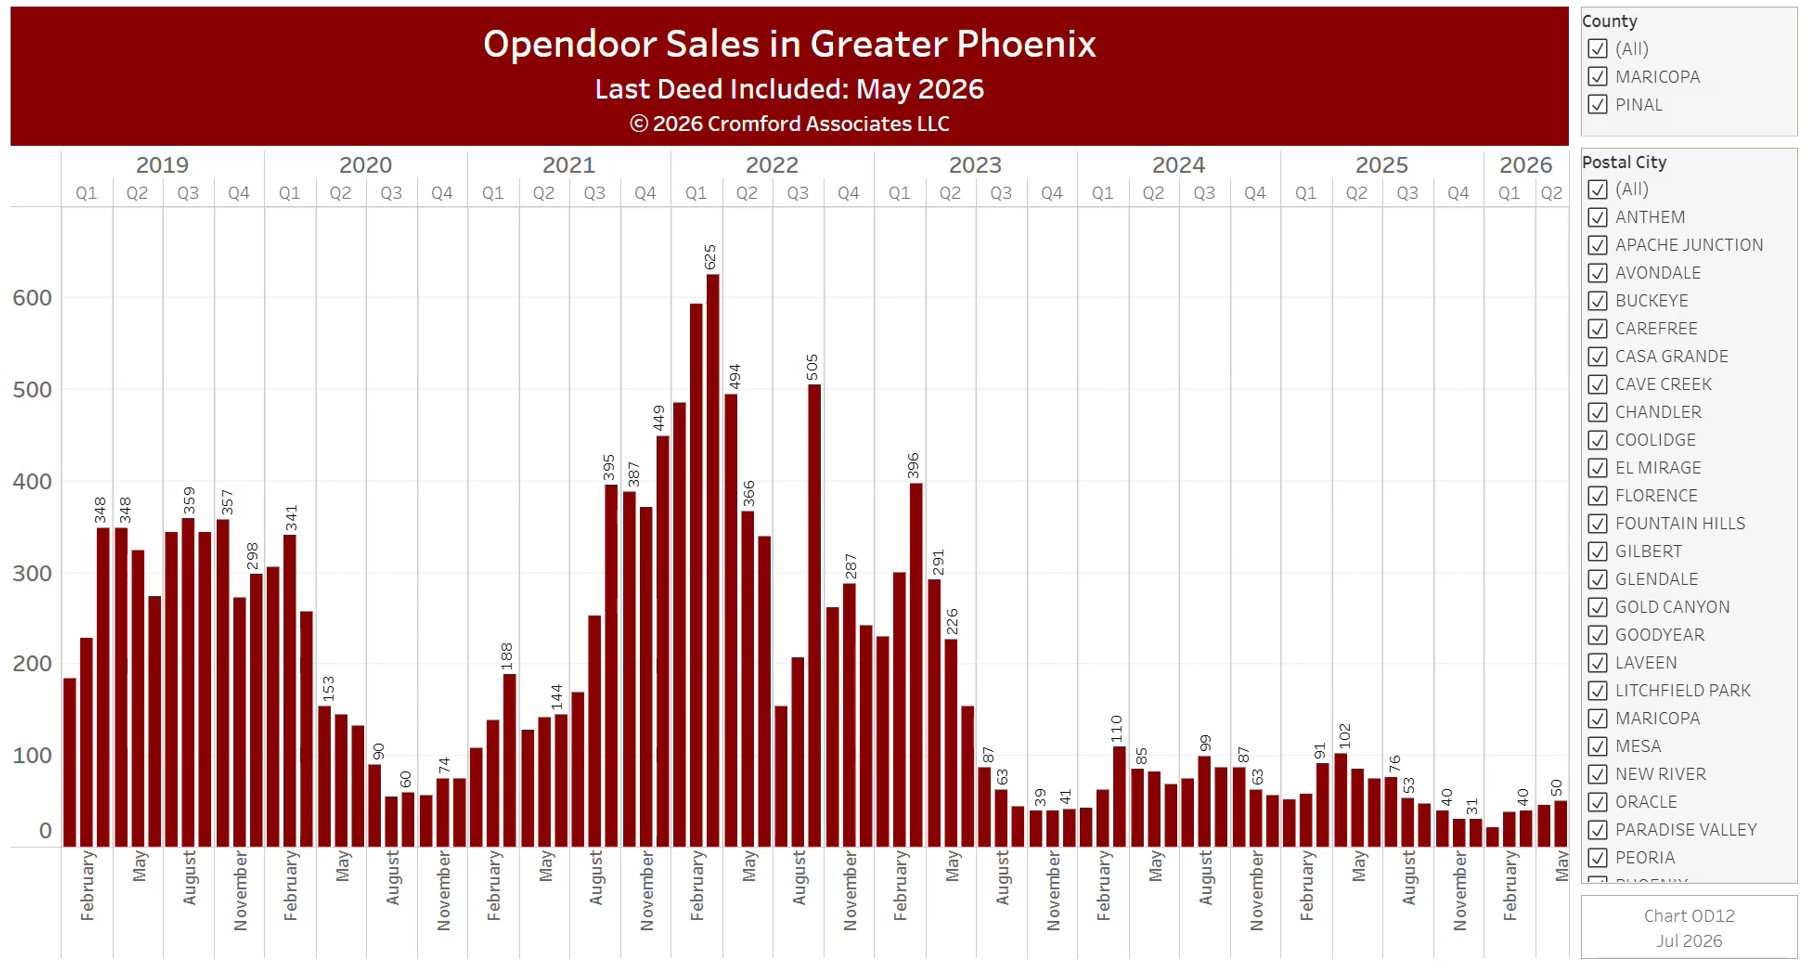
Opendoor Sales in Greater Phoenix

About this chart

This chart counts the homes Opendoor sold each calendar month since November 2014, from residential deeds recorded by Maricopa and Pinal Counties. Opendoor is an iBuyer: it buys homes directly from owners and resells them. OD11 shows the homes it bought, so the two together show whether it is building up or running down its inventory.

It opens on Maricopa and Pinal Counties with everything included. Narrow it with the County, City, and ZIP panels, the Transaction Type, Property Type, and 55+ Communities boxes, and the sale price slider. Untick years in the Year panel to drop them from the chart.

The records run to the end of last month and are updated monthly. Hover over a bar to see the exact figure for that month.