The Cromford® Market Index as a Predictor of Future Annual Price Appreciation – Based on Annual Median $/SF

About this chart

This chart sets the Cromford® Market Index beside annual appreciation for the whole ARMLS market, all areas and all dwelling types, one reading on the 1st of each month since January 2002, with the rate of inflation (Consumer Price Index) alongside. It shows how a shift in the balance between buyers and sellers has been followed by a change in prices.

A reading below 90 indicates a buyer’s market, above 110 a seller’s market, and between 90 and 110 a balanced market. Appreciation is the change in the median sales price per square foot over the last 12 months compared with a year earlier. CMAP01 shows the same comparison using the average sales price per square foot.

The options label the minimum, maximum, and latest values and switch the Market Index to a logarithmic axis. Use the date slider, or Full range, to choose the stretch of history shown. Hover over the chart to see the figures for that month.

Rental Homes by ZIP Code

About this chart

This chart ranks the ZIP codes of Maricopa and Pinal Counties by the share of their homes that the county assessor classes as rentals today. The second color shows the share classed as non-primary residences, which marks second-home areas. It is a current snapshot, not a trend.

A rental the owner has not registered sits in another class, most likely non-primary, so the rental share is a minimum. Apartment complexes are not included. A home with no ZIP in the assessor’s file takes the ZIP on its latest deed.

It opens on the top 25 ZIP codes. Show switches to the top 50 or all ZIP codes, Sort ranks them by rental share, non-primary share, number of rentals, number of homes, or ZIP code, and All, Homes, Condos, and Mobile choose the property type. ZIP codes with fewer than 100 homes are in the table and the totals but not the bars.

Chart and Table switch between the ranked bars and the same figures as a table.

Cromford® Market Index by City – Gauges

About this chart

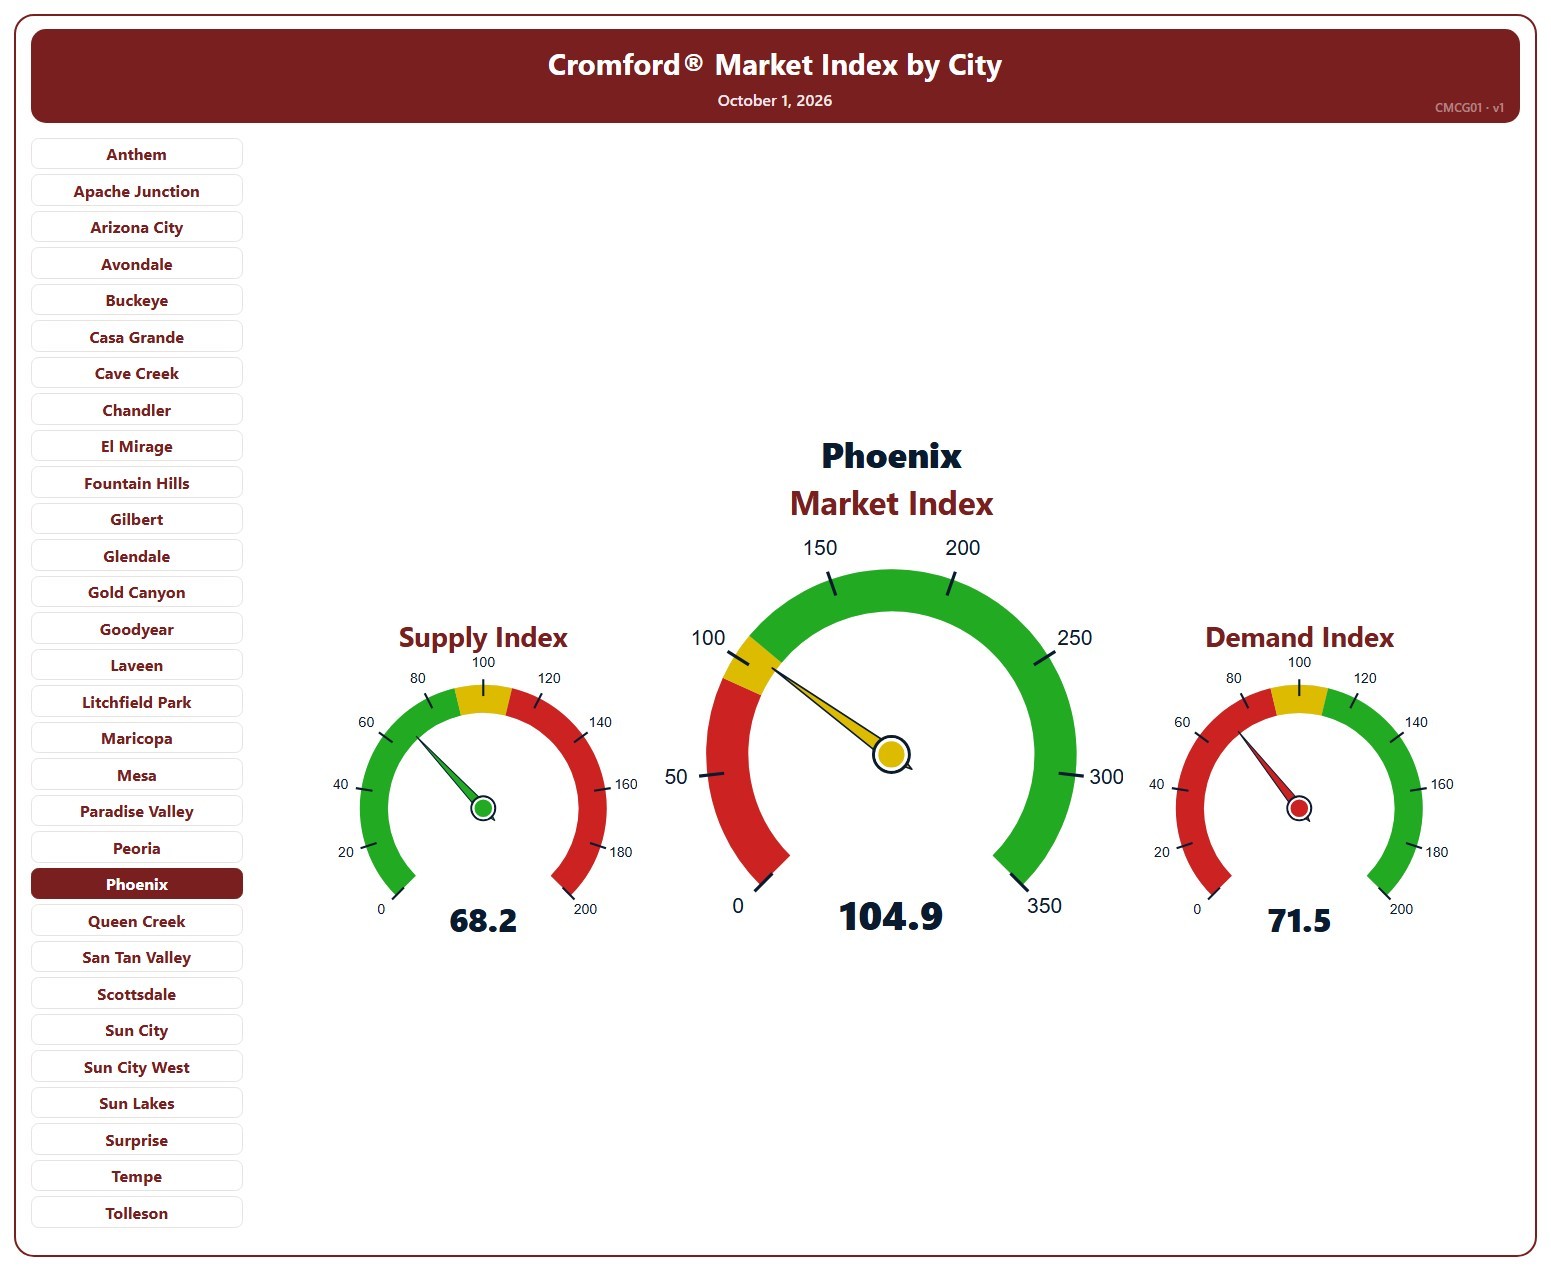
This page shows three gauges for one city: the Cromford® Supply Index, Market Index, and Demand Index at their latest reading, for single-family detached resale homes on ARMLS. It opens on Phoenix; pick any of the 34 cities from the list.

Each dial has three bands, below 90, 90 to 110, and above 110, and the needle takes the color of the band it points into. On the Market and Demand dials green is above 110 and red below 90; on the Supply dial the colors are reversed, because low supply favors sellers.

A Market Index below 90 indicates a buyer’s market, above 110 a seller’s market, and between 90 and 110 a balanced market.

Cromford® Market Index – Last 6 Months

About this chart

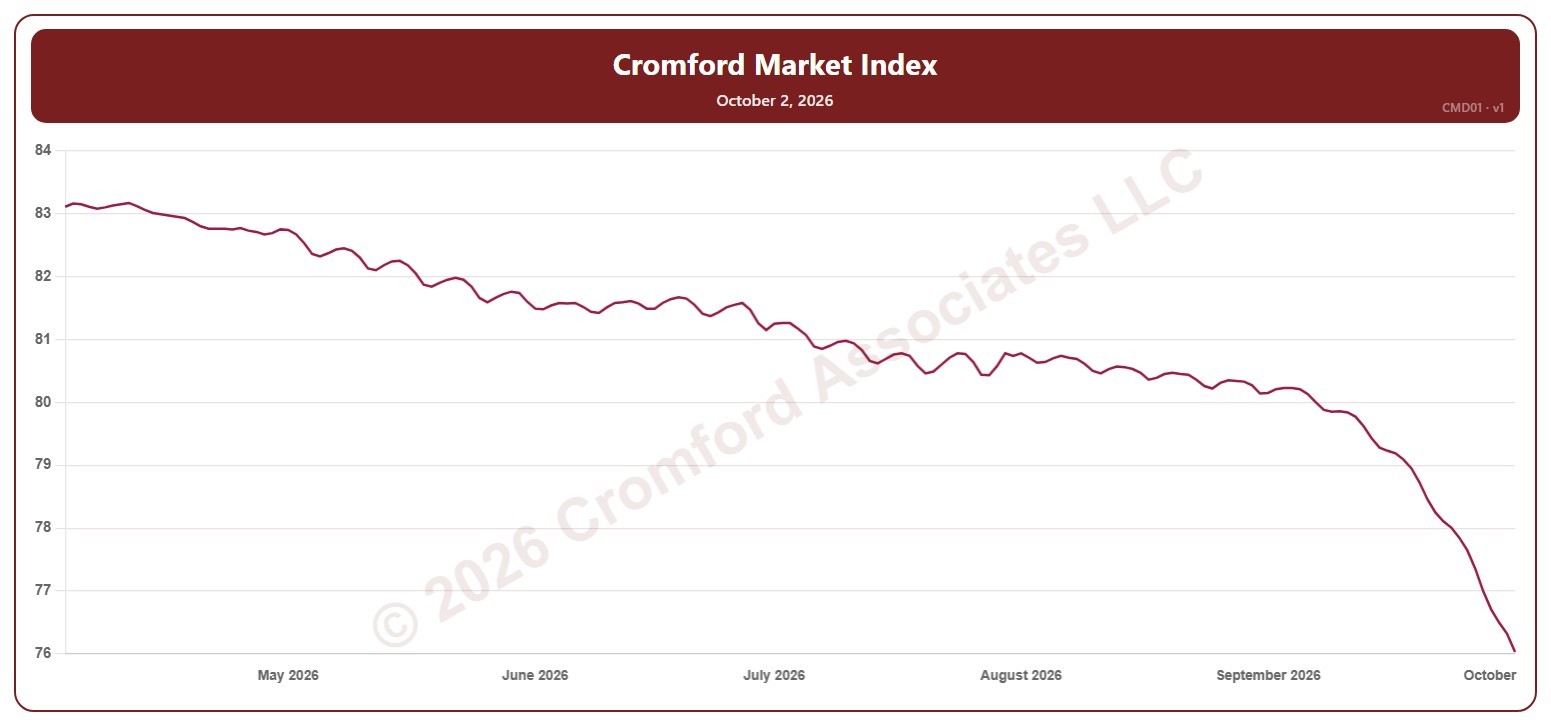
This chart shows the Cromford® Market Index for the whole ARMLS market, all areas and all dwelling types, every day over the last six months. A reading below 90 indicates a buyer’s market, above 110 a seller’s market, and between 90 and 110 a balanced market.

Hover over the line to see the exact figure for that day.

Active Listings (including UCB & CCBS) – Monthly

About this chart

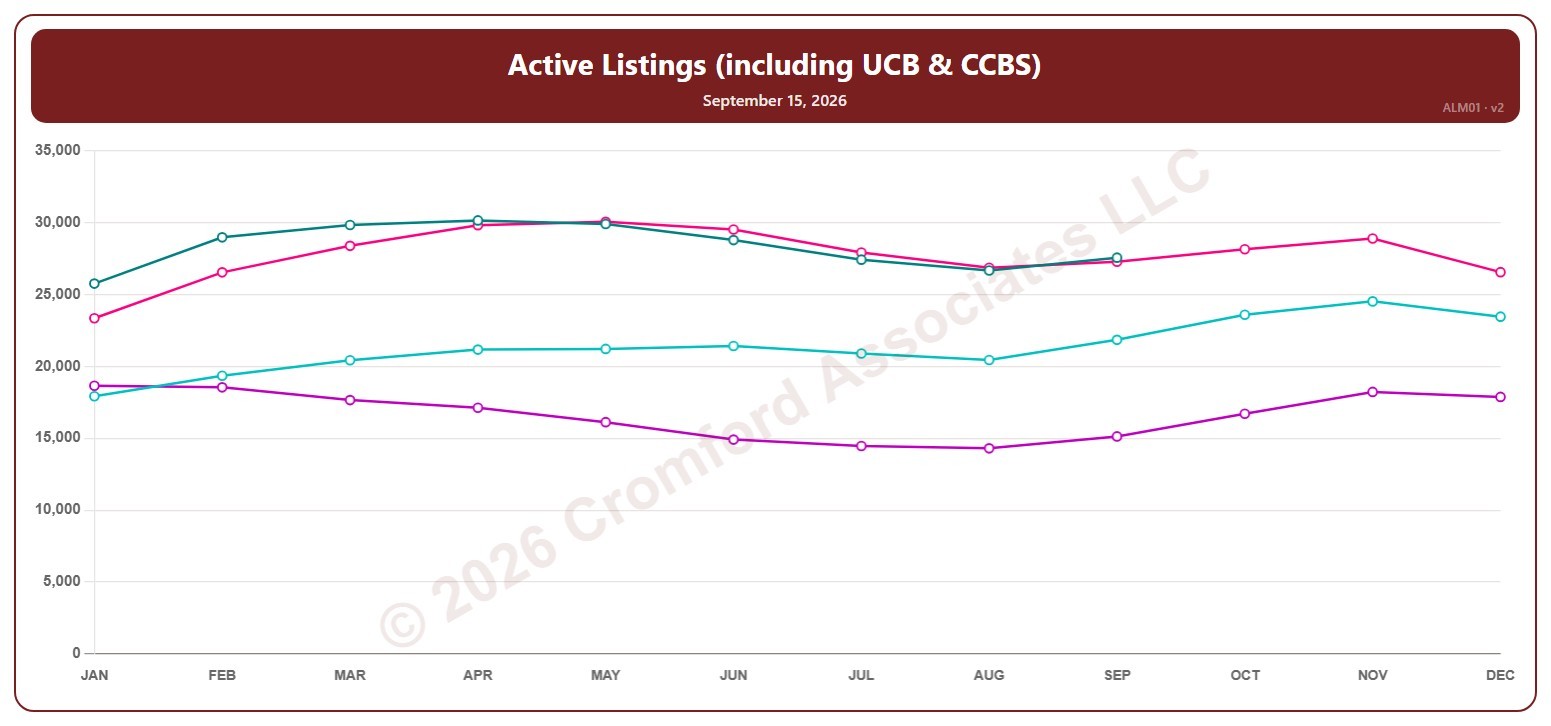
This chart shows the number of active listings, including UCB / CCBS listings (under contract but still marked active), for the whole ARMLS market, all areas and all dwelling types, read on the 15th of each month. Rising inventory gives buyers more choice; falling inventory favors sellers.

Each year has its own line, laid out by month, so you can compare this year with earlier years at the same point in the season. It opens on the last four years; tick any year back to 2001 in the Year panel.

Hover over a line to see the exact figure for that month.

Active Listings (excluding UCB & CCBS) – Long Term

About this chart

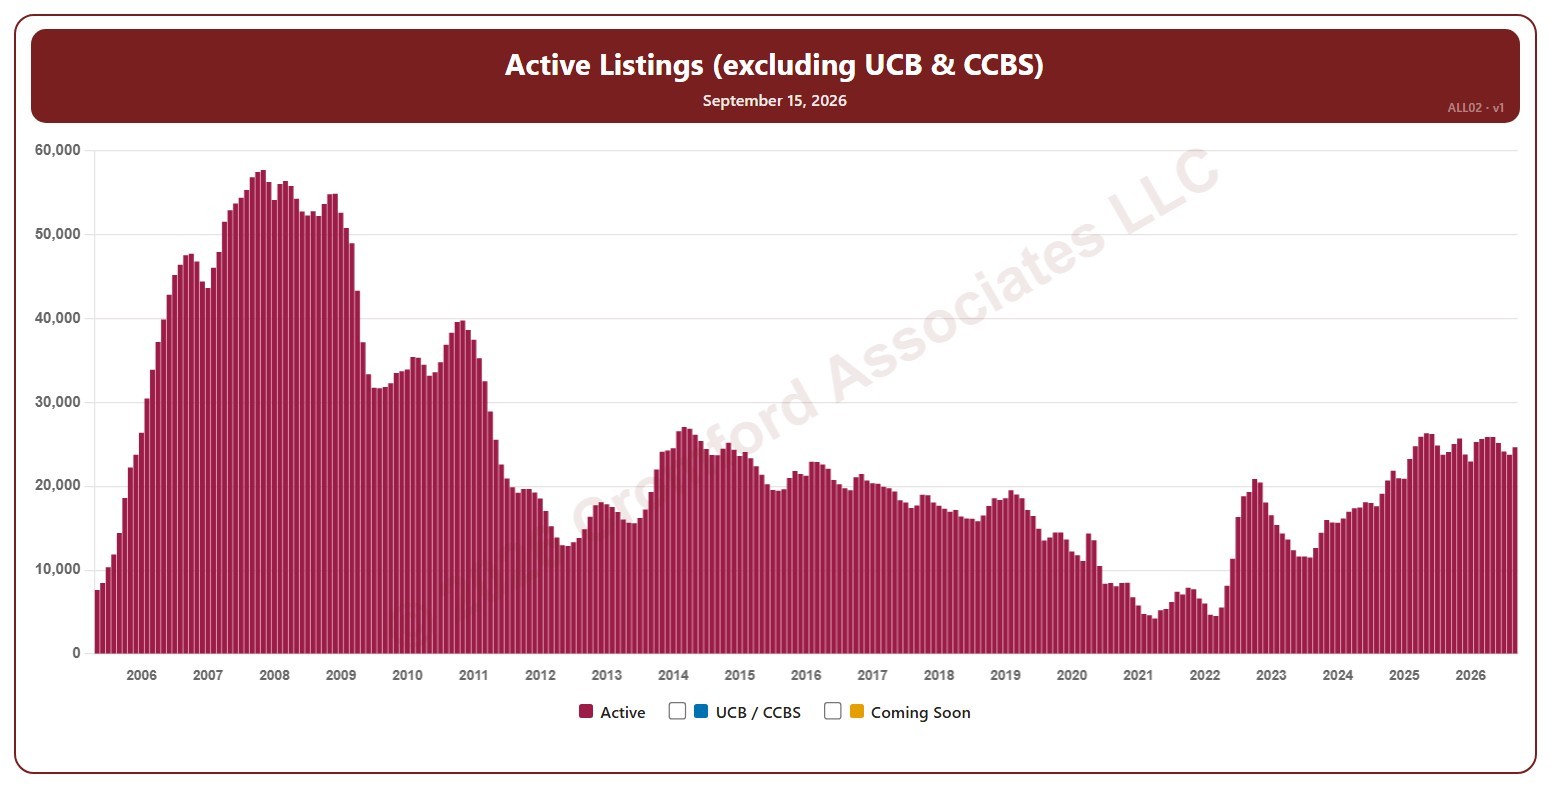
This chart shows the number of active listings, not counting UCB / CCBS listings (under contract but still marked active), for the whole ARMLS market, all areas and all dwelling types, as one bar per month since May 2005, when the two were first counted separately. Each bar is the reading on the 15th of the month. Rising inventory gives buyers more choice; falling inventory favors sellers.

Tick UCB / CCBS to stack those listings on top, or Coming Soon to add homes about to go active.

Hover over a bar to see the exact figure for that month.

Active Listings (including UCB & CCBS) – Long Term

About this chart

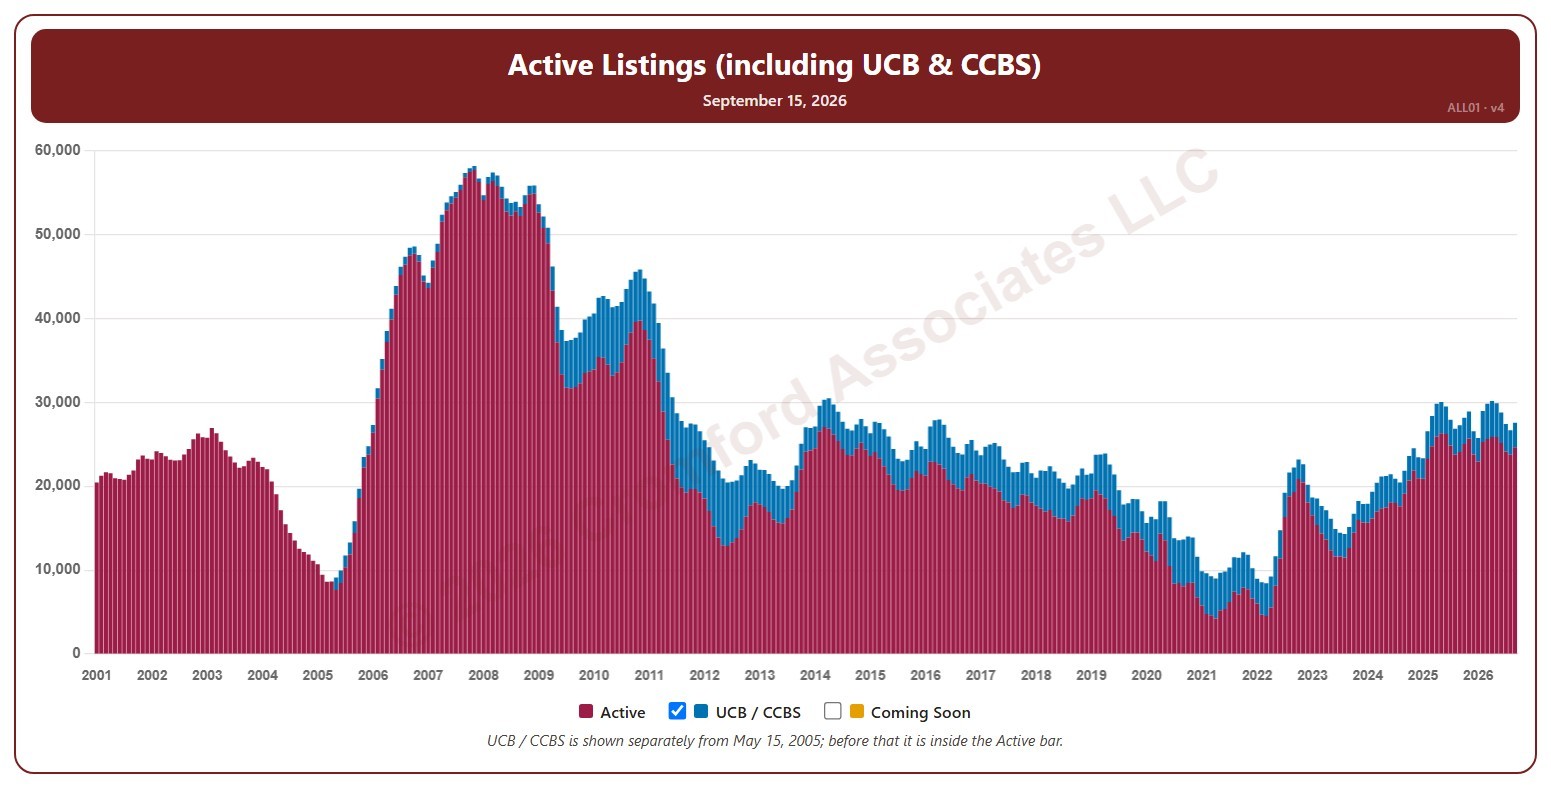
This chart shows the number of active listings, for the whole ARMLS market, all areas and all dwelling types, as one bar per month since January 2001. Each bar is the reading on the 15th of the month, stacked to show Active listings and UCB / CCBS listings (under contract but still marked active). Rising inventory gives buyers more choice; falling inventory favors sellers.

Untick UCB / CCBS to show Active listings alone, or tick Coming Soon to add homes about to go active.

Hover over a bar to see the exact figure for that month.

Active Listings (including UCB & CCBS) – Weekly

About this chart

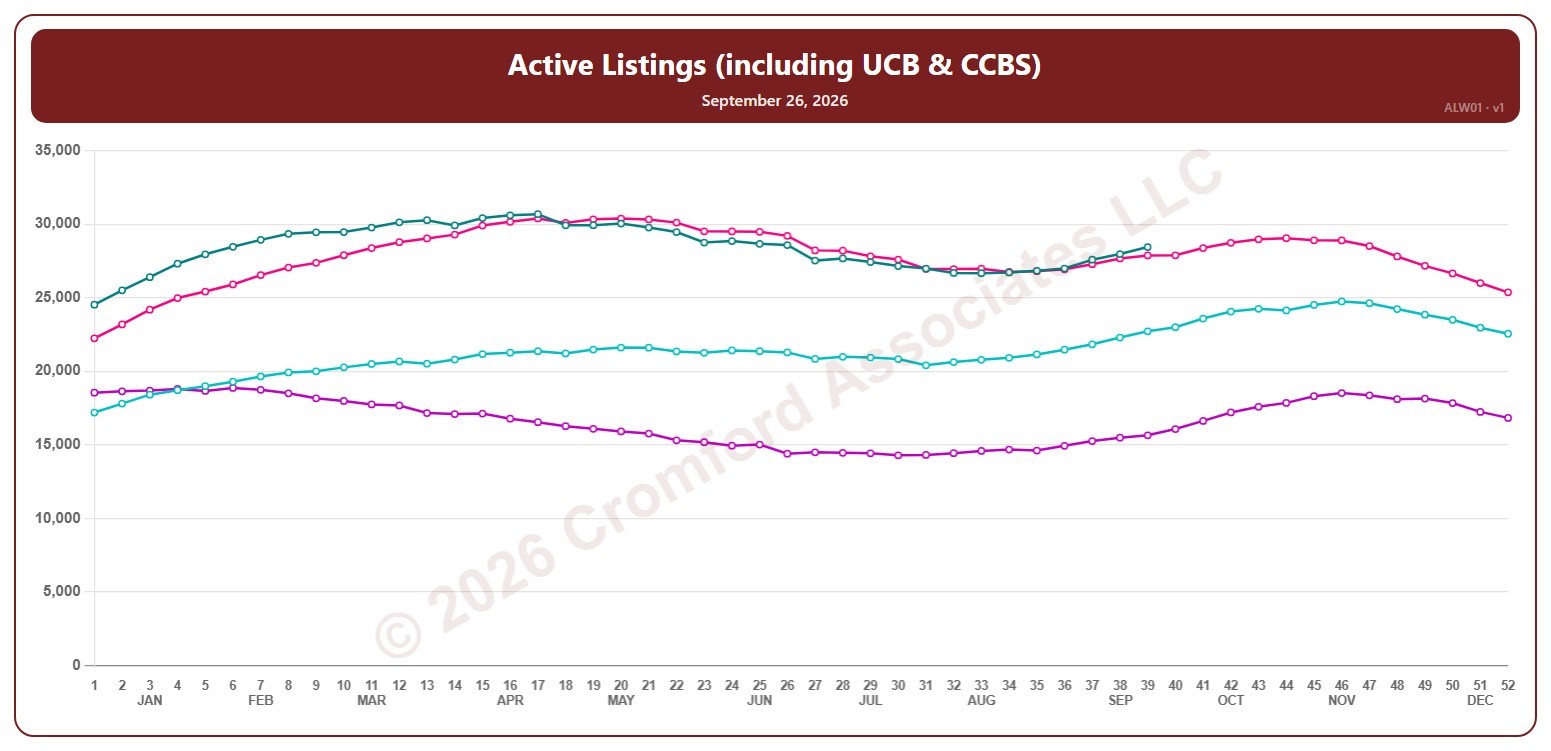
This chart shows the number of active listings, including UCB / CCBS listings (under contract but still marked active), for the whole ARMLS market, all areas and all dwelling types, counted every Saturday. Rising inventory gives buyers more choice; falling inventory favors sellers.

Each year has its own line, laid out by week of the year (each Saturday), so you can compare this year with earlier years at the same point in the season. It opens on the last four years; tick any year back to 2001 in the Year panel.

Hover over a line to see the exact figure for that week.

Active Listings (excluding UCB & CCBS) – Weekly

About this chart

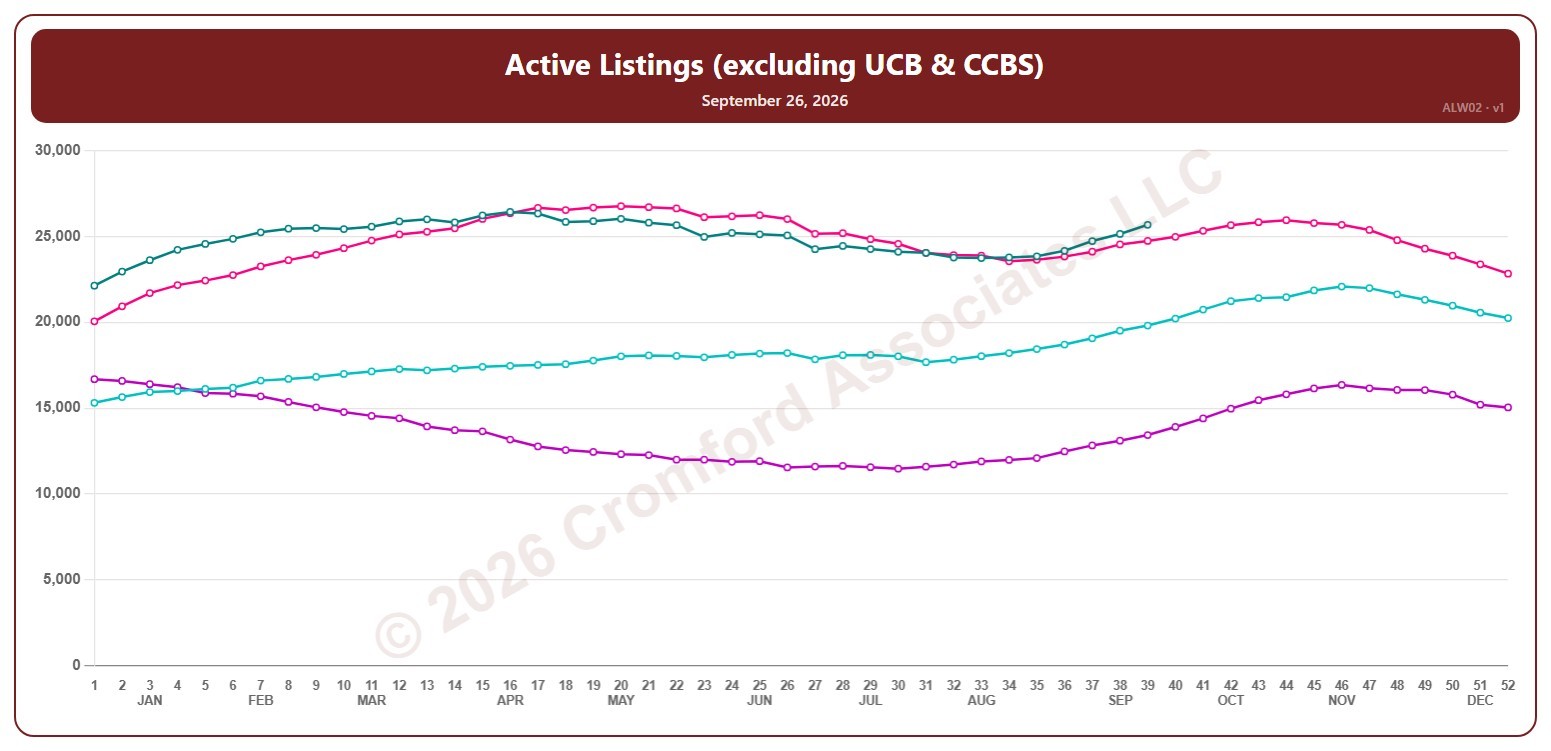
This chart shows the number of active listings, not counting UCB / CCBS listings (under contract but still marked active), for the whole ARMLS market, all areas and all dwelling types, counted every Saturday. Rising inventory gives buyers more choice; falling inventory favors sellers.

Each year has its own line, laid out by week of the year (each Saturday), so you can compare this year with earlier years at the same point in the season. It opens on the last four years; tick any year back to 2005 in the Year panel.

Hover over a line to see the exact figure for that week.

Active Listings (excluding UCB & CCBS) by City – Weekly

About this chart

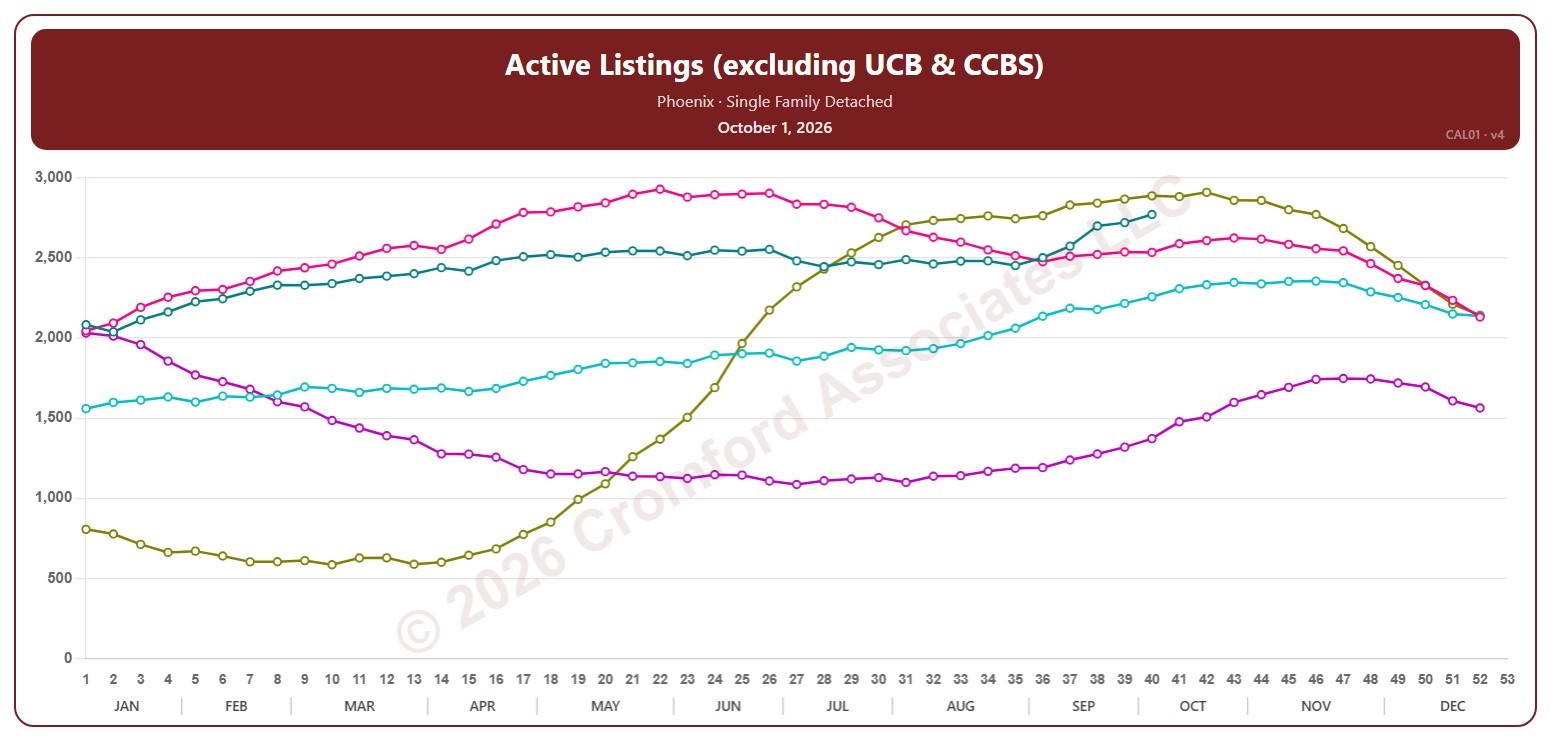
This chart counts the active listings for single-family detached homes on ARMLS in one city, measured every week on Thursdays. It leaves out UCB / CCBS listings, which are under contract but still marked active.

Each year has its own line, laid out by week of the year, so you can compare this year with earlier years at the same point in the season. It opens on Phoenix and the last five years. Pick any of the 34 cities (18 major and 16 secondary) from the City list, and tick any year back to 2006 in the Year panel. Queen Creek and San Tan Valley start in 2010, and Coolidge, Florence, Waddell, and Wickenburg in 2011.

Hover over a line to see the exact figure for that week.