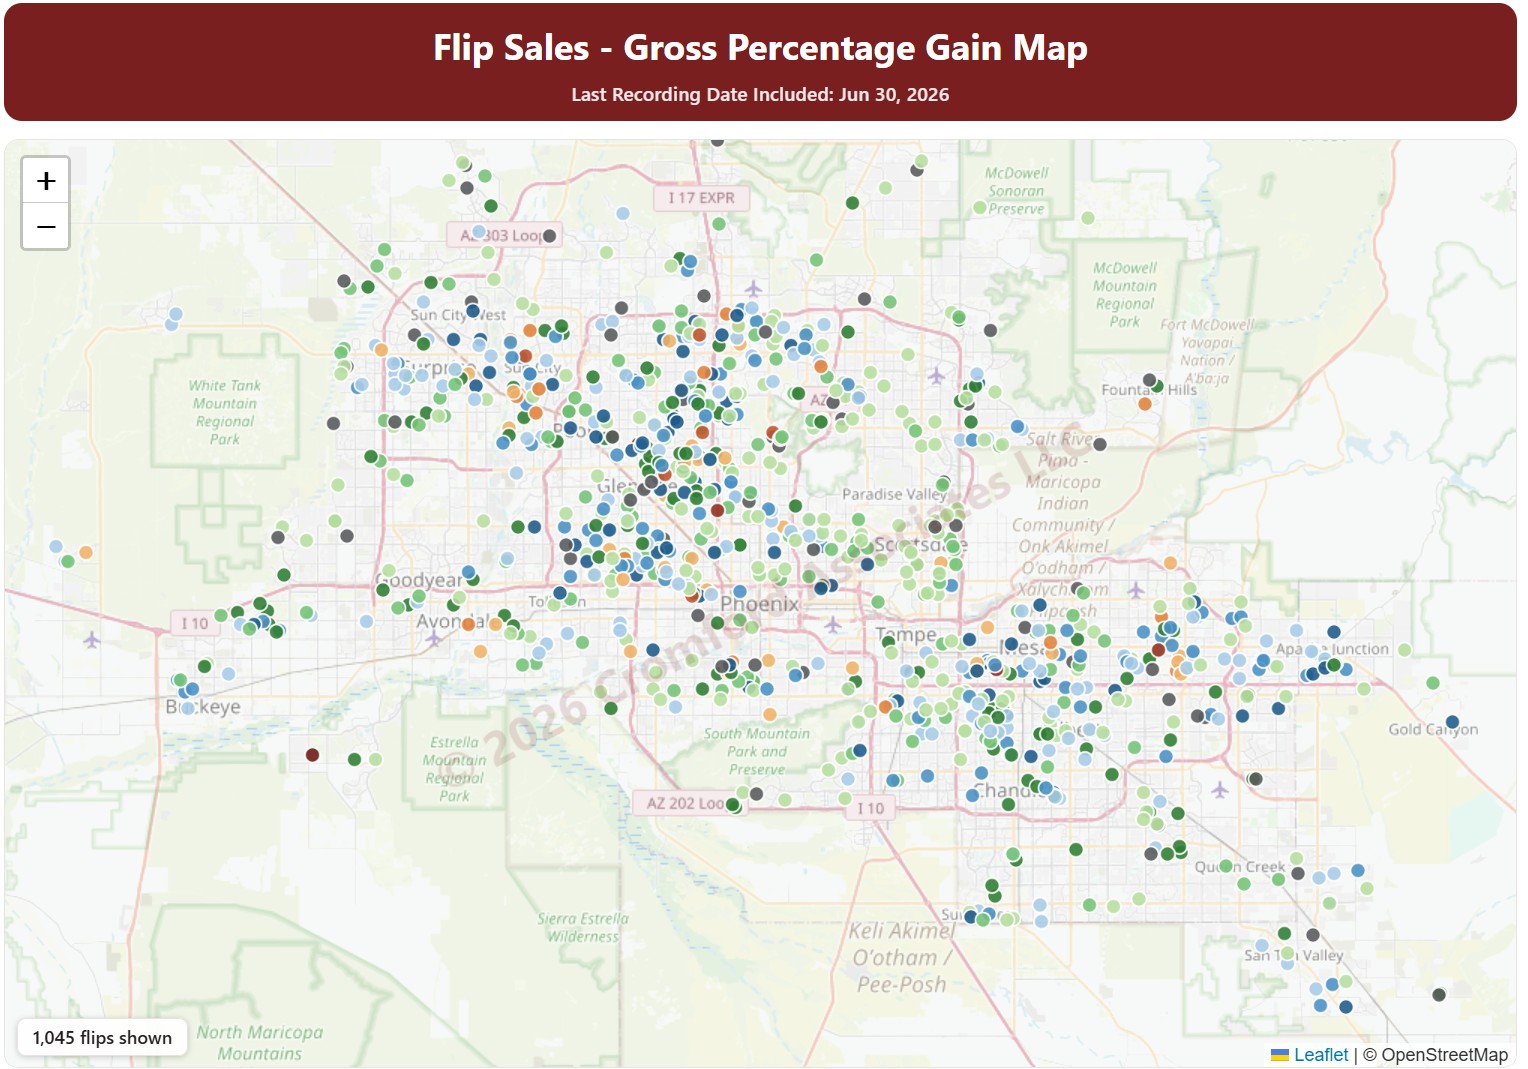
Flip Sales – Gross Percentage Gain Map

About this chart

This map shows fix-and-flip resales in Maricopa and Pinal Counties: homes bought, usually renovated, and resold by an investor. Each dot is one flip, colored by the gross percentage gain between the purchase price and the resale price.

Purchases by Opendoor and OfferPad are left out by default; tick them under Buyers to include them. Use the County, City, and ZIP Code panels and the Property Type, hold days, profit, and sales price filters to narrow the flips shown.

The Last Month, Last 3 Months, Last 6 Months, and Full range buttons, and the arrows, set the dates covered.
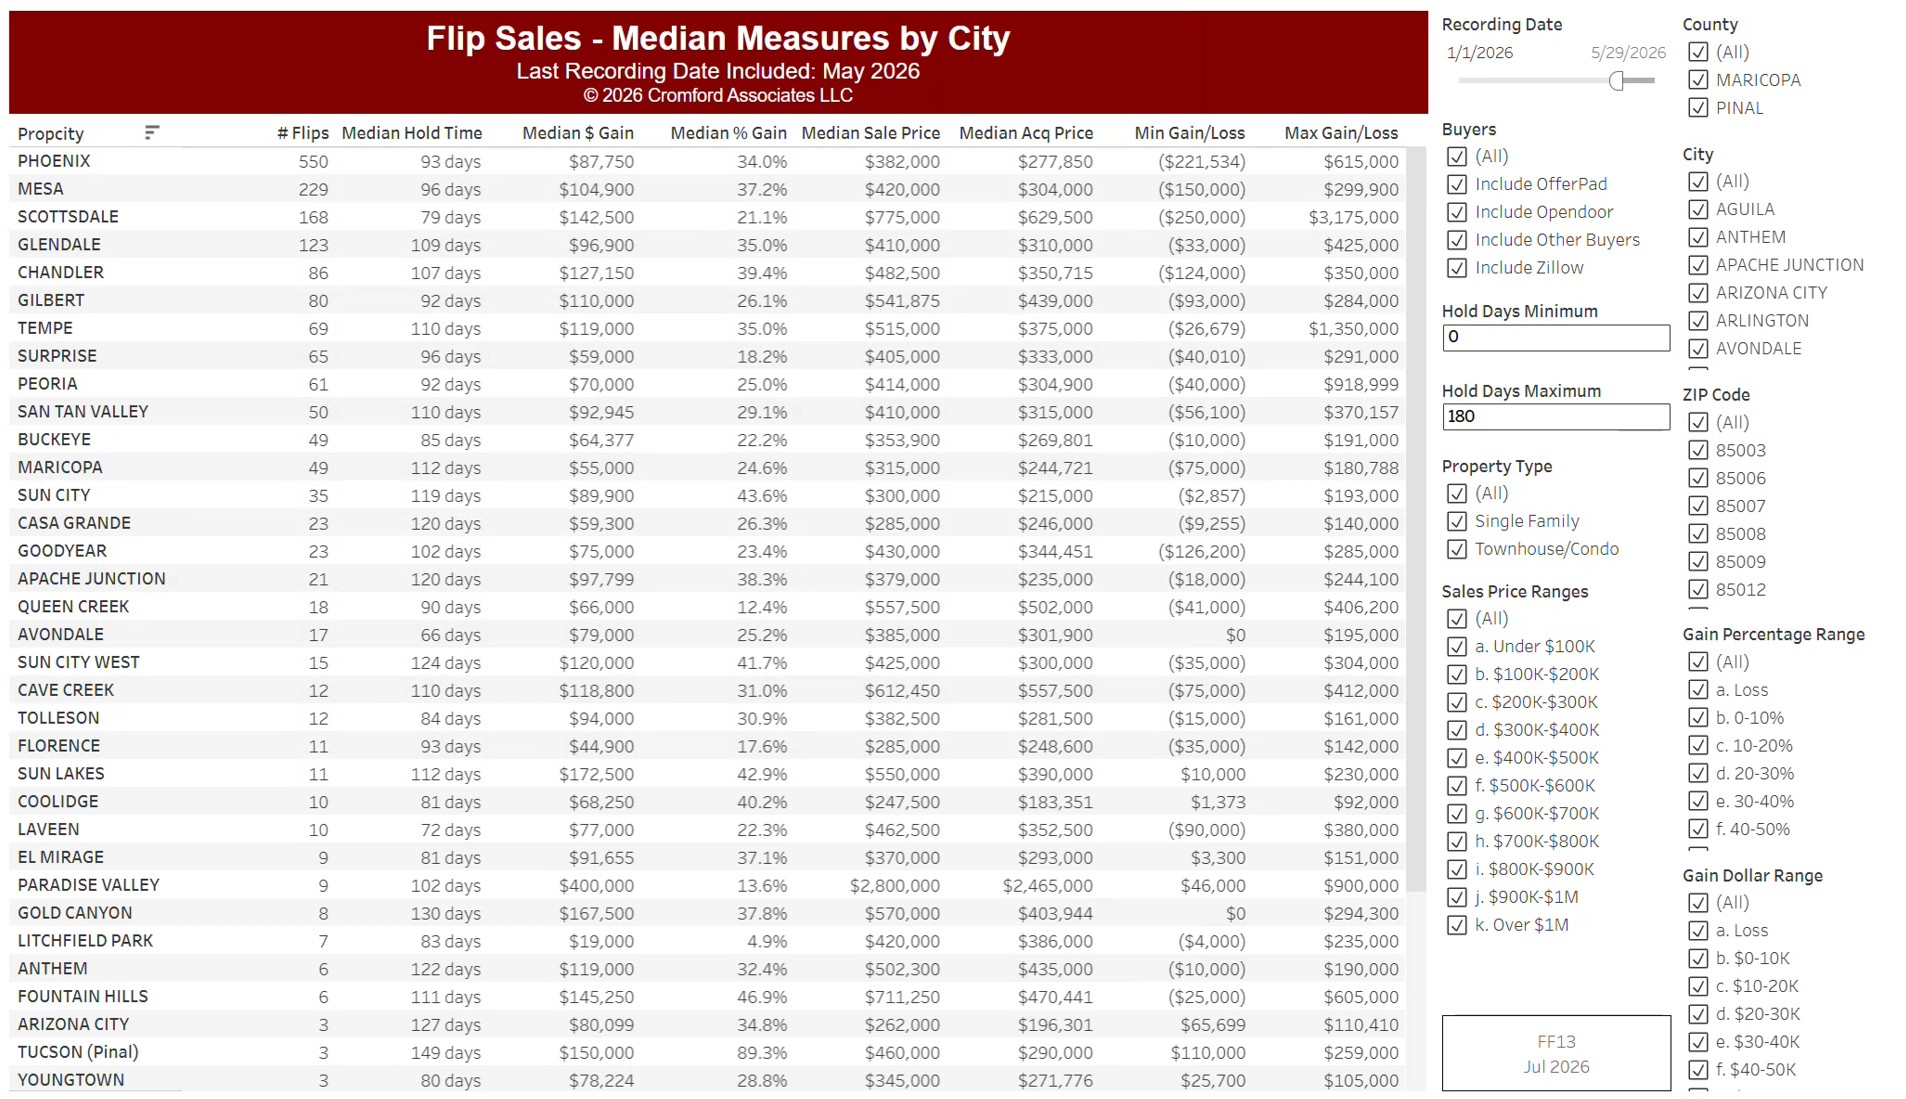
Flip Sales – Median Measures by City

About this chart

This table compares fix-and-flip sales by city, from residential deeds recorded by Maricopa and Pinal Counties: homes bought and resold by an investor. Each row is a city, with the number of flips, the median hold time in days, the median gross profit in dollars and as a percentage, the median sale and purchase prices, and the smallest and largest gross profit.

It opens on the months recorded so far this year; use the Recording Month slider to choose the period. It is sorted by the number of flips. Narrow it with the County, City, and ZIP panels, the Buyers and Property Type boxes, and the sale price, hold days, gross profit, and gross profit % sliders.

Gross profit is the difference between the purchase and resale prices, before renovation and selling costs.