
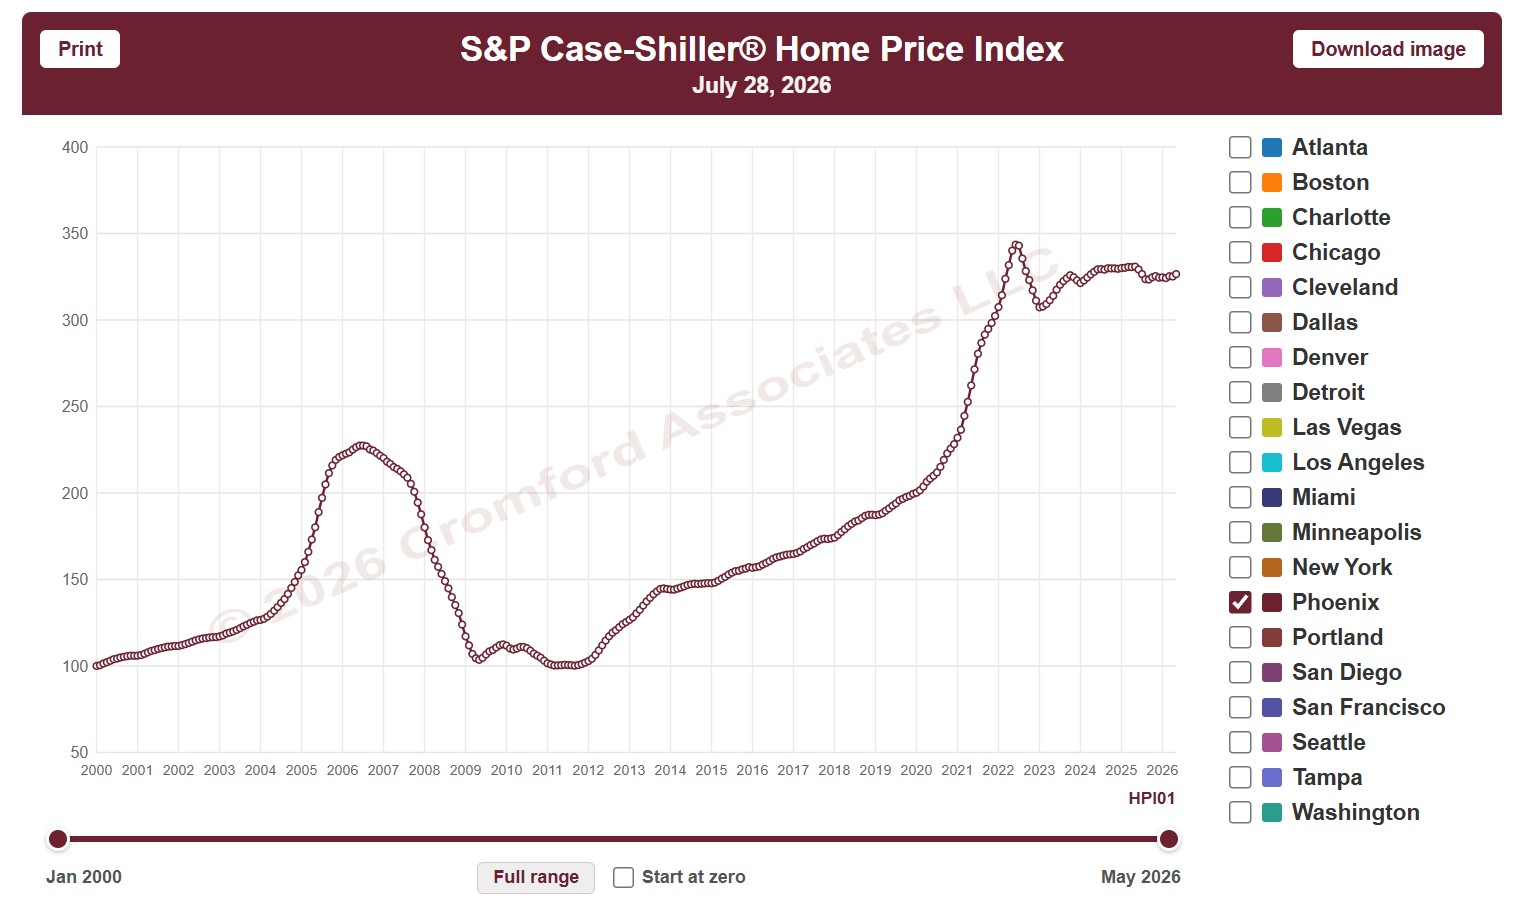
About this chart
This chart shows the S&P Cotality Case-Shiller Home Price Index, which tracks the prices of the same homes as they resell, so it measures price change without being skewed by the mix of homes that sold. It opens on Phoenix; tick any of the other 19 metro areas to compare them.
The CPI option switches between nominal prices and real prices adjusted for US or Phoenix inflation, and Start at zero sets the axis to begin at zero. Use the date slider, or Full range, to choose the stretch of history shown.
The index is published monthly, about two months in arrears. Hover over the chart to see the figures for that month.