Pending Listings by ZIP Code – Monthly

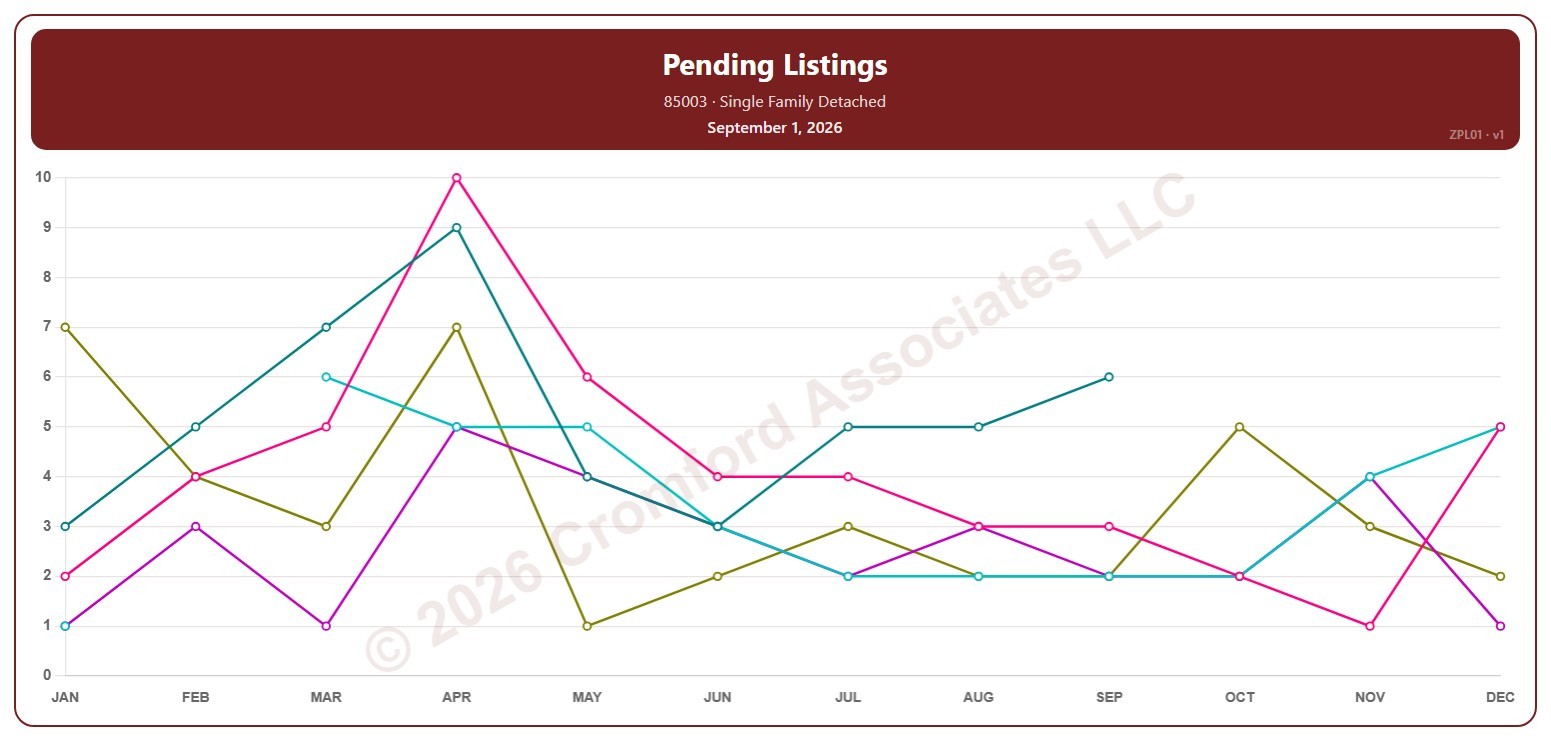
About this chart

This chart counts the Pending listings for single-family detached homes on ARMLS in one ZIP code: homes under contract that have not yet closed. Each point is the reading on the 1st of the month.

Each year has its own line, laid out by month, so you can compare this year with earlier years at the same point in the season. Pick any of 149 ZIP codes from the ZIP Code list (it opens on 85003); the last three years are ticked to start with, and you can tick any year back to 2005.

Hover over a line to see the exact figure for that month.
Sales per Year by ZIP Code – Monthly

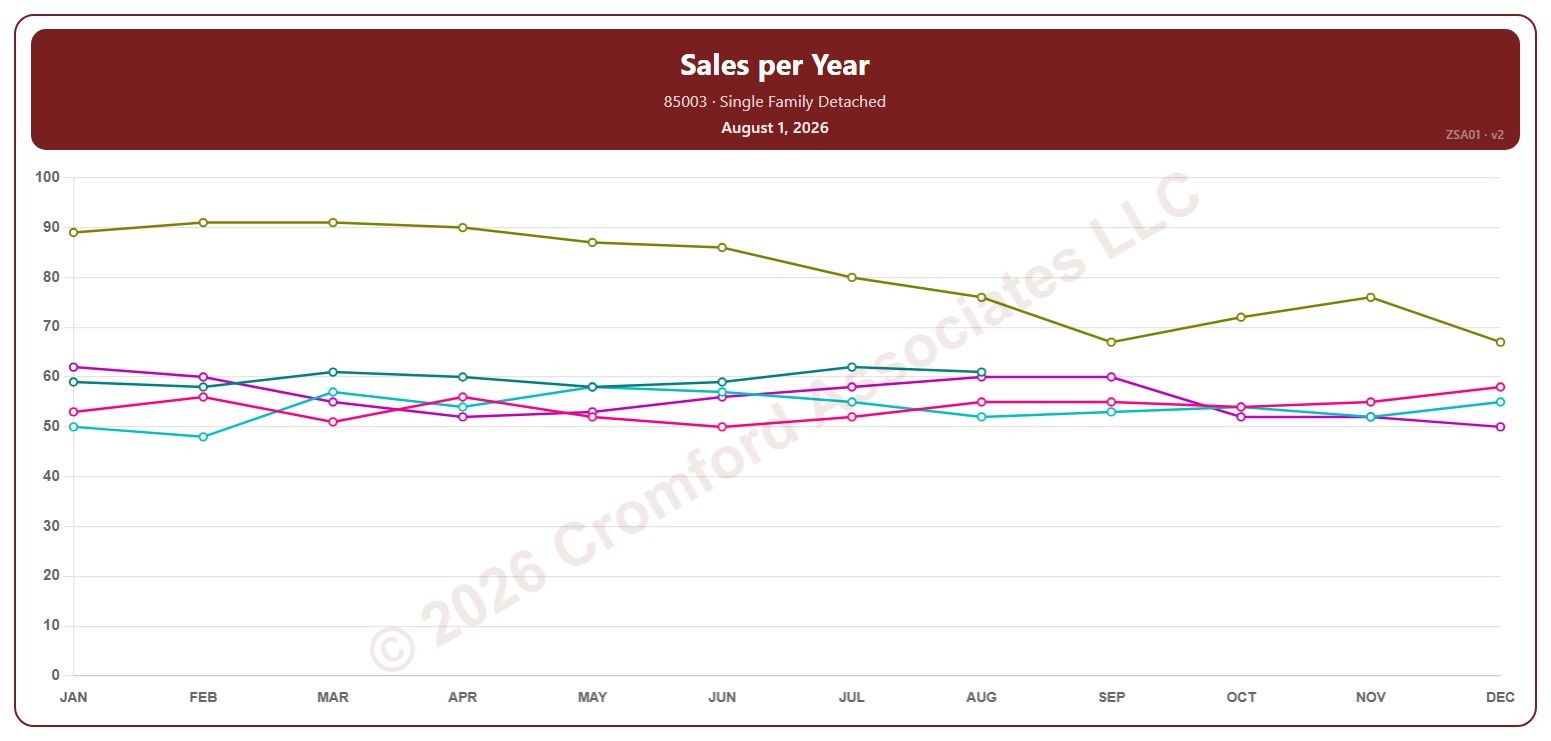
About this chart

This chart counts the single-family detached homes that closed through ARMLS in one ZIP code over 12 months. Each point covers the 12 months ending with the month it sits at, so the point at August covers September 1 of the year before to August 31; the newest point is the last month that has finished.

Each year has its own line, laid out by month, so you can compare this year with earlier years at the same point in the season. Pick any of 149 ZIP codes from the ZIP Code list (it opens on 85003); the last three years are ticked to start with, and you can tick any year back to 2001.

Hover over a line to see the exact figure for that month.
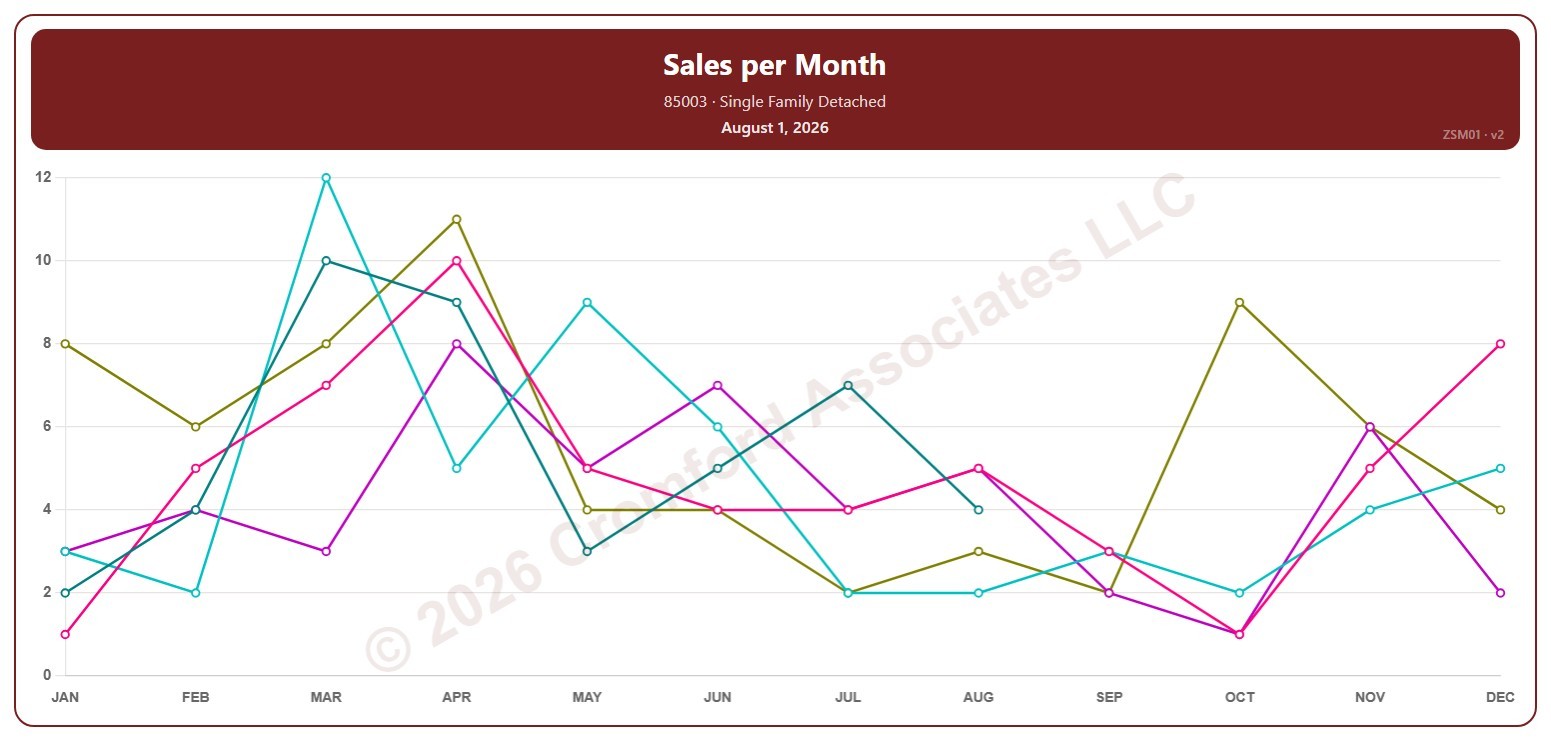
Sales per Month by ZIP Code – Monthly

About this chart

This chart counts the single-family detached homes that closed through ARMLS in one ZIP code each month. Each point covers the closings in that calendar month, so the point at August covers August 1 to 31; the newest point is the last month that has finished.

Each year has its own line, laid out by month, so you can compare this year with earlier years at the same point in the season. Pick any of 149 ZIP codes from the ZIP Code list (it opens on 85003); the last three years are ticked to start with, and you can tick any year back to 2001.

Hover over a line to see the exact figure for that month.
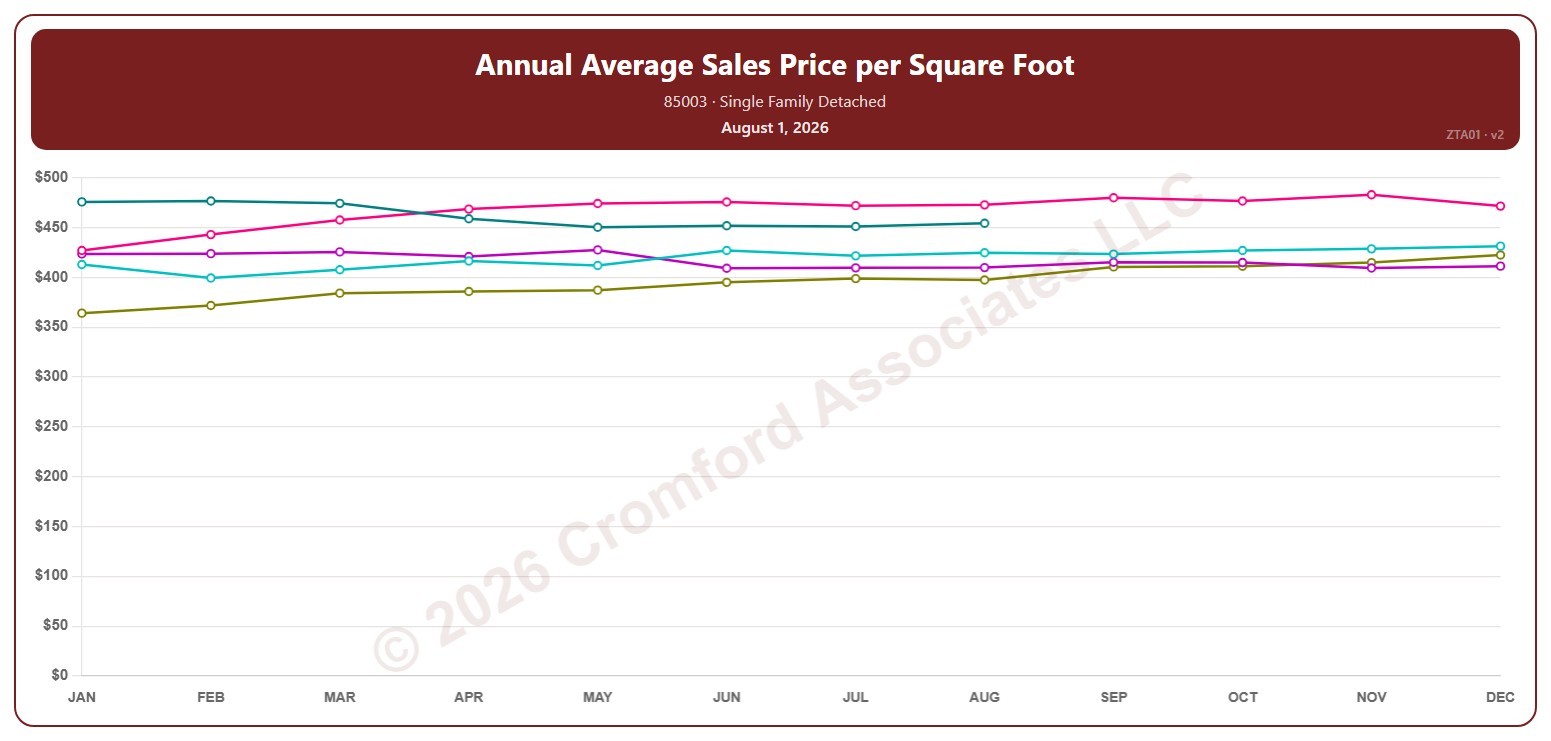
Annual Average Sales Price per Square Foot by ZIP Code – Monthly

About this chart

This chart shows the average sales price per square foot of single-family detached homes that closed through ARMLS in one ZIP code over 12 months. Each point covers the 12 months ending with the month it sits at, so the point at August covers September 1 of the year before to August 31; the newest point is the last month that has finished. Price per square foot lets you compare homes of different sizes.

Each year has its own line, laid out by month, so you can compare this year with earlier years at the same point in the season. Pick any of 149 ZIP codes from the ZIP Code list (it opens on 85003); the last three years are ticked to start with, and you can tick any year back to 2001.

Hover over a line to see the exact figure for that month.
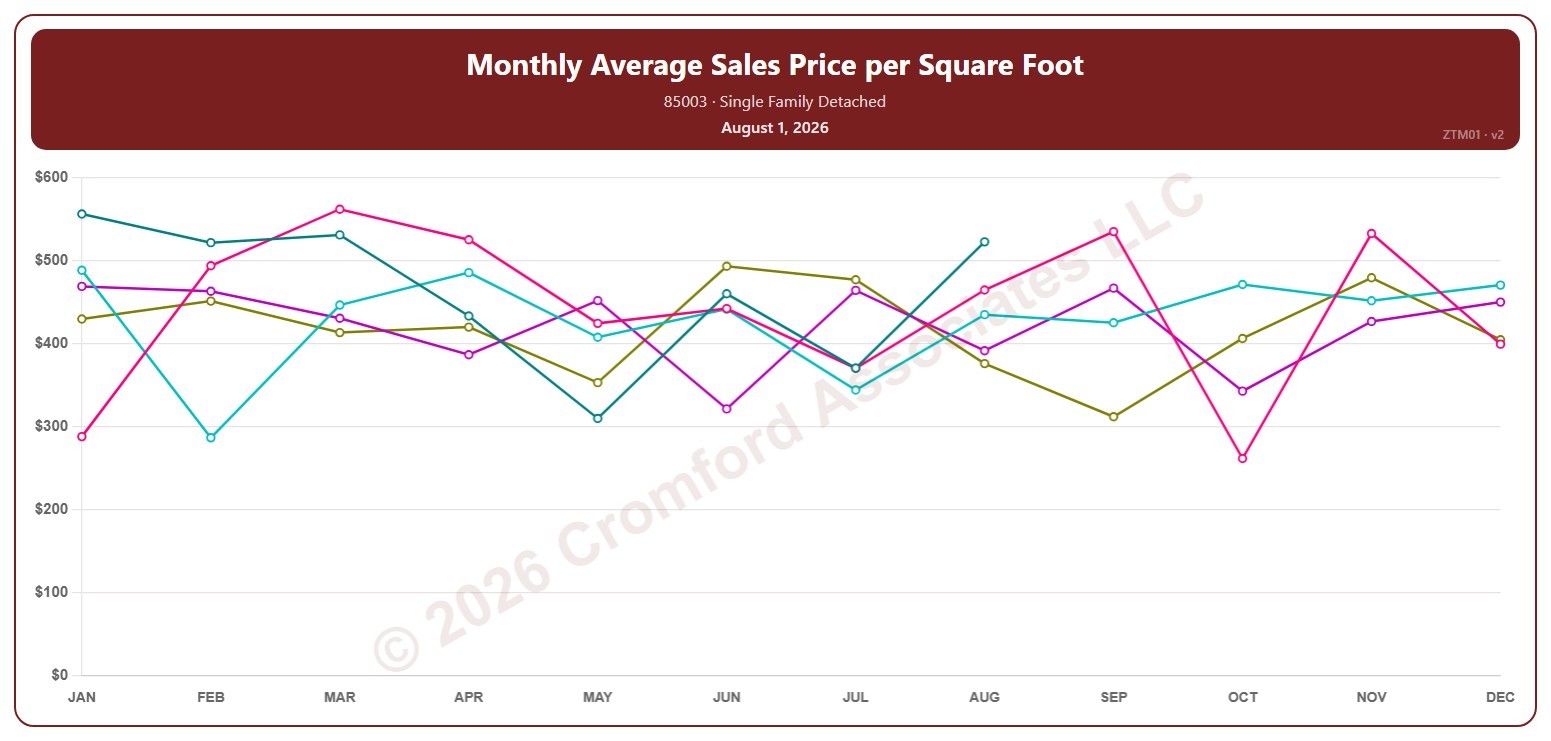
Monthly Average Sales Price per Square Foot by ZIP Code – Monthly

About this chart

This chart shows the average sales price per square foot of single-family detached homes that closed through ARMLS in one ZIP code, month by month. Each point covers the closings in that calendar month, so the point at August covers August 1 to 31; the newest point is the last month that has finished. Price per square foot lets you compare homes of different sizes.

Each year has its own line, laid out by month, so you can compare this year with earlier years at the same point in the season. Pick any of 149 ZIP codes from the ZIP Code list (it opens on 85003); the last three years are ticked to start with, and you can tick any year back to 2001.

Hover over a line to see the exact figure for that month.
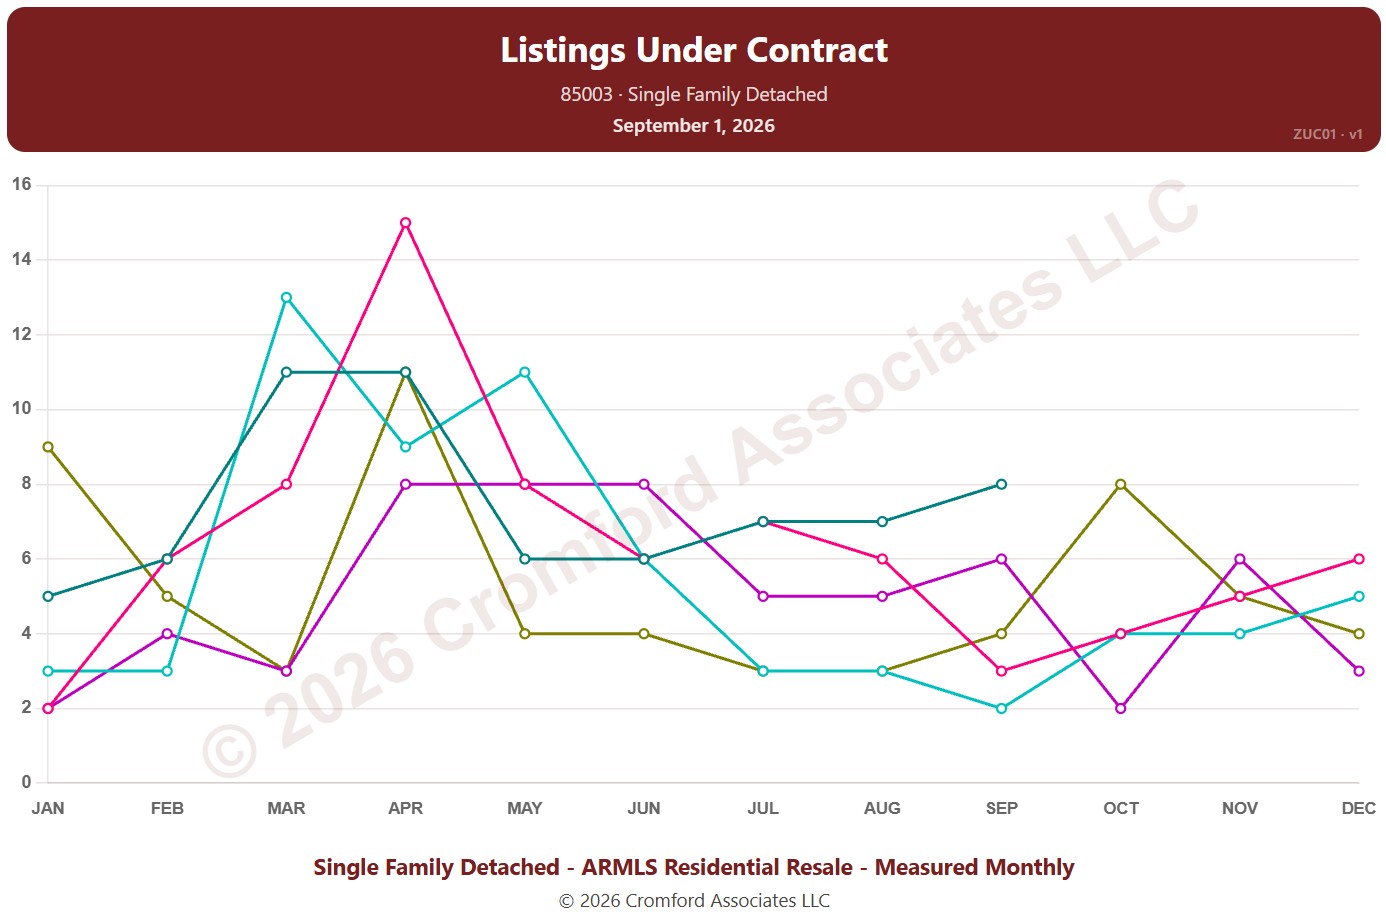
Listings Under Contract by ZIP Code – Monthly

About this chart

This chart counts the listings under contract for single-family detached homes on ARMLS in one ZIP code: Pending listings plus UCB / CCBS listings. Each point is the reading on the 1st of the month. It shows how much buying activity is under way.

Each year has its own line, laid out by month, so you can compare this year with earlier years at the same point in the season. Pick any of 149 ZIP codes from the ZIP Code list (it opens on 85003); the last three years are ticked to start with, and you can tick any year back to 2011.

Hover over a line to see the exact figure for that month.
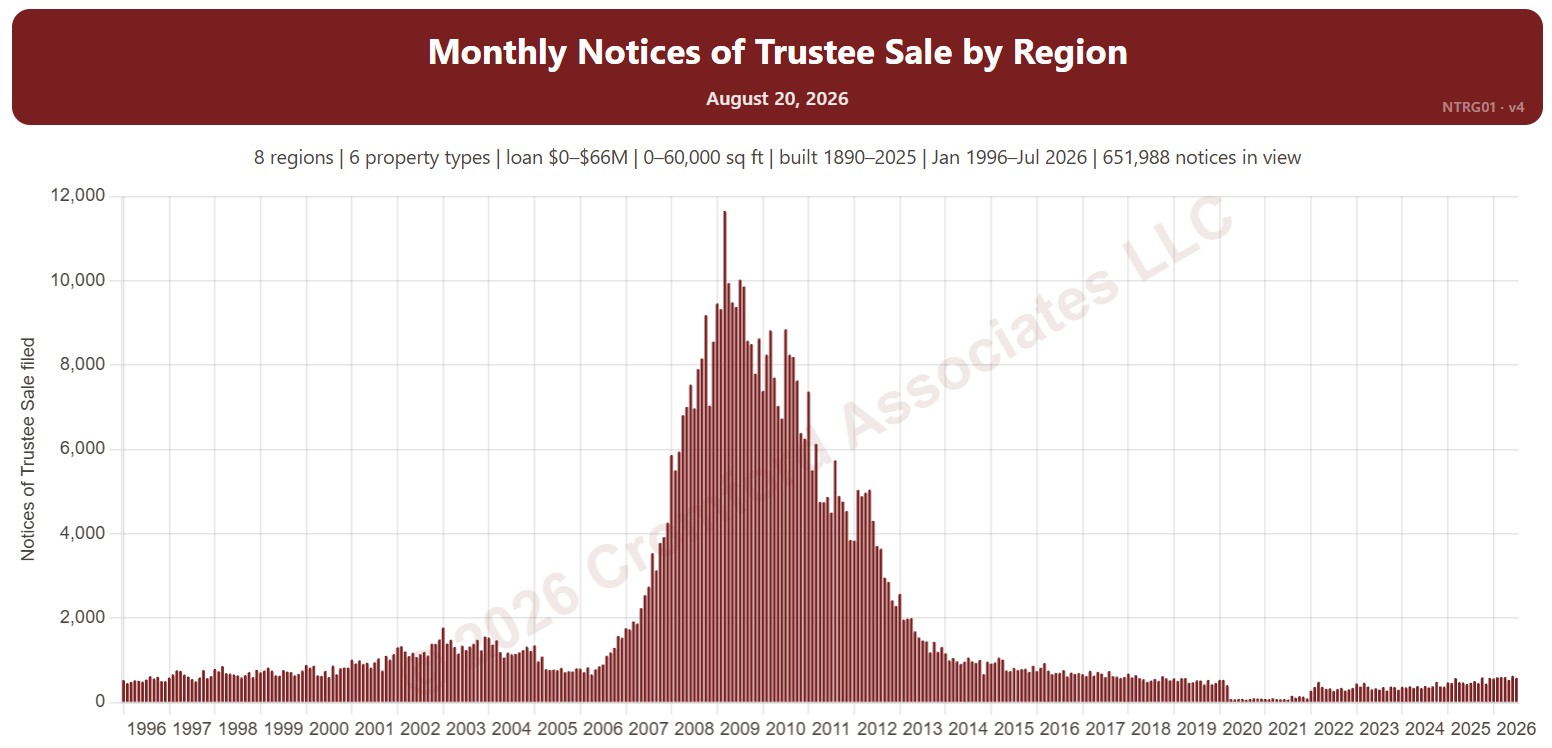
Monthly Trustee’s Deeds by Region

About this chart

This chart counts the Trustee’s Deeds recorded each month: the deed recorded after a foreclosure auction. Each bar is split by what happened at the auction: the home reverted to the lender (beneficiary), sold to a third party, or the outcome was not recorded.

Records run from 2002. Vacant land and commercial property are left out by default.

Use the Region panel to focus on one region or a combination of them. Narrow it with the Outcome and Property Type boxes and the sale price, loan amount, home size, and year built sliders. Use the date slider, or Full range, to choose the stretch of history shown.

Hover over a bar to see the counts for that month.

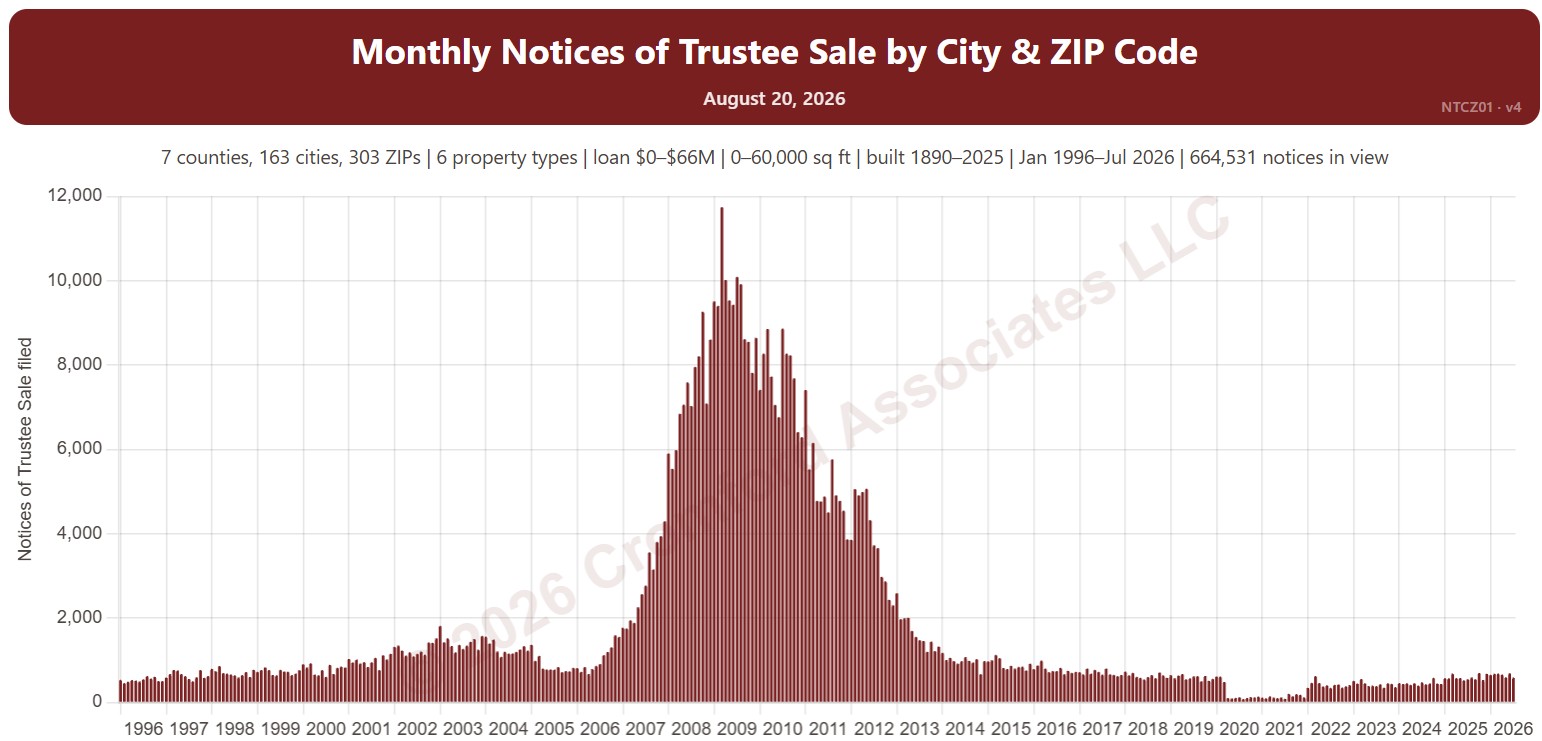
Monthly Notices of Trustee Sale – City Comparison

About this chart

This chart compares Notices of Trustee Sale between cities, one line per city, recorded each month. A notice is the document a lender records when it starts to foreclose on a home; many are later canceled, so it is an early sign of distress rather than a count of foreclosures. The lines show a 12-month average to smooth out month-to-month swings.

It opens on Phoenix, Mesa, Glendale, Scottsdale, Chandler, and Gilbert in Maricopa and Pinal Counties. Tick other cities under Cities to Compare, or add Cochise, Coconino, Mohave, Santa Cruz, or Yavapai Counties. Vacant land and commercial property are left out by default.

Narrow it with the Property Type box and the loan amount, home size, and year built sliders. Use the date slider, or Full range, to choose the stretch of history shown.

Hover over a line to see the figure for that month.

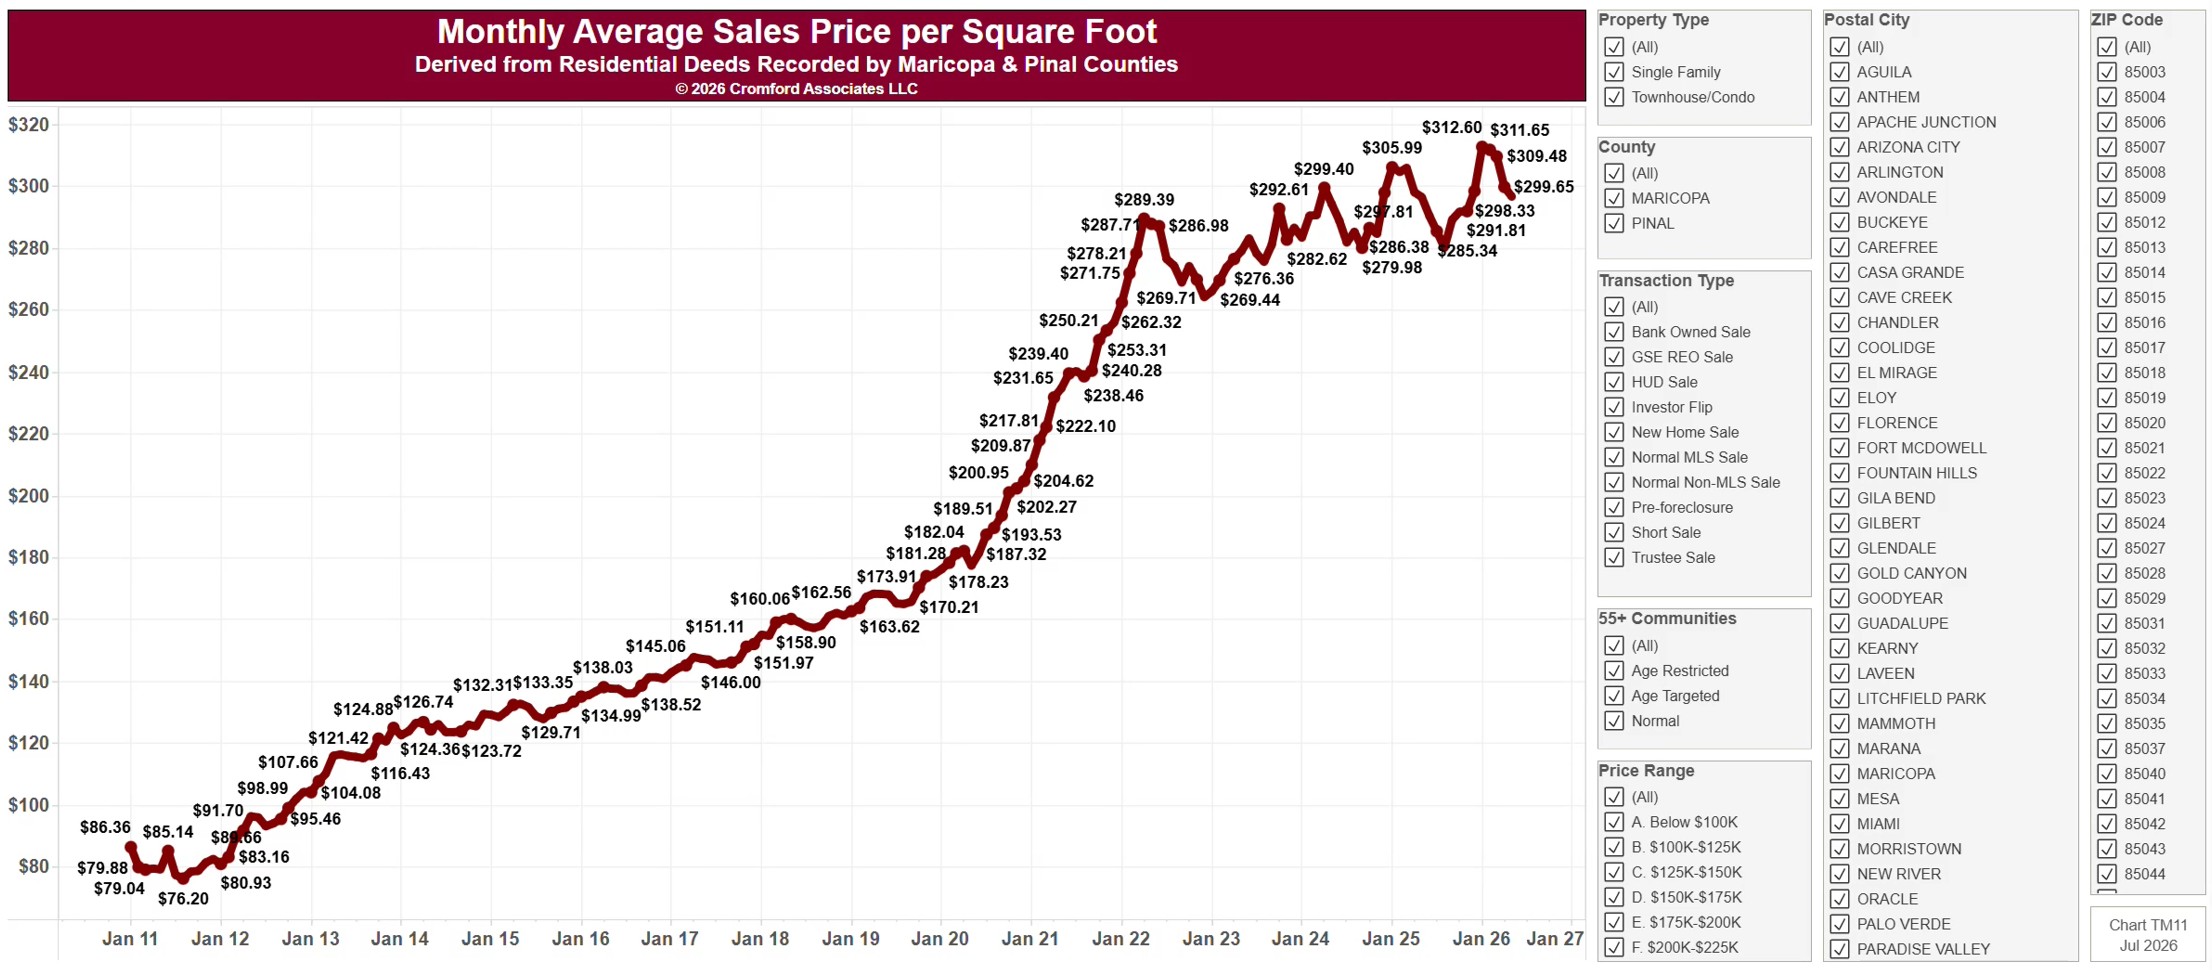
Monthly Average Sales Price per Square Foot

About this chart

This chart shows the average price per square foot of homes sold, one bar per calendar month since January 2011, from residential deeds recorded by Maricopa and Pinal Counties. It is the same series as TM11, drawn as bars. Price per square foot lets you compare homes of different sizes. Because it is built from recorded deeds, it covers every recorded sale, not just homes listed on ARMLS: new homes, private sales, and investor deals are all included.

It opens on Maricopa and Pinal Counties with everything included. Narrow it with the County, City, and ZIP panels, the Transaction Type, Property Type, and 55+ Communities boxes, and the sale price and home size sliders. Untick years in the Year panel to drop them from the chart.

The records run to the end of last month and are updated monthly. Hover over a bar to see the exact figure for that month.
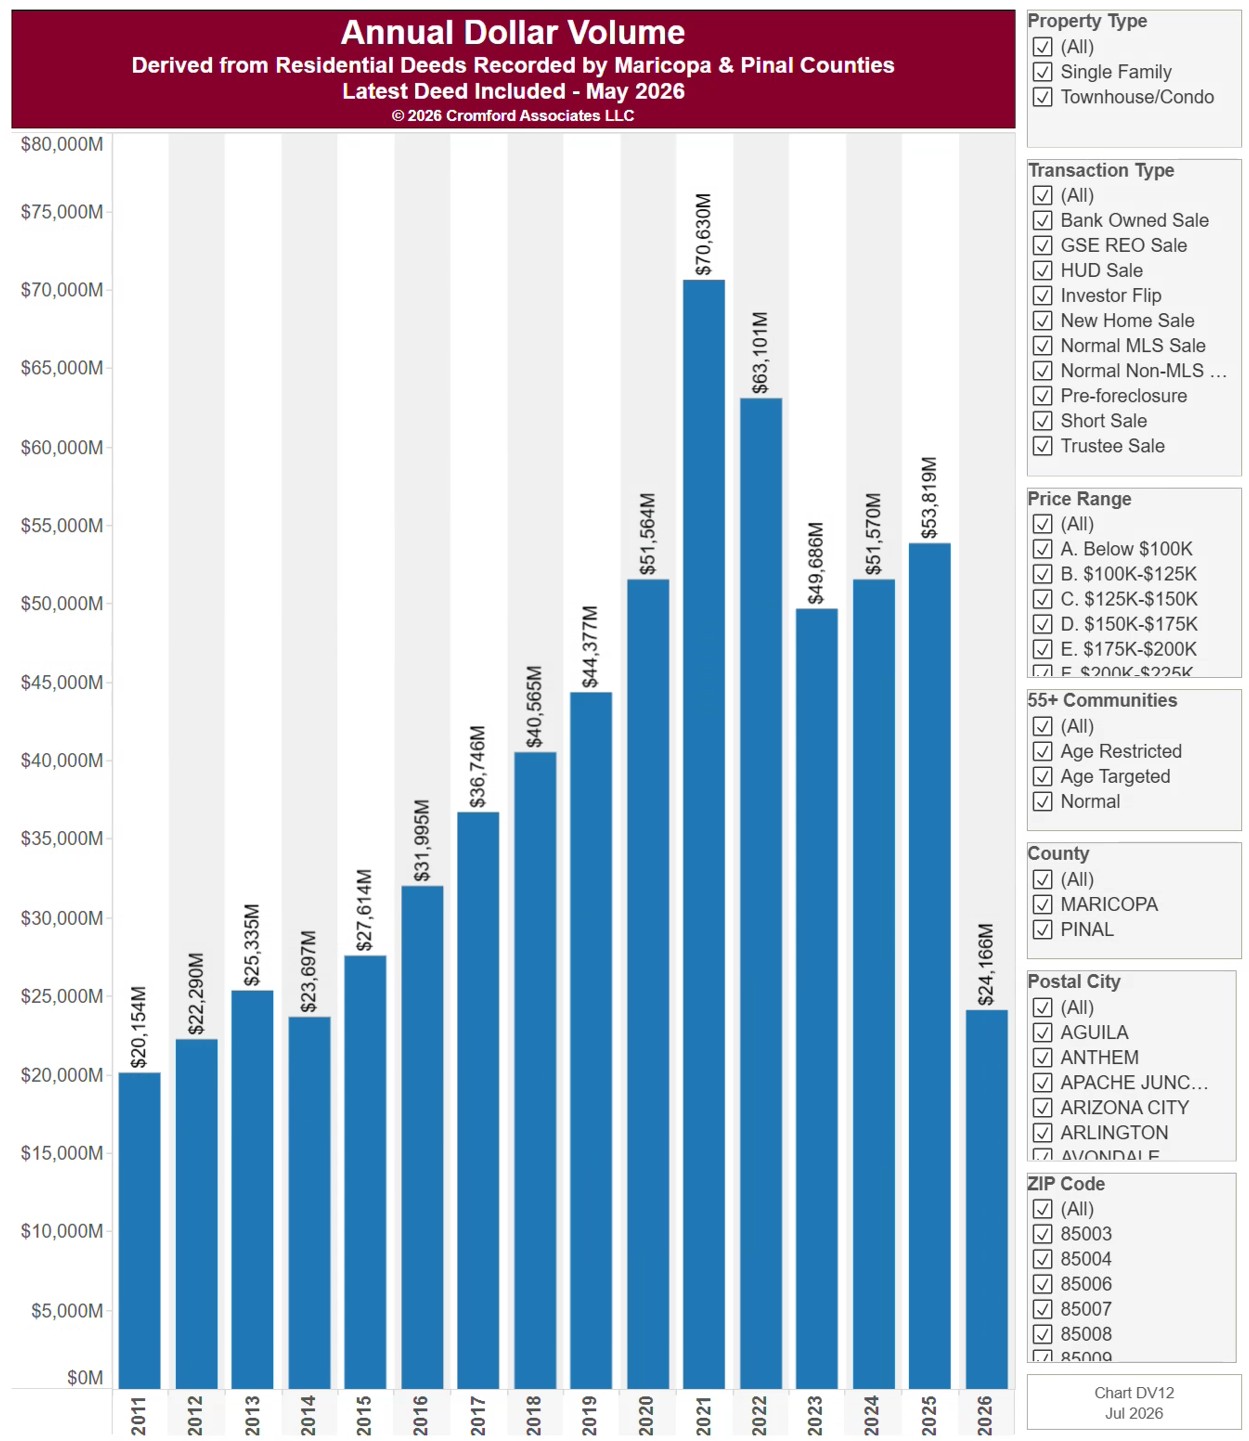
Year to Date Dollar Volume

About this chart

This chart shows dollar volume: the total value of the homes sold each year since 2011, from residential deeds recorded by Maricopa and Pinal Counties, with every year cut to the same months (January to the latest month recorded), so the current year can be compared fairly with earlier ones. Because it is built from recorded deeds, it covers every recorded sale, not just homes listed on ARMLS: new homes, private sales, and investor deals are all included.

It opens on Maricopa and Pinal Counties with everything included. Narrow it with the County, City, and ZIP panels, the Transaction Type, Property Type, and 55+ Communities boxes, and the sale price slider.

The records run to the end of last month and are updated monthly. Hover over a bar to see the exact figure for that year.