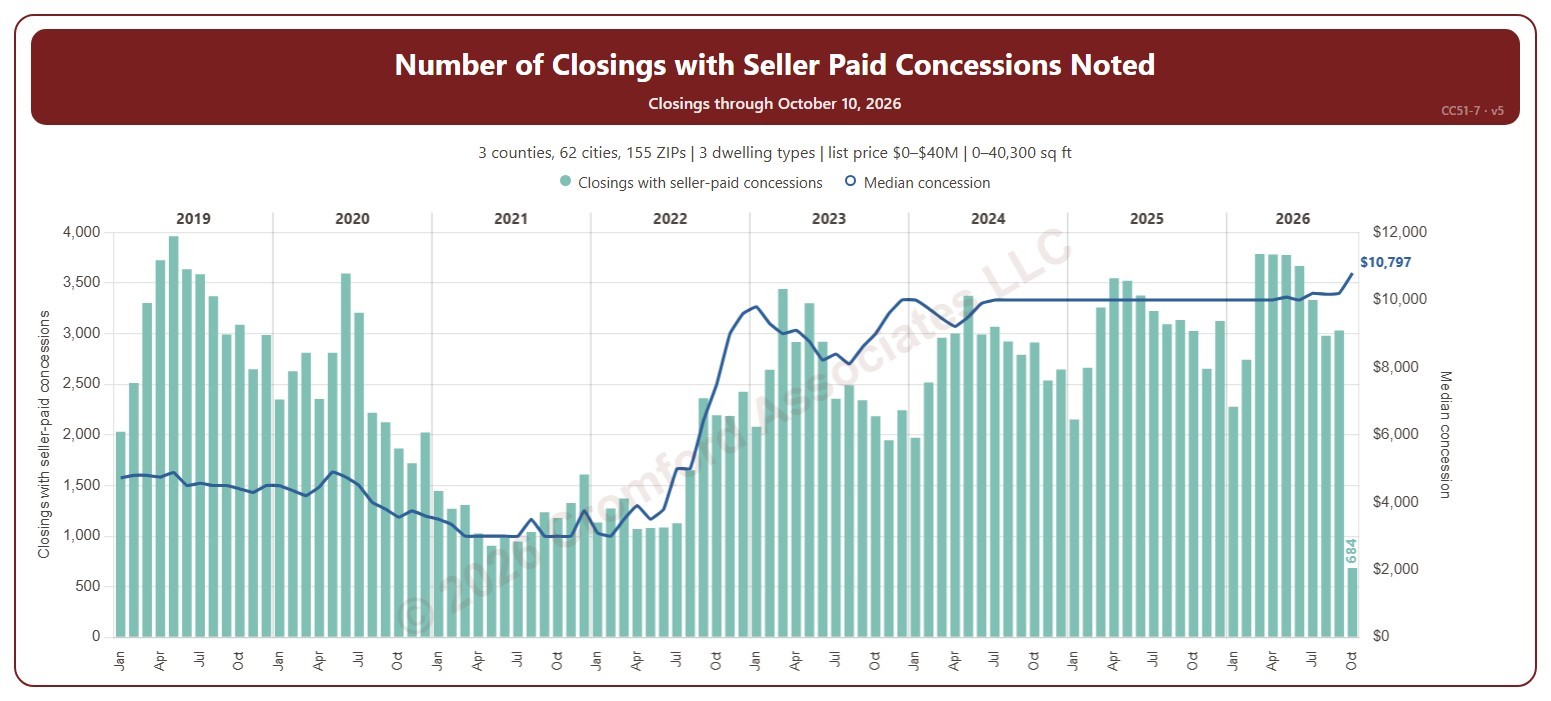
Number of Closings with Seller Paid Concessions Noted

About this chart

This chart shows the number of closings each month that had a seller-paid concession noted (the bars) and the median dollar amount of those concessions (the line, on the right-hand scale). A seller-paid concession is money the seller agrees to pay toward the buyer’s closing costs or other expenses, as noted on the ARMLS listing when it closes.

It opens on 2019 to date; tick other years in the Year panel to go back as far as 2008. The newest month is the month so far.

It opens on the Greater Phoenix area: the counties, cities, and ZIP codes that make it up are ticked to start with. Tick or untick any of them to change the area, including counties beyond Greater Phoenix. Narrow it further with the Dwelling Type, Transaction Type, and New / Resale boxes and the list price, home size, and year built sliders.

Hover over the chart to see the figures for that month.
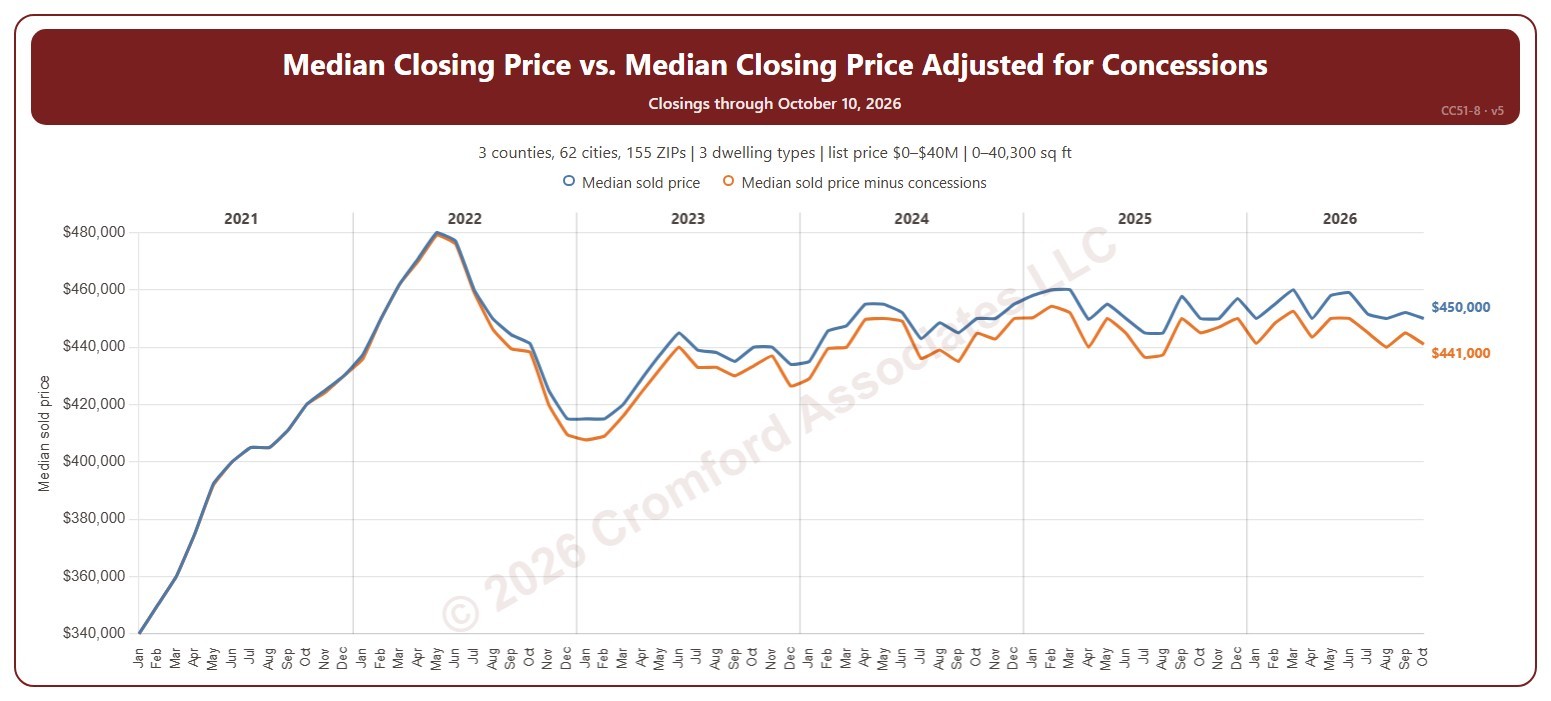
Median Closing Price vs. Median Closing Price Adjusted for Concessions

About this chart

This chart compares the median sale price each month with the median sale price after taking off any seller-paid concession. A closing with no concession counts at its full price. The gap between the two lines shows how much concessions reduce what sellers really receive.

It opens on 2021 to date; tick other years in the Year panel to go back as far as 2008. The newest month is the month so far.

It opens on the Greater Phoenix area: the counties, cities, and ZIP codes that make it up are ticked to start with. Tick or untick any of them to change the area, including counties beyond Greater Phoenix. Narrow it further with the Dwelling Type, Transaction Type, and New / Resale boxes and the list price, home size, and year built sliders.

Hover over the chart to see the figures for that month.
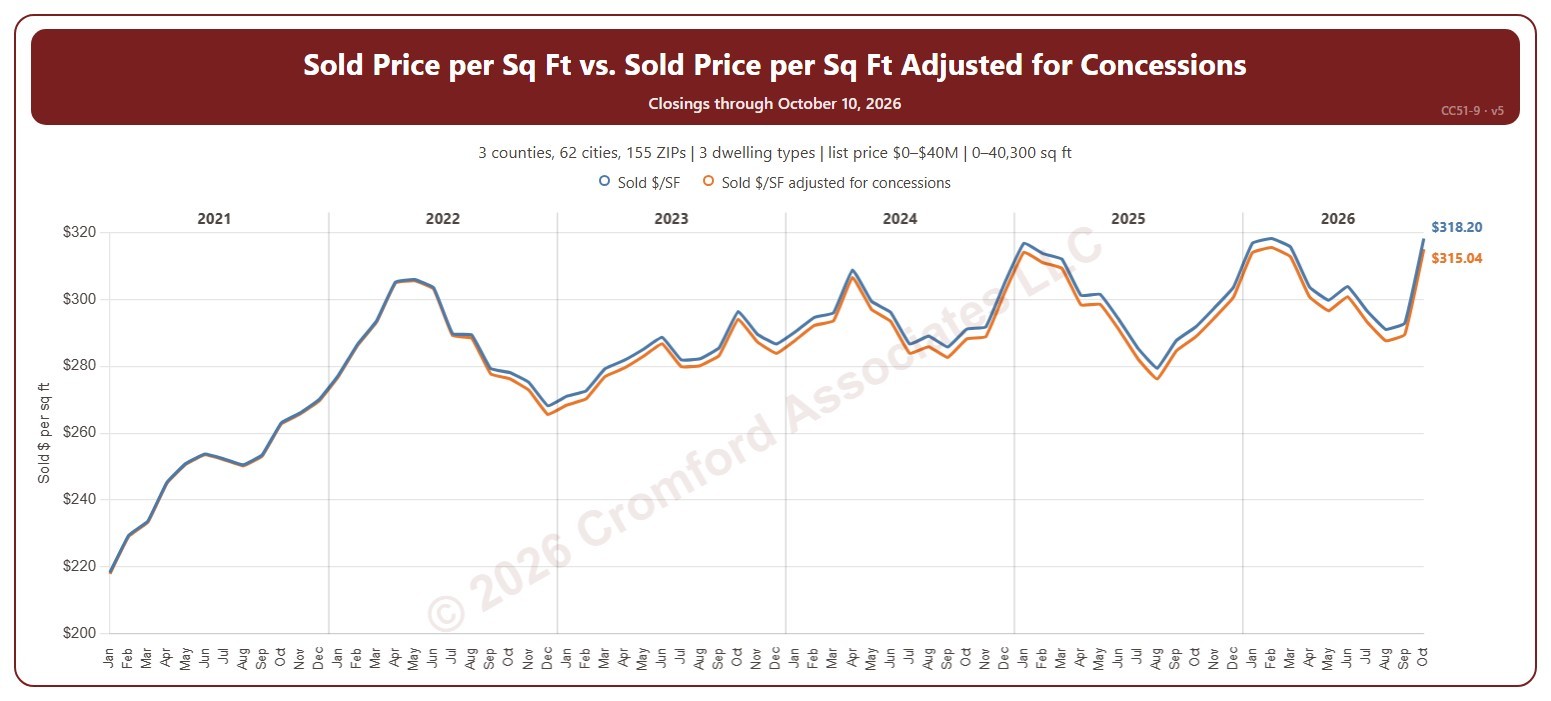
Sold Price per Sq Ft vs. Sold Price per Sq Ft Adjusted for Concessions

About this chart

This chart compares the sale price per square foot each month with the sale price per square foot after taking off any seller-paid concession. A closing with no concession counts at its full price.

It opens on 2021 to date; tick other years in the Year panel to go back as far as 2008. The newest month is the month so far.

It opens on the Greater Phoenix area: the counties, cities, and ZIP codes that make it up are ticked to start with. Tick or untick any of them to change the area, including counties beyond Greater Phoenix. Narrow it further with the Dwelling Type, Transaction Type, and New / Resale boxes and the list price, home size, and year built sliders.

Hover over the chart to see the figures for that month.
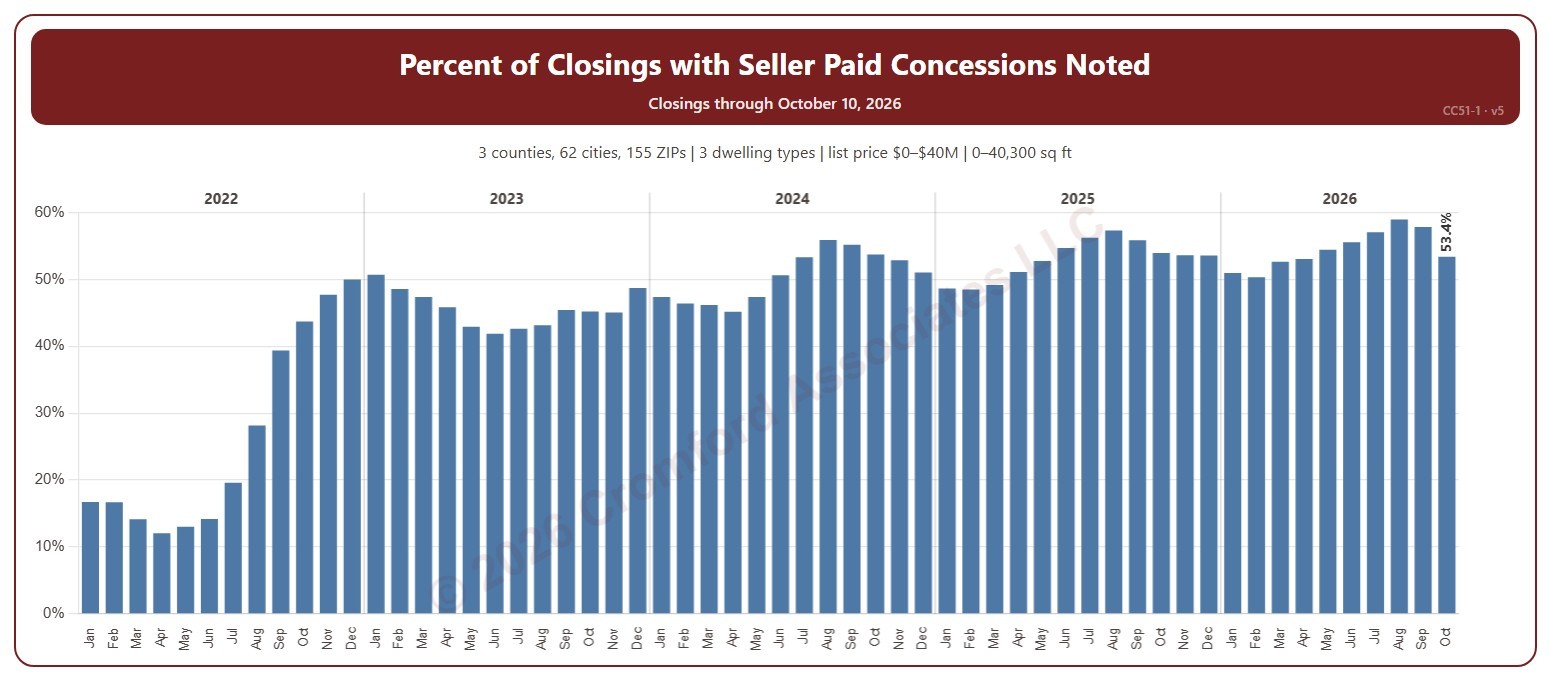
Percent of Closings with Seller Paid Concessions Noted

About this chart

This chart shows the percentage of closings each month that had a seller-paid concession noted. A seller-paid concession is money the seller agrees to pay toward the buyer’s closing costs or other expenses, as noted on the ARMLS listing when it closes.

It opens on 2022 to date; tick other years in the Year panel to go back as far as 2008. The newest month is the month so far.

It opens on the Greater Phoenix area: the counties, cities, and ZIP codes that make it up are ticked to start with. Tick or untick any of them to change the area, including counties beyond Greater Phoenix. Narrow it further with the Dwelling Type, Transaction Type, and New / Resale boxes and the list price, home size, and year built sliders.

Hover over the chart to see the figures for that month. The tooltip gives the number of closings with a concession and the total.
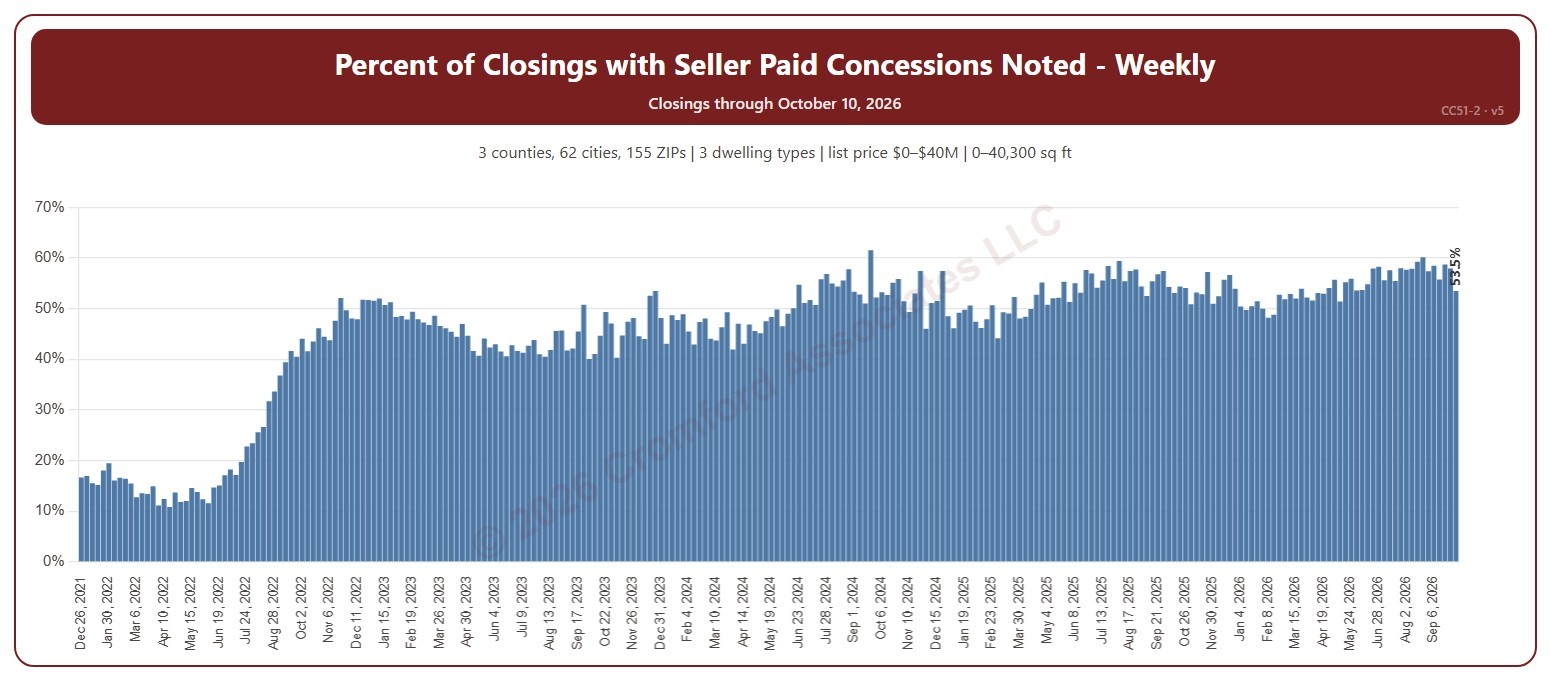
Percent of Closings with Seller Paid Concessions Noted – Weekly

About this chart

This chart shows the percentage of closings each week that had a seller-paid concession noted. Weeks run Sunday to Saturday. A seller-paid concession is money the seller agrees to pay toward the buyer’s closing costs or other expenses, as noted on the ARMLS listing when it closes.

It opens on 2022 to date; tick other years in the Year panel to go back as far as 2008. The newest week is the week so far.

It opens on the Greater Phoenix area: the counties, cities, and ZIP codes that make it up are ticked to start with. Tick or untick any of them to change the area, including counties beyond Greater Phoenix. Narrow it further with the Dwelling Type, Transaction Type, and New / Resale boxes and the list price, home size, and year built sliders.

Hover over the chart to see the figures for that week.

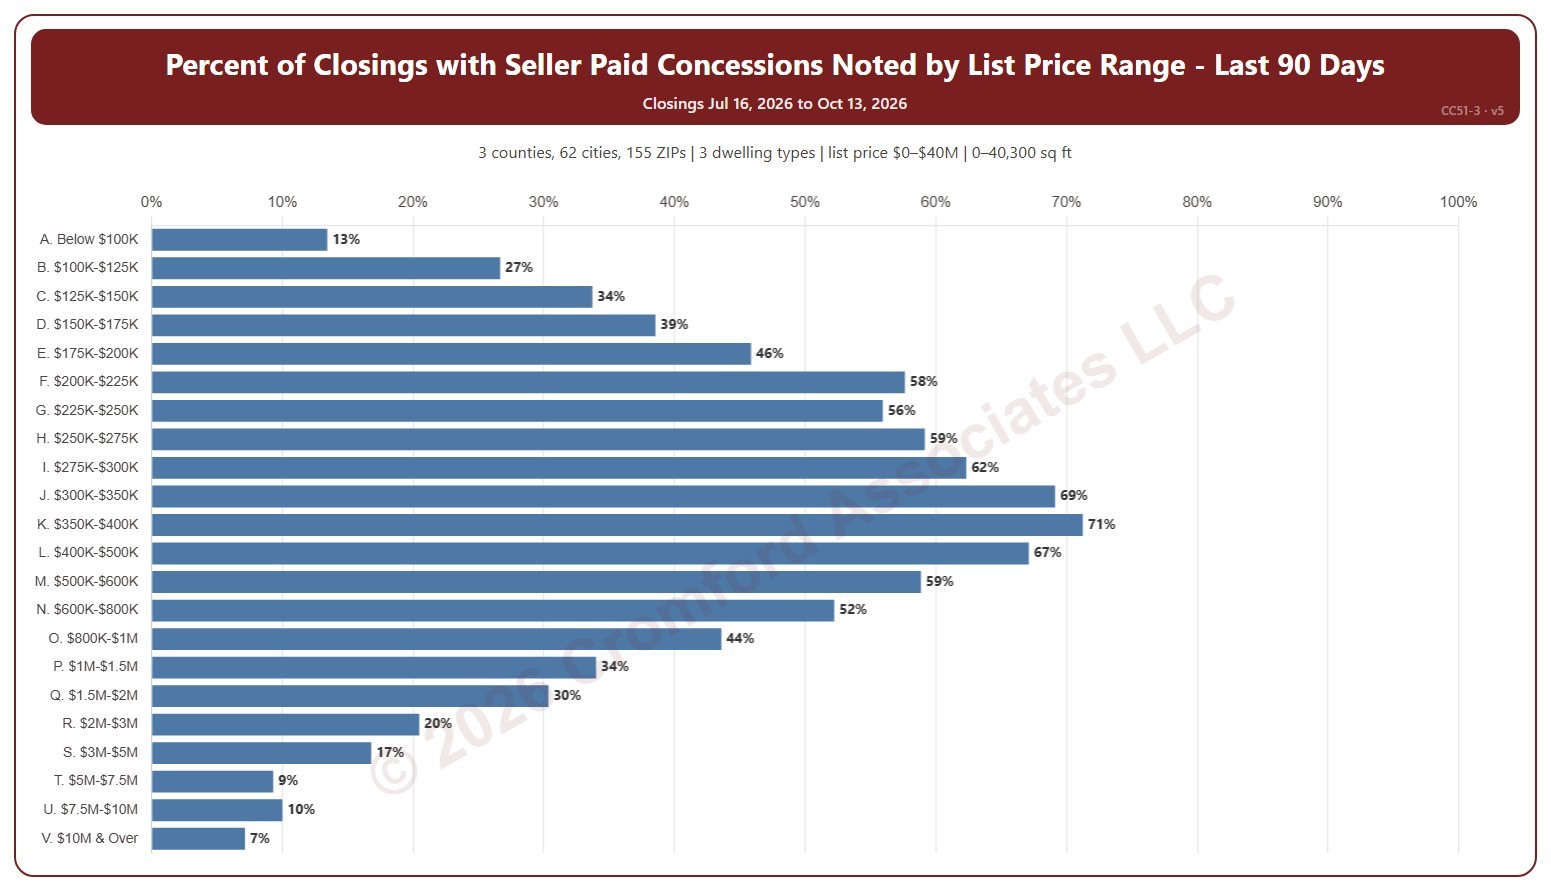
Percent of Closings with Seller Paid Concessions Noted by List Price Range

About this chart

This chart shows the percentage of recent closings that had a seller-paid concession noted, for each of 22 list price ranges from below $100K to $10M and over. A seller-paid concession is money the seller agrees to pay toward the buyer’s closing costs or other expenses, as noted on the ARMLS listing when it closes.

It opens on the last 90 days. Use the Period panel to switch between the last 30 and the last 90 days. The heading shows the exact dates covered. The chart is updated every day.

It opens on the Greater Phoenix area: the counties, cities, and ZIP codes that make it up are ticked to start with. Tick or untick any of them to change the area, including counties beyond Greater Phoenix. Narrow it further with the Dwelling Type, Transaction Type, and New / Resale boxes and the list price, home size, and year built sliders.

Hover over a bar to see the closings with a concession, the total, and the median concession.

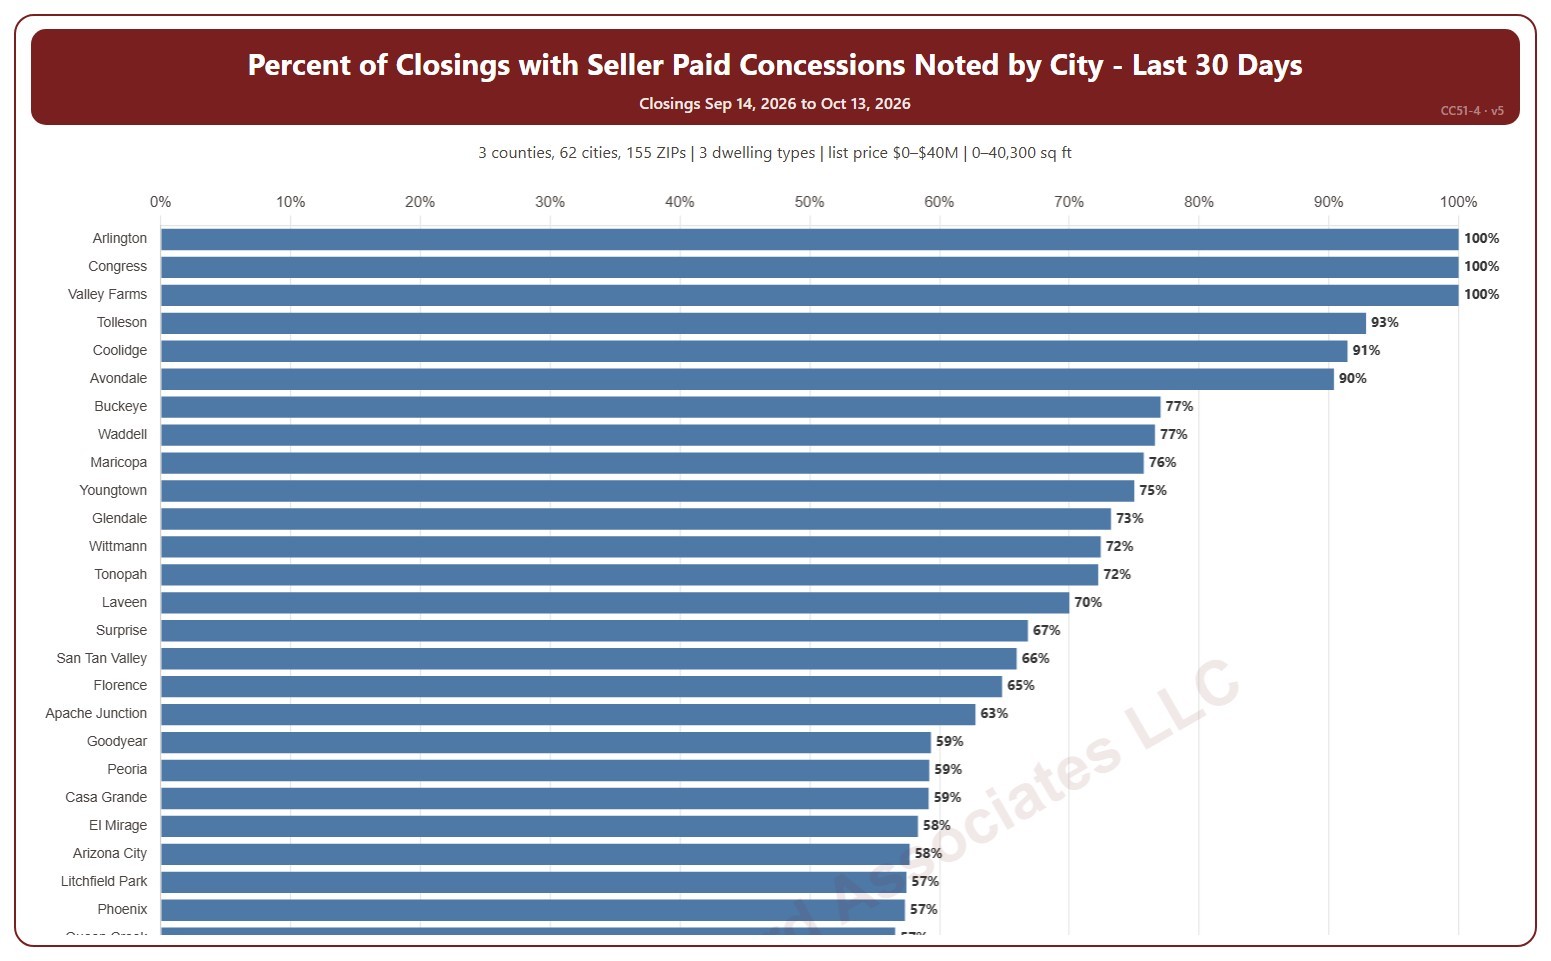
Percent of Closings with Seller Paid Concessions Noted by City

About this chart

This chart ranks cities by the percentage of recent closings that had a seller-paid concession noted, highest first. A seller-paid concession is money the seller agrees to pay toward the buyer’s closing costs or other expenses, as noted on the ARMLS listing when it closes.

It opens on the last 30 days. Use the Period panel to switch between the last 30 and the last 90 days. The heading shows the exact dates covered. The chart is updated every day. A city with only a few closings can show 0% or 100%; the tooltip gives the count. Scroll inside the chart to see every city.

It opens on the Greater Phoenix area: the counties, cities, and ZIP codes that make it up are ticked to start with. Tick or untick any of them to change the area, including counties beyond Greater Phoenix. Narrow it further with the Dwelling Type, Transaction Type, and New / Resale boxes and the list price, home size, and year built sliders.

Hover over a bar to see the closings with a concession, the total, and the median concession.

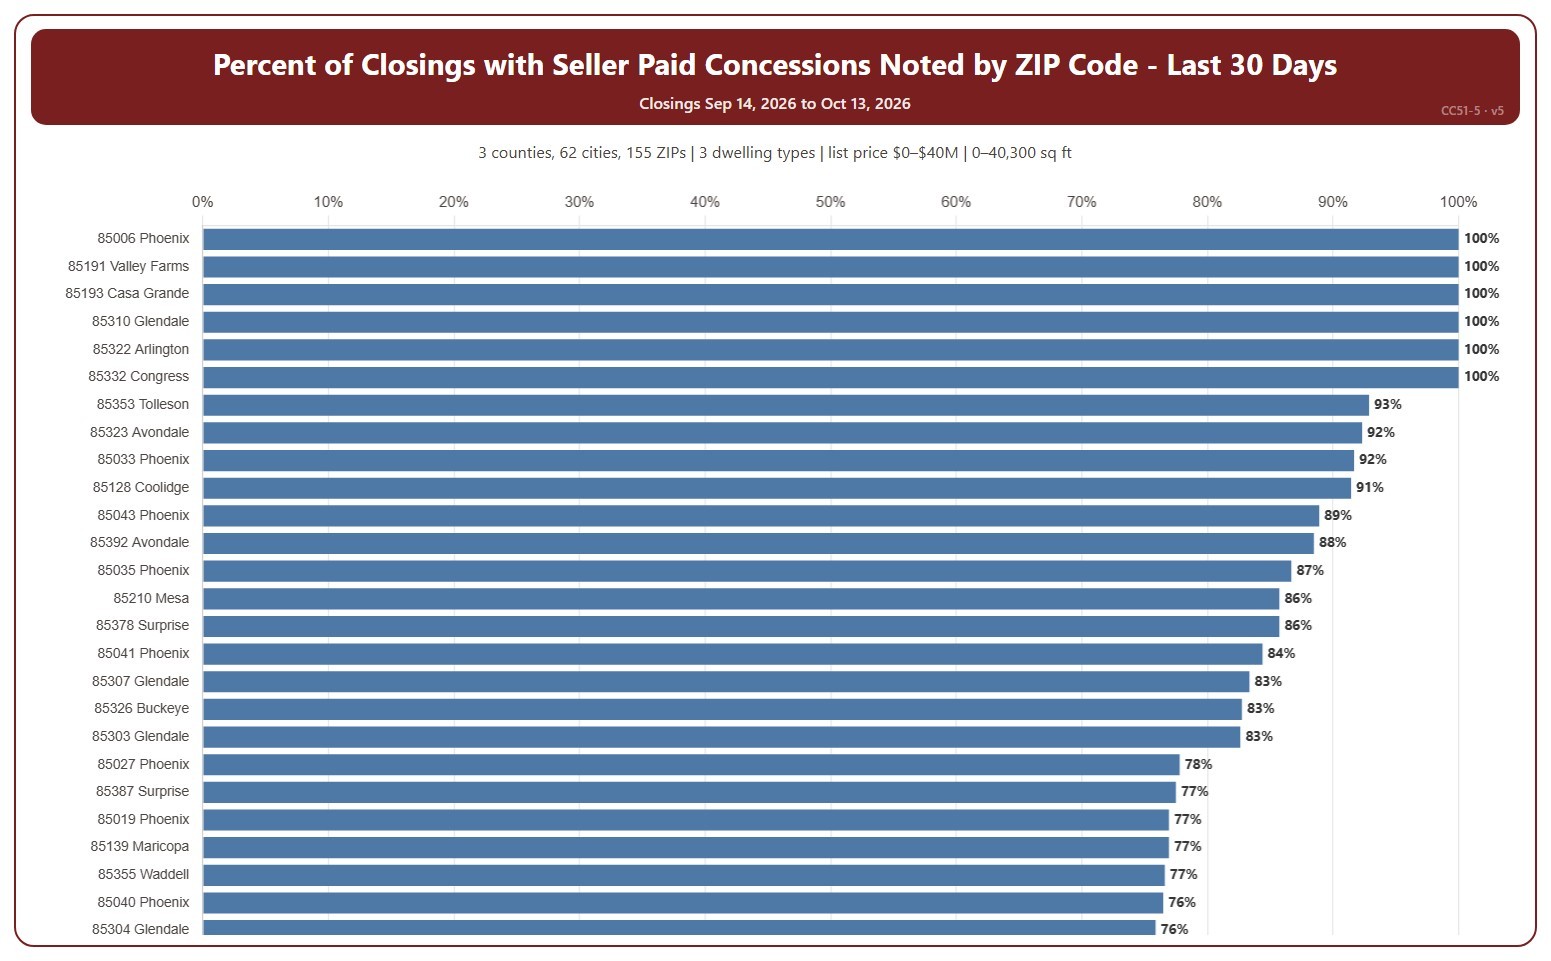
Percent of Closings with Seller Paid Concessions Noted by ZIP Code

About this chart

This chart ranks ZIP codes by the percentage of recent closings that had a seller-paid concession noted, highest first. A seller-paid concession is money the seller agrees to pay toward the buyer’s closing costs or other expenses, as noted on the ARMLS listing when it closes.

It opens on the last 30 days. Use the Period panel to switch between the last 30 and the last 90 days. The heading shows the exact dates covered. The chart is updated every day. A ZIP code with only a few closings can show 0% or 100%; the tooltip gives the count. Scroll inside the chart to see every ZIP code.

It opens on the Greater Phoenix area: the counties, cities, and ZIP codes that make it up are ticked to start with. Tick or untick any of them to change the area, including counties beyond Greater Phoenix. Narrow it further with the Dwelling Type, Transaction Type, and New / Resale boxes and the list price, home size, and year built sliders.

Hover over a bar to see the closings with a concession, the total, and the median concession.

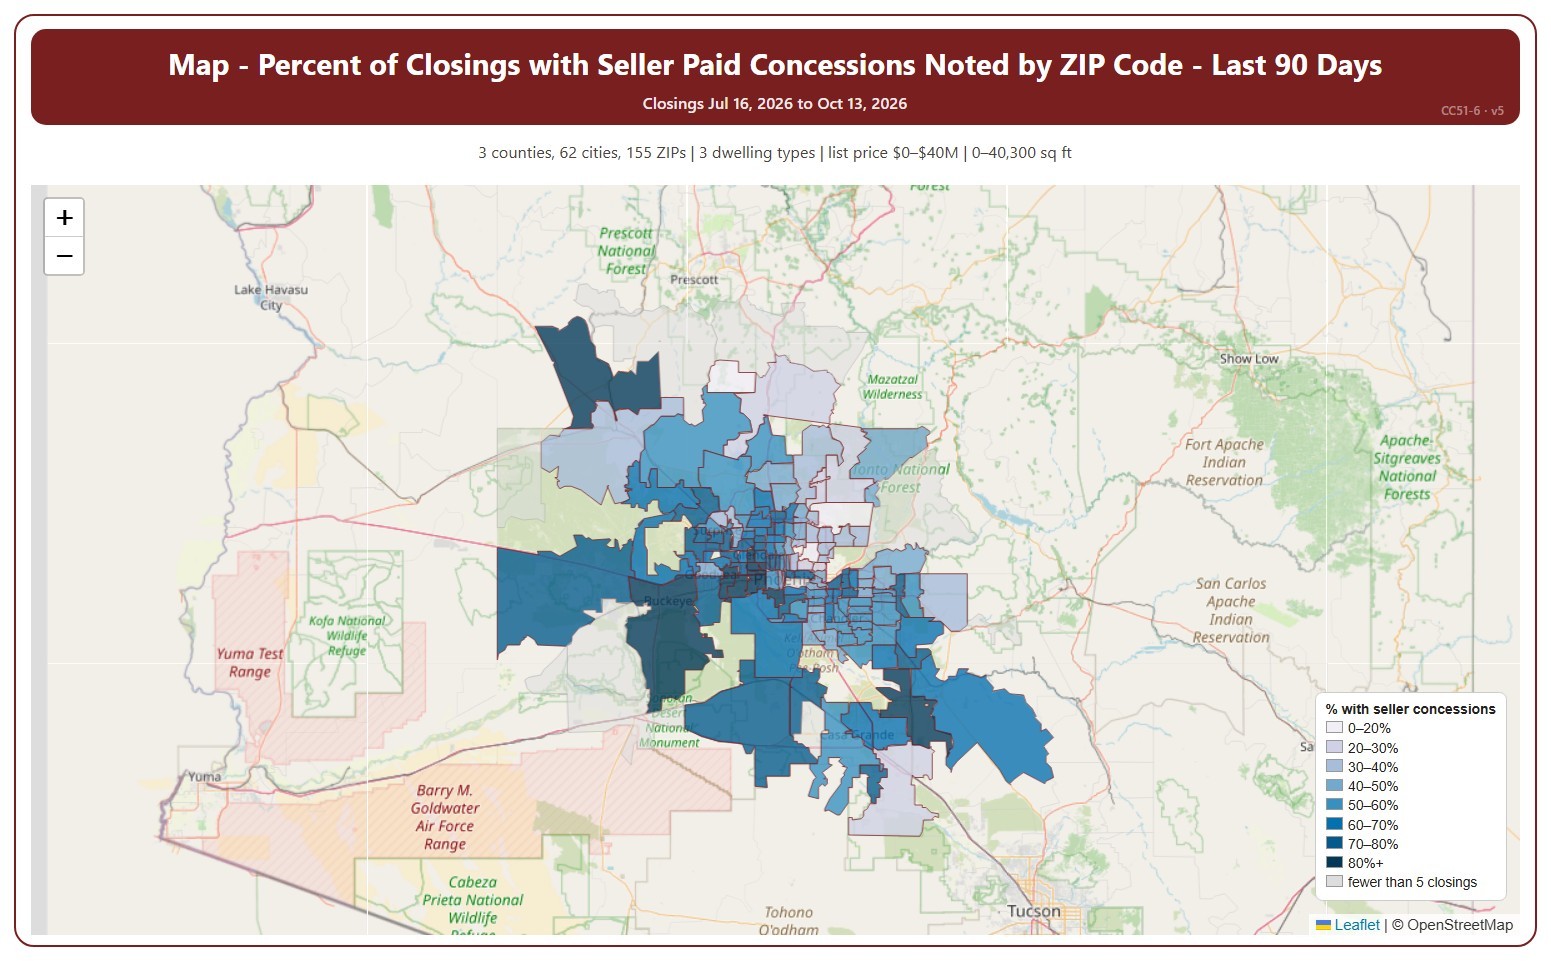
Map – Percent of Closings with Seller Paid Concessions Noted by ZIP Code

About this chart

This map shades each ZIP code by the percentage of recent closings that had a seller-paid concession noted, darker for a higher share. A seller-paid concession is money the seller agrees to pay toward the buyer’s closing costs or other expenses, as noted on the ARMLS listing when it closes.

It opens on the last 90 days. Use the Period panel to switch between the last 30 and the last 90 days. The heading shows the exact dates covered. The chart is updated every day. ZIP codes with fewer than 5 closings in the period are shown in grey without a percentage.

It opens on the Greater Phoenix area: the counties, cities, and ZIP codes that make it up are ticked to start with. Tick or untick any of them to change the area, including counties beyond Greater Phoenix. Narrow it further with the Dwelling Type, Transaction Type, and New / Resale boxes and the list price, home size, and year built sliders.

Hover over a ZIP code to see its figures.

Homes2x Sales in Greater Phoenix

About this chart

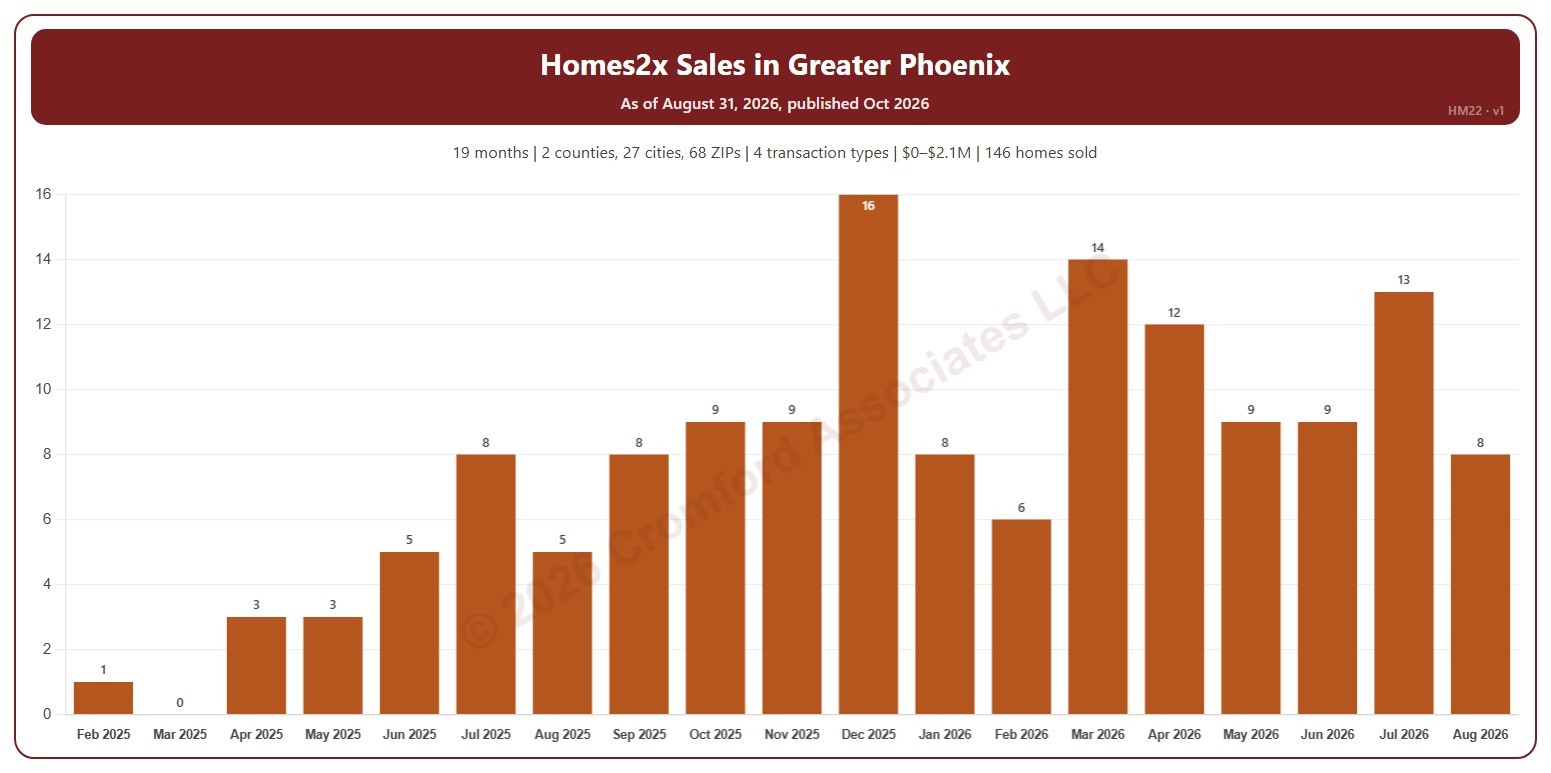
This chart counts the homes Homes2x sold each calendar month since February 2025, from residential deeds recorded by Maricopa and Pinal Counties. Homes2x is an iBuyer: it buys homes directly from owners and resells them. HM21 shows the homes it bought, so the two together show whether it is building up or running down its inventory.

It opens on Maricopa and Pinal Counties with everything included. Narrow it with the County, City, and ZIP panels, the Transaction Type, Property Type, and 55+ Communities boxes, and the sale price slider. Untick years in the Year panel to drop them from the chart.

The records run to the end of last month and are updated monthly. Hover over a bar to see the exact figure for that month.