
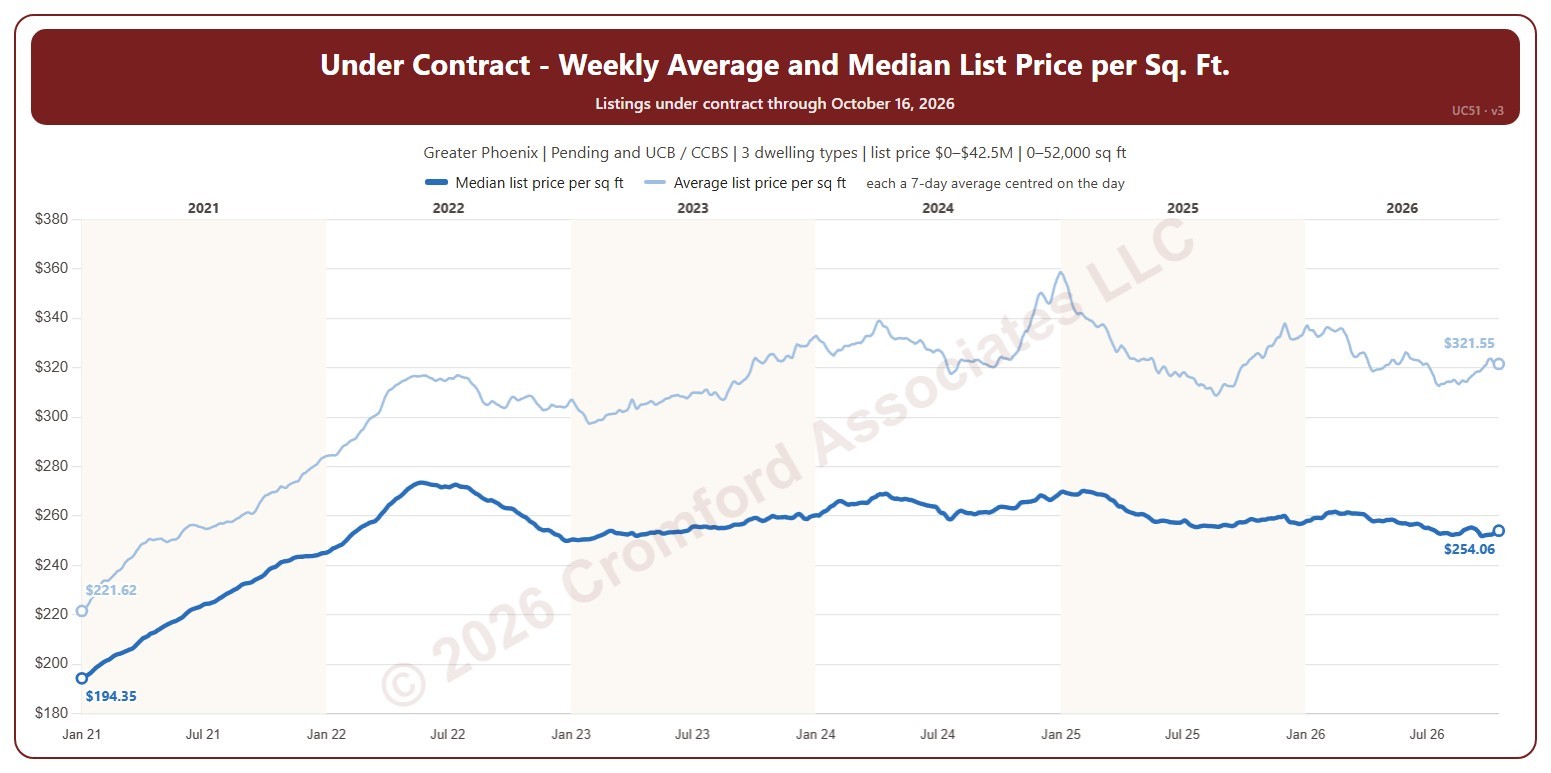
About this chart
This chart follows the list prices of the homes under contract on ARMLS (pending, plus UCB and CCBS), day by day, as dollars per square foot. The blue line is the average: each day, the average list price of those listings divided by their average size. The orange line is the median: each day, every listing’s own list price per square foot, and the middle of those figures, which one unusual listing cannot pull up or down as it can the average. Each line is the average of seven days centred on the day: three days before, the day, and three days after.
It opens on January 2021 to date; drag the handles of the date slider under the chart to choose the days shown, as far back as January 2011. The newest three days average fewer than seven days until the later days arrive, so they can still move. The chart is updated every day.
It opens on the Greater Phoenix area: the counties, cities, and ZIP codes that make it up are ticked to start with. Tick or untick any of them to change the area, including counties beyond Greater Phoenix. Use the Status boxes to show pending listings, UCB and CCBS listings, or both. Narrow it further with the Dwelling Type, Transaction Type, and New / Resale boxes and the list price, home size, and year built sliders.
Hover over the chart to see both lines’ figures for that day, that day’s own figures, and the number of listings under contract.