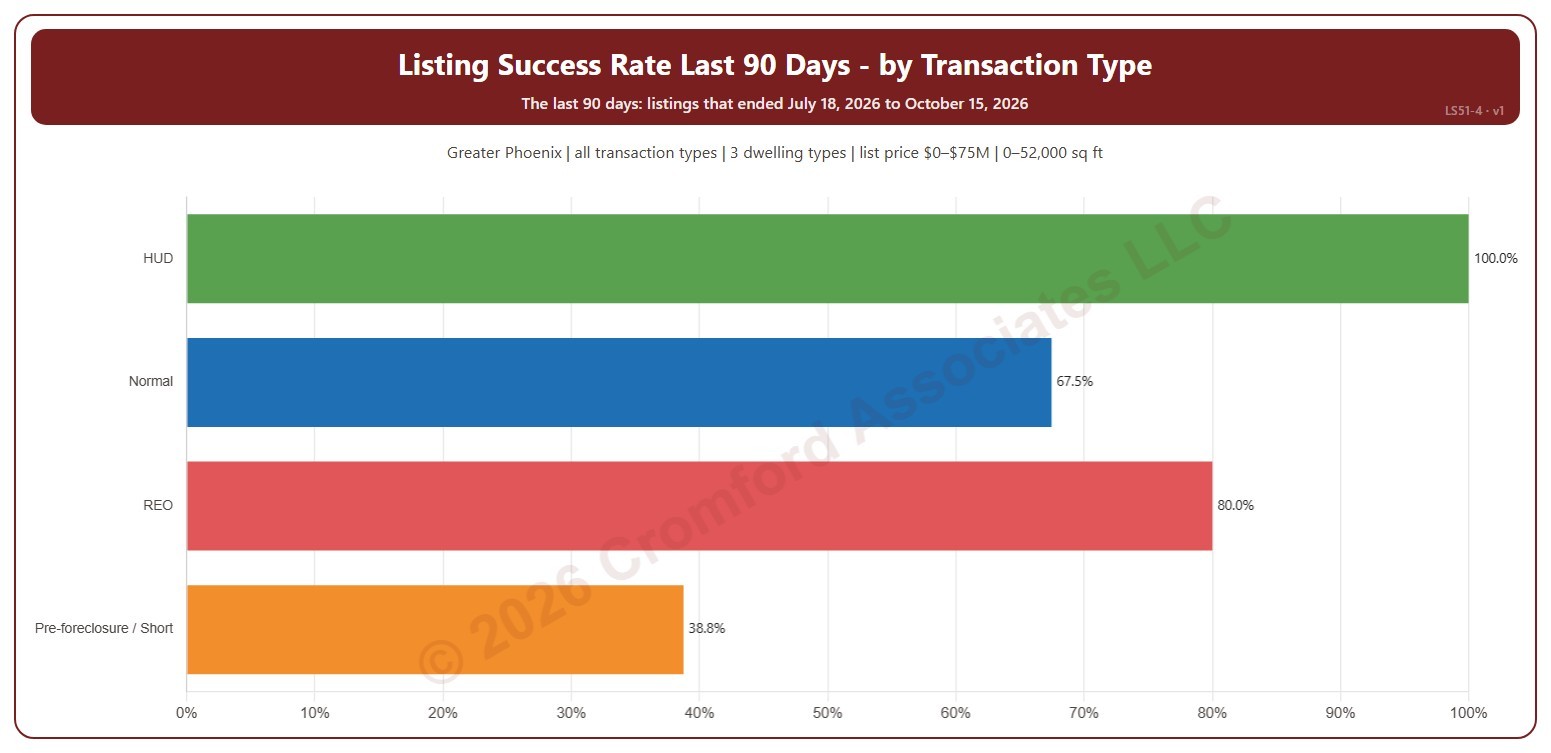
Listing Success Rate by Transaction Type

About this chart

This chart shows the listing success rate over the last 90 days for each transaction type: normal sales, REO, pre-foreclosure / short sales, and HUD. The listing success rate is the share of listings that closed, out of all the listings that ended: closed, expired, or cancelled. Each listing counts once, in the month (or window) its listing ended: the closing date for a closing, the expiration for an expired listing, the cancellation for a cancelled one.

It covers the 90 days of listings that ended up to the newest one; the heading shows the exact dates. The chart is updated every day.

It opens on the Greater Phoenix area: the counties, cities, and ZIP codes that make it up are ticked to start with. Tick or untick any of them to change the area, including counties beyond Greater Phoenix. It opens on all four transaction types; untick any to leave them out. Narrow it further with the Dwelling Type and New / Resale boxes and the list price, home size, and year built sliders.

Hover over a bar to see the rate, the listings that closed, and those that expired or were cancelled.
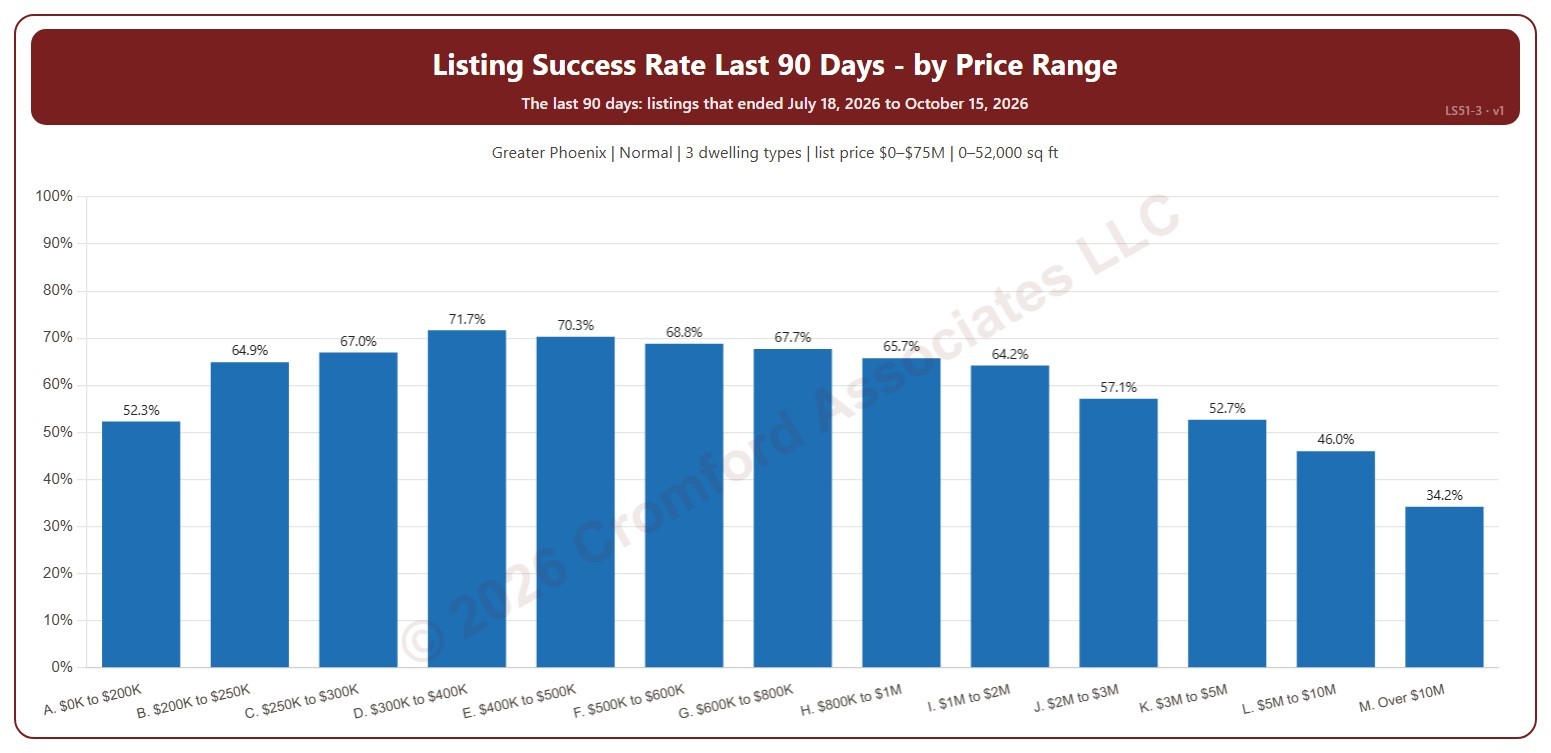
Listing Success by Price Range

About this chart

This chart shows the listing success rate over the last 90 days in each list price range, from $200K and under to over $10M. The listing success rate is the share of listings that closed, out of all the listings that ended: closed, expired, or cancelled. Each listing counts once, in the month (or window) its listing ended: the closing date for a closing, the expiration for an expired listing, the cancellation for a cancelled one.

It covers the 90 days of listings that ended up to the newest one; the heading shows the exact dates. The chart is updated every day.

It opens on the Greater Phoenix area: the counties, cities, and ZIP codes that make it up are ticked to start with. Tick or untick any of them to change the area, including counties beyond Greater Phoenix. It opens on normal sales; tick other transaction types to add them. Narrow it further with the Dwelling Type and New / Resale boxes and the list price, home size, and year built sliders.

Hover over a bar to see the rate, the listings that closed, and those that expired or were cancelled.
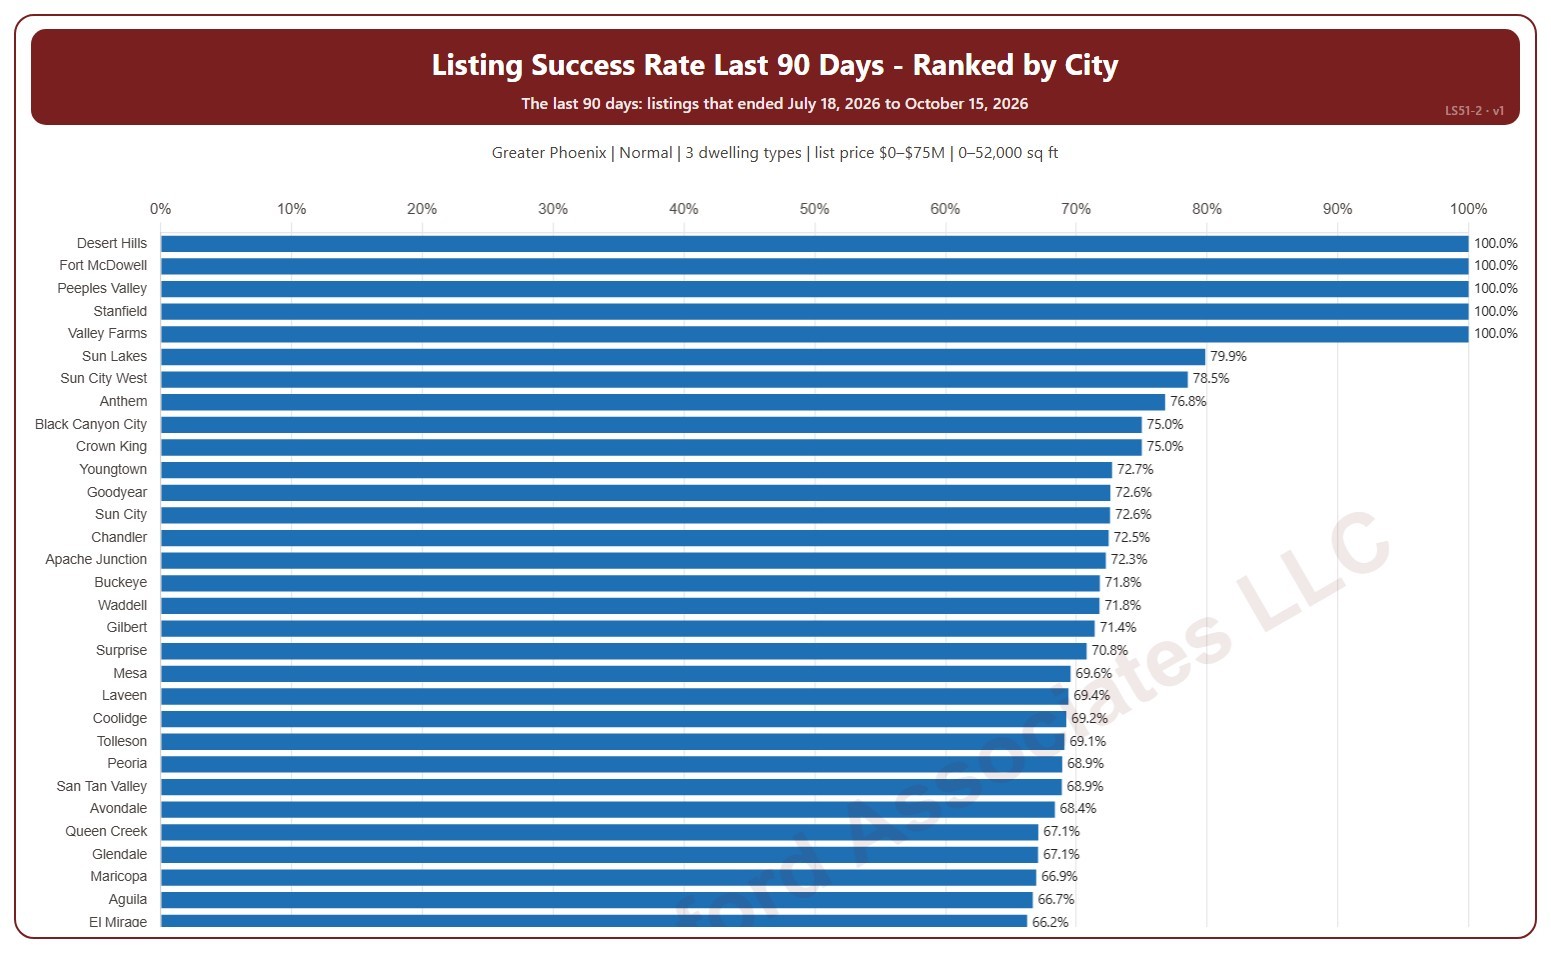
Listing Success Rate Ranked by City

About this chart

This chart ranks cities by their listing success rate over the last 90 days, highest first. The listing success rate is the share of listings that closed, out of all the listings that ended: closed, expired, or cancelled. Each listing counts once, in the month (or window) its listing ended: the closing date for a closing, the expiration for an expired listing, the cancellation for a cancelled one. A city with only a few listings can show 0% or 100%.

It covers the 90 days of listings that ended up to the newest one; the heading shows the exact dates. The chart is updated every day. Scroll inside the chart to see every city; a printed copy runs over as many pages as it needs.

It opens on the Greater Phoenix area: the counties, cities, and ZIP codes that make it up are ticked to start with. Tick or untick any of them to change the area, including counties beyond Greater Phoenix. It opens on normal sales; tick other transaction types to add them. Narrow it further with the Dwelling Type and New / Resale boxes and the list price, home size, and year built sliders.

Hover over a bar to see the rate, the listings that closed, and those that expired or were cancelled.
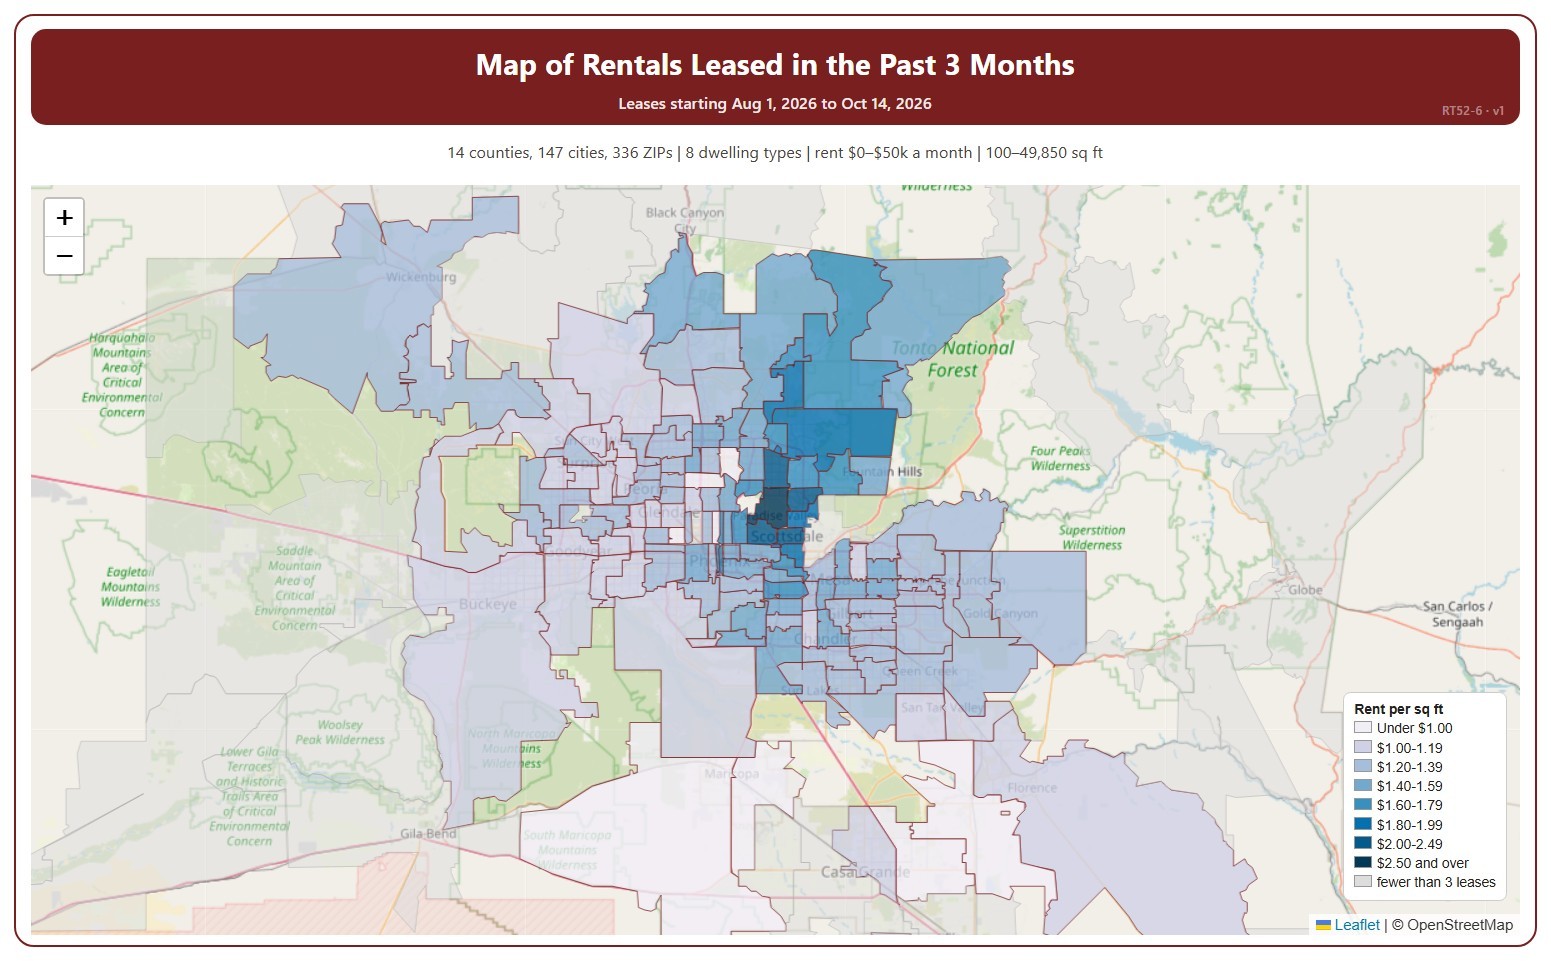
Map of Rentals Leased in Past 3 Months

About this chart

This map shades each ZIP code by the average monthly rent per square foot of recent leases, darker for a higher rent. It covers residential rentals leased through ARMLS, using the monthly rent each lease closed at, and places each lease in the month its tenancy starts.

It covers the last three calendar months up to the latest data; the heading shows the exact dates. The chart is updated every day. ZIP codes with fewer than 3 leases in the period are shown in grey.

It opens on every area in ARMLS; tick or untick counties, cities, and ZIP codes to narrow it. Narrow it further with the Dwelling Type and Furnished boxes and the monthly rent, home size, and year built sliders.

Hover over a ZIP code to see its rent per square foot, average rent, and number of leases.

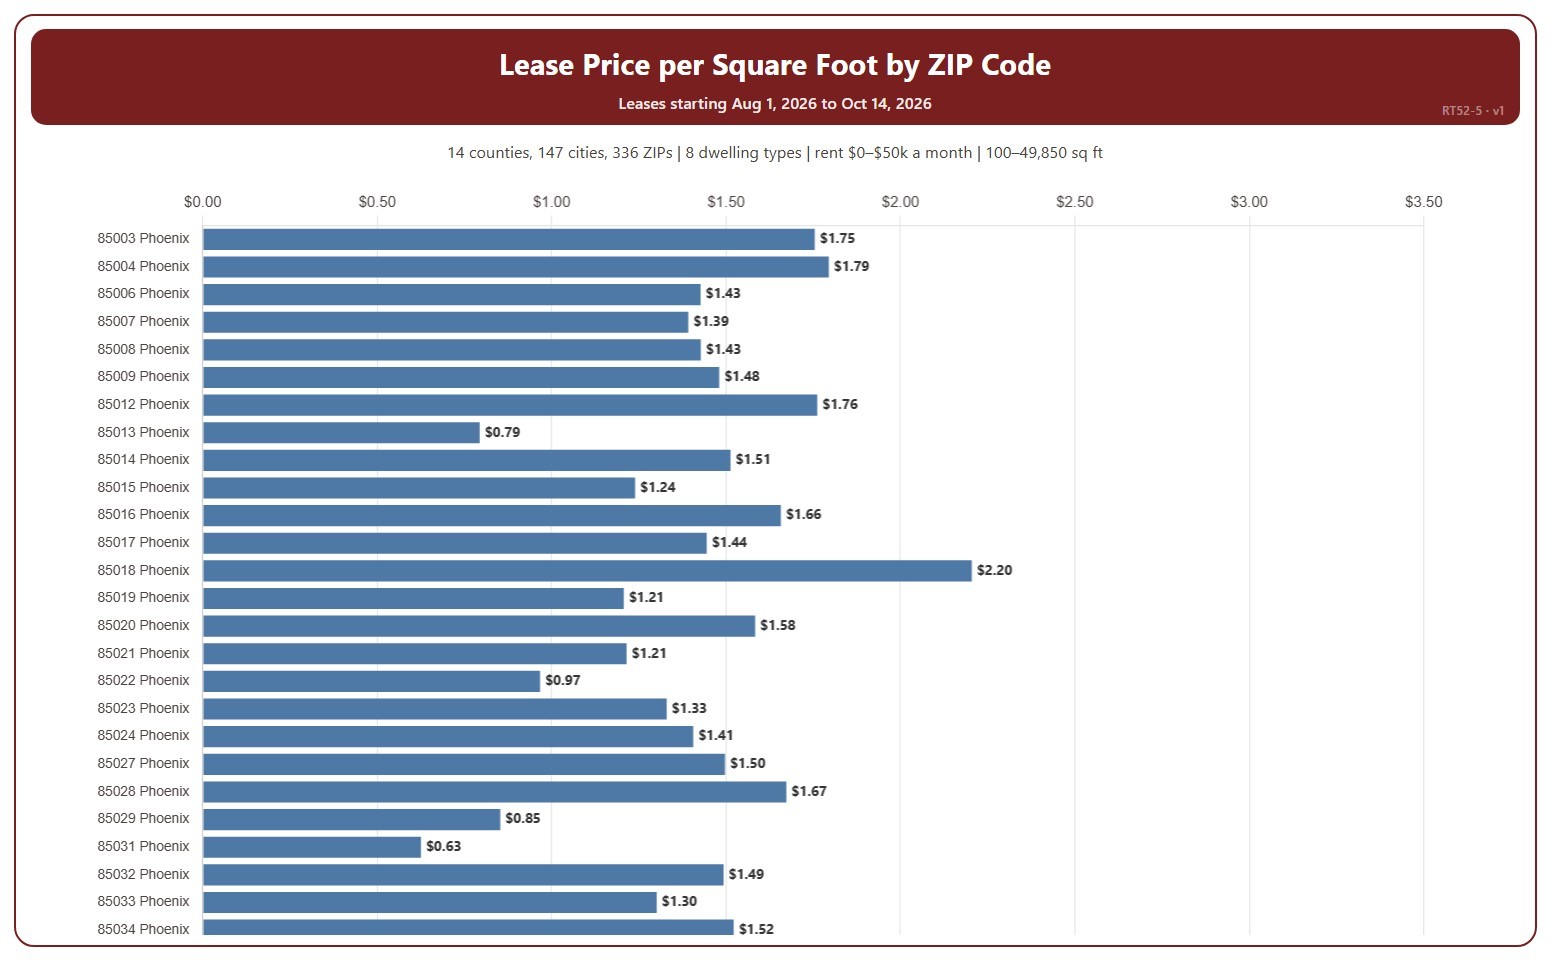
Lease Price by ZIP Code

About this chart

This chart shows the average monthly rent per square foot of recent leases in each ZIP code. It covers residential rentals leased through ARMLS, using the monthly rent each lease closed at, and places each lease in the month its tenancy starts.

It covers the last three calendar months up to the latest data; the heading shows the exact dates. The chart is updated every day. A ZIP code with only a few leases can be pulled up or down by a single home; the tooltip gives the number of leases. Scroll inside the chart to see every ZIP code.

It opens on every area in ARMLS; tick or untick counties, cities, and ZIP codes to narrow it. Narrow it further with the Dwelling Type and Furnished boxes and the monthly rent, home size, and year built sliders.

Hover over a bar to see the rent per square foot, the average rent, and the number of leases.