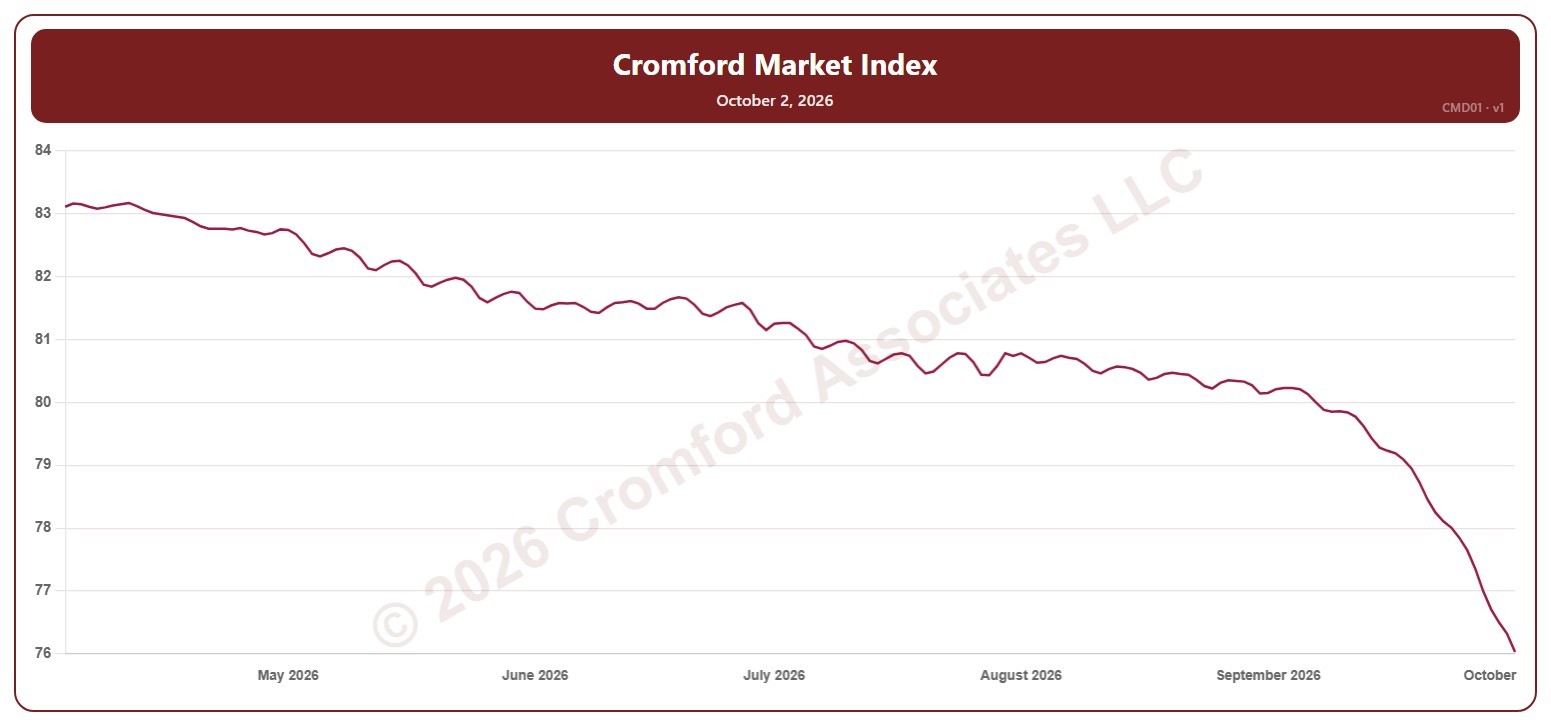
Cromford® Market Index – Last 6 Months

About this chart

This chart shows the Cromford® Market Index for the whole ARMLS market, all areas and all dwelling types, every day over the last six months. A reading below 90 indicates a buyer’s market, above 110 a seller’s market, and between 90 and 110 a balanced market.

Hover over the line to see the exact figure for that day.
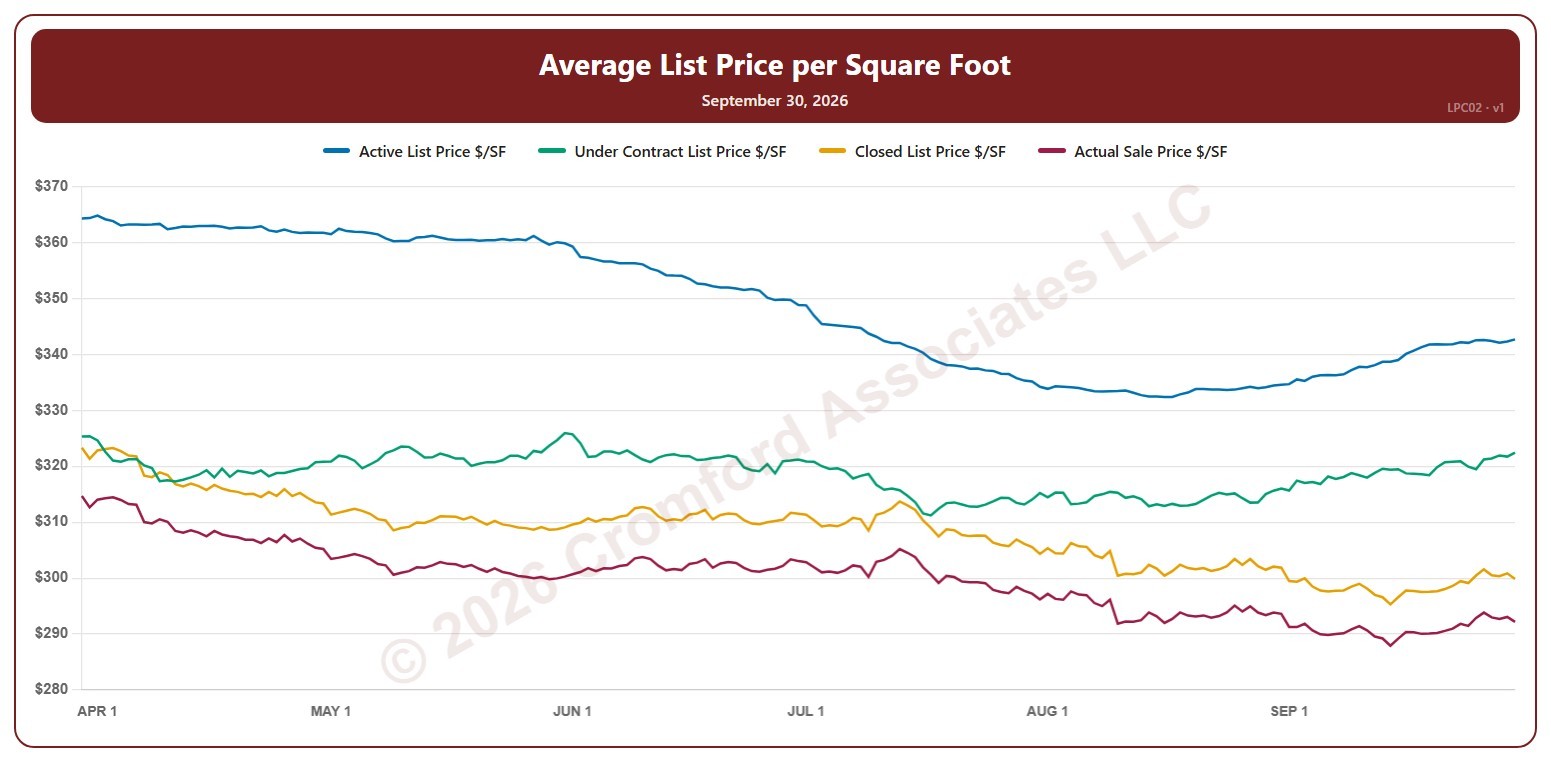
Average List Price per Square Foot – Last 6 Months

About this chart

This chart shows four average prices per square foot for the whole ARMLS market, all areas and all dwelling types, every day over the last six months: the list price of active listings, the list price of listings under contract, the final list price of the homes that closed in the month up to that day, and the price those homes actually sold for. Reading them together shows the path from what sellers ask to what buyers pay.

Click the buttons above the chart to show or hide each line. Hover over the chart to see each figure for that day.

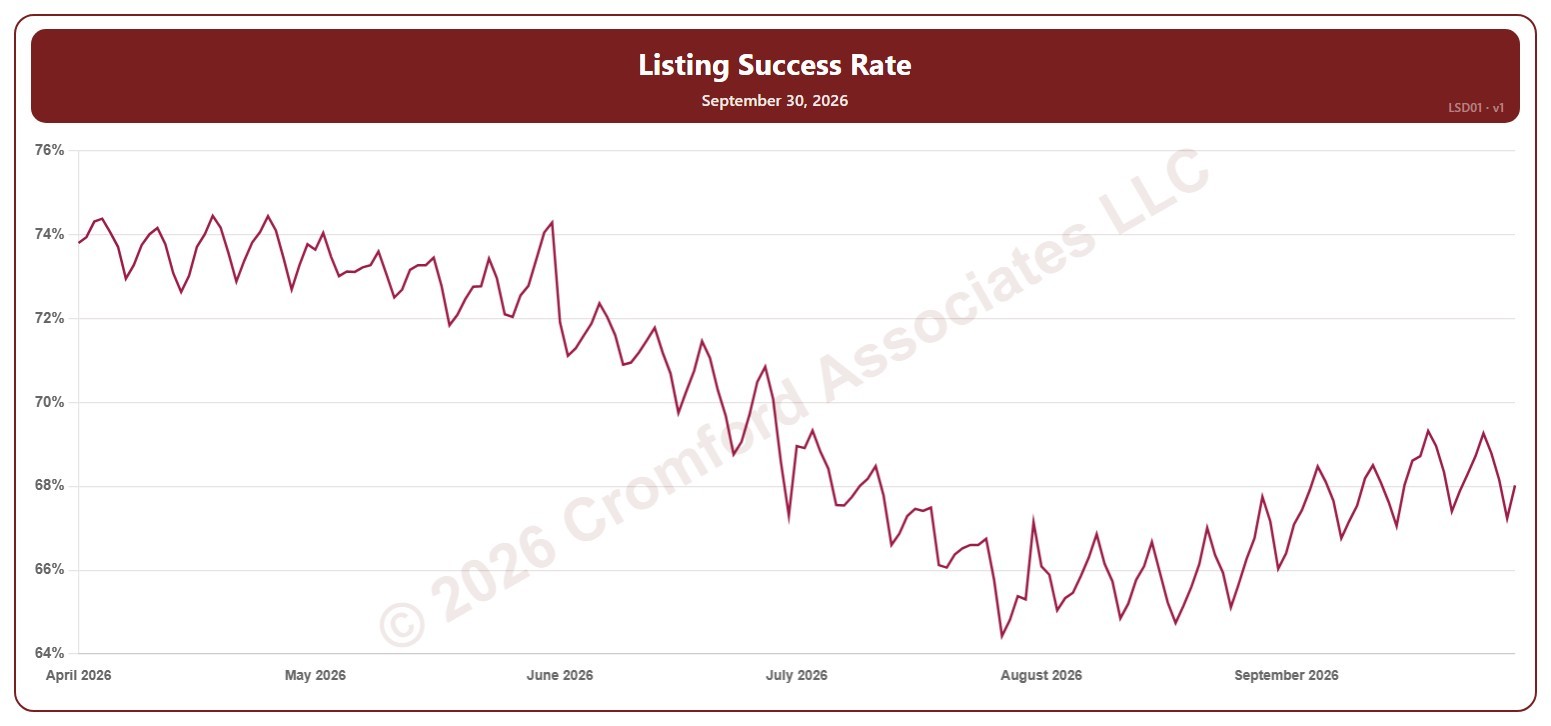
Listing Success Rate – Last 6 Months

About this chart

This chart shows the listing success rate: the share of listings that ended in a sale rather than being canceled or expiring, over a month, for the whole ARMLS market, all areas and all dwelling types, every day over the last six months. Each point covers the listings that ended (sold, canceled, or expired) in the month up to that day. A higher rate means more listings are ending in a sale.

Hover over the line to see the exact figure for that day.
Sales per Year – Last 6 Months

About this chart

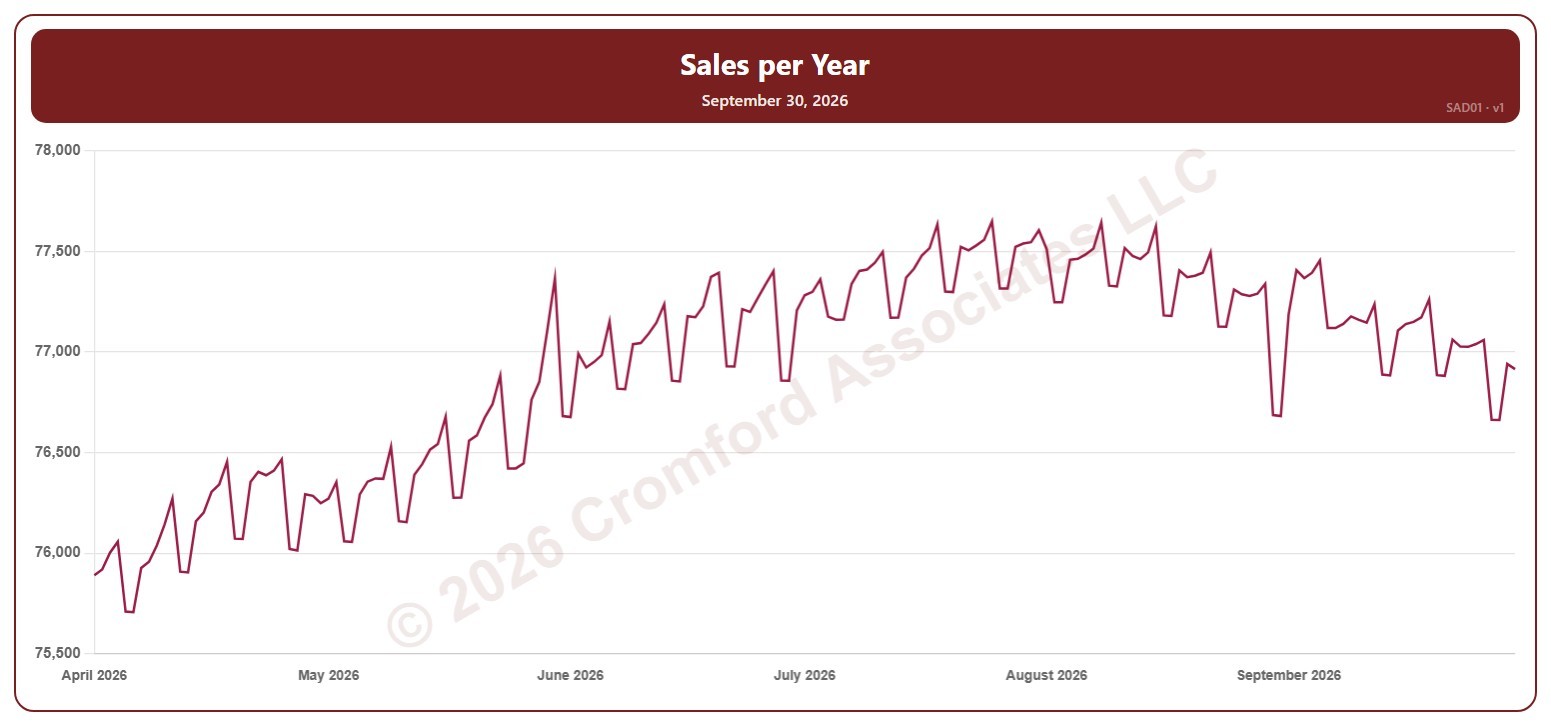
This chart shows the number of homes that closed over 12 months (sales per year), for the whole ARMLS market, all areas and all dwelling types, every day over the last six months. Each point covers the closings in the 12 months up to that day.

Hover over the line to see the exact figure for that day.
Average Sales Price per Square Foot – Annual – Last 6 Months

About this chart

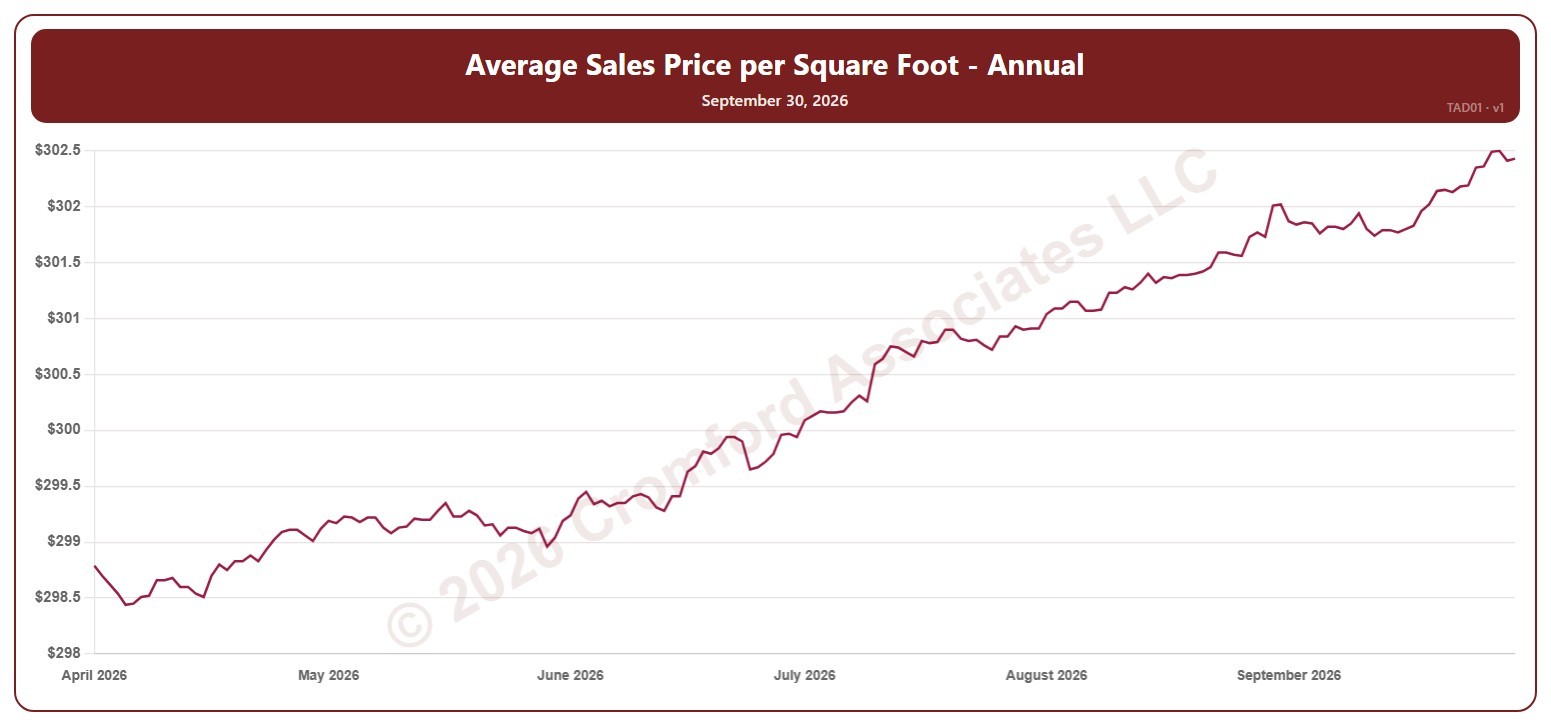
This chart shows the average sales price per square foot of the homes that closed over 12 months, for the whole ARMLS market, all areas and all dwelling types, every day over the last six months. Each point covers the closings in the 12 months up to that day. Price per square foot lets you compare homes of different sizes; this is the true average across all the square feet sold.

Hover over the line to see the exact figure for that day.
Average Sales Price per Square Foot – Monthly – Last 6 Months

About this chart

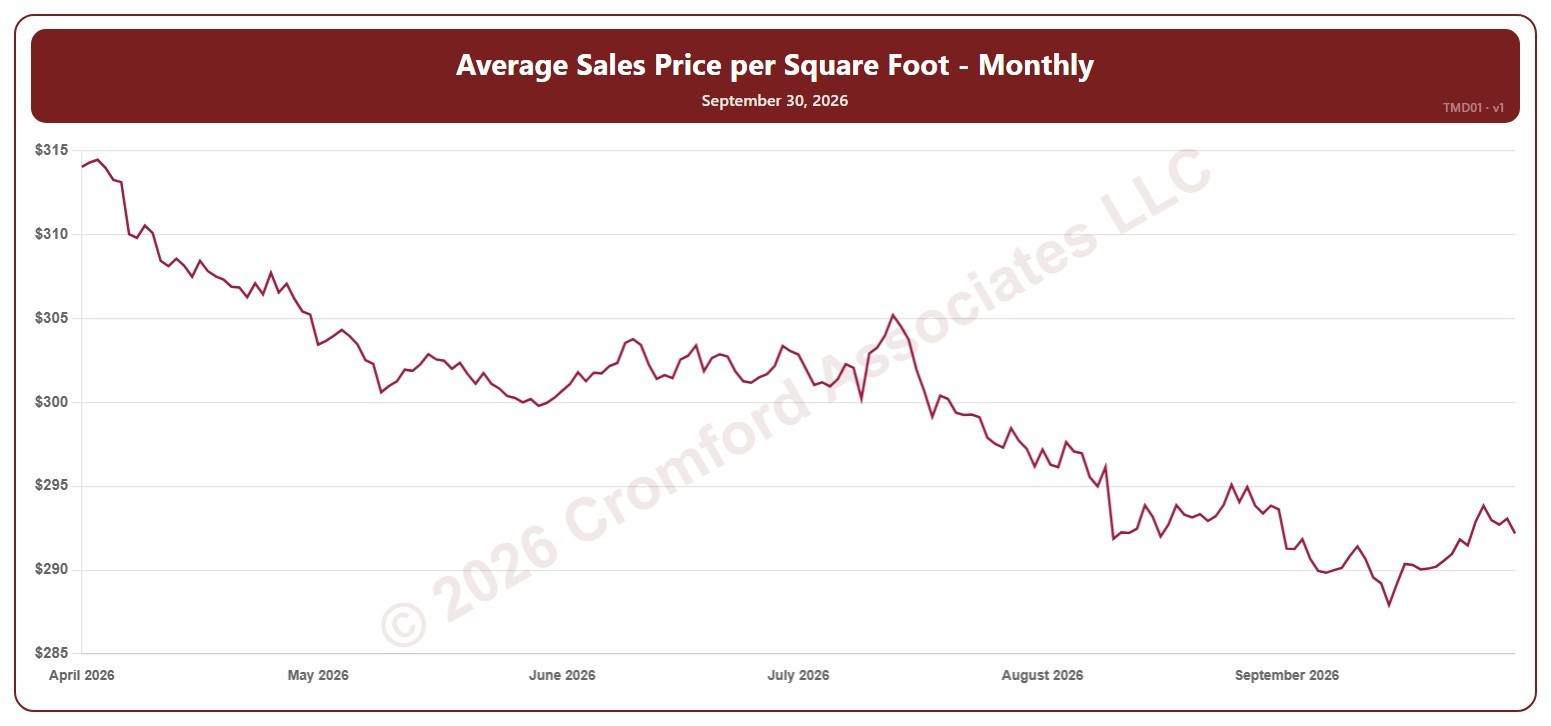
This chart shows the average sales price per square foot of the homes that closed in a month, for the whole ARMLS market, all areas and all dwelling types, every day over the last six months. Each point covers the closings in the month up to that day. Price per square foot lets you compare homes of different sizes; this is the true average across all the square feet sold.

Hover over the line to see the exact figure for that day.
Median List Price per Square Foot by City – Listings Under Contract

About this chart

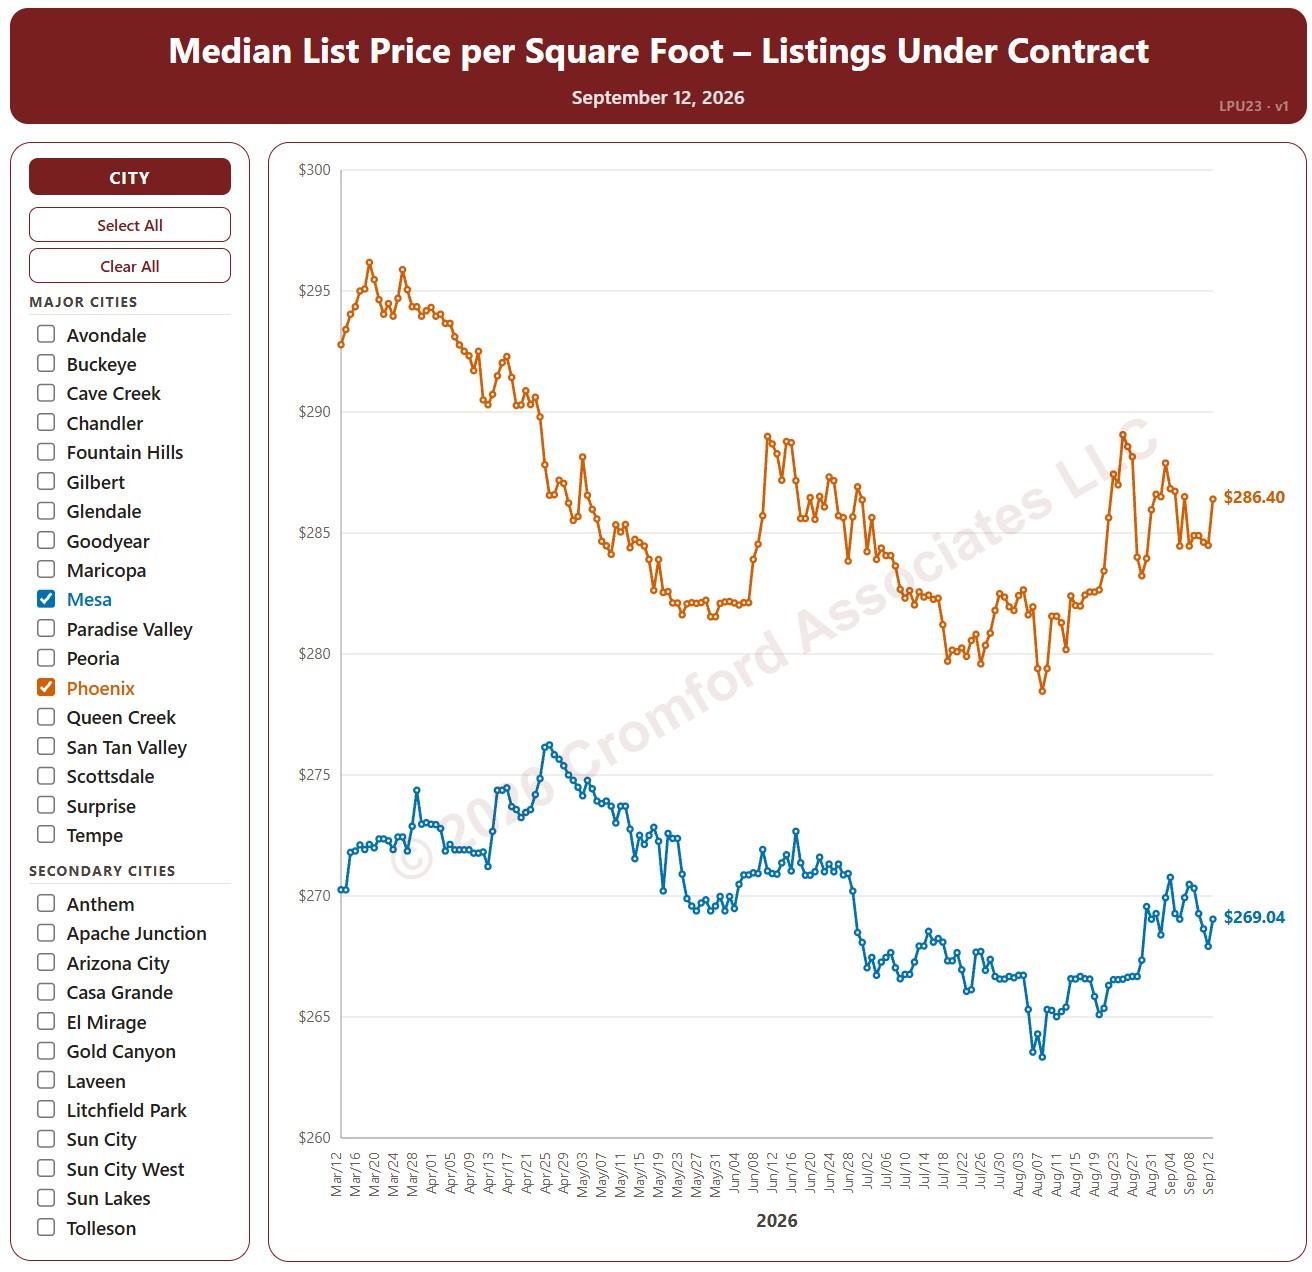
This chart compares the median list price per square foot of listings under contract (Pending plus UCB / CCBS) across 34 cities in and around Greater Phoenix, every day over the last six months, for single-family detached homes on ARMLS. It shows the asking prices of the homes buyers have agreed to buy.

The 18 major cities are drawn as solid lines and the 16 secondary cities as dashed lines. It opens on Mesa and Phoenix; use the city check boxes, or Select All and Clear All, to choose which cities are shown.

Hover over a line to see the exact figure for that day.
Monthly Median Sale Price per Square Foot by City

About this chart

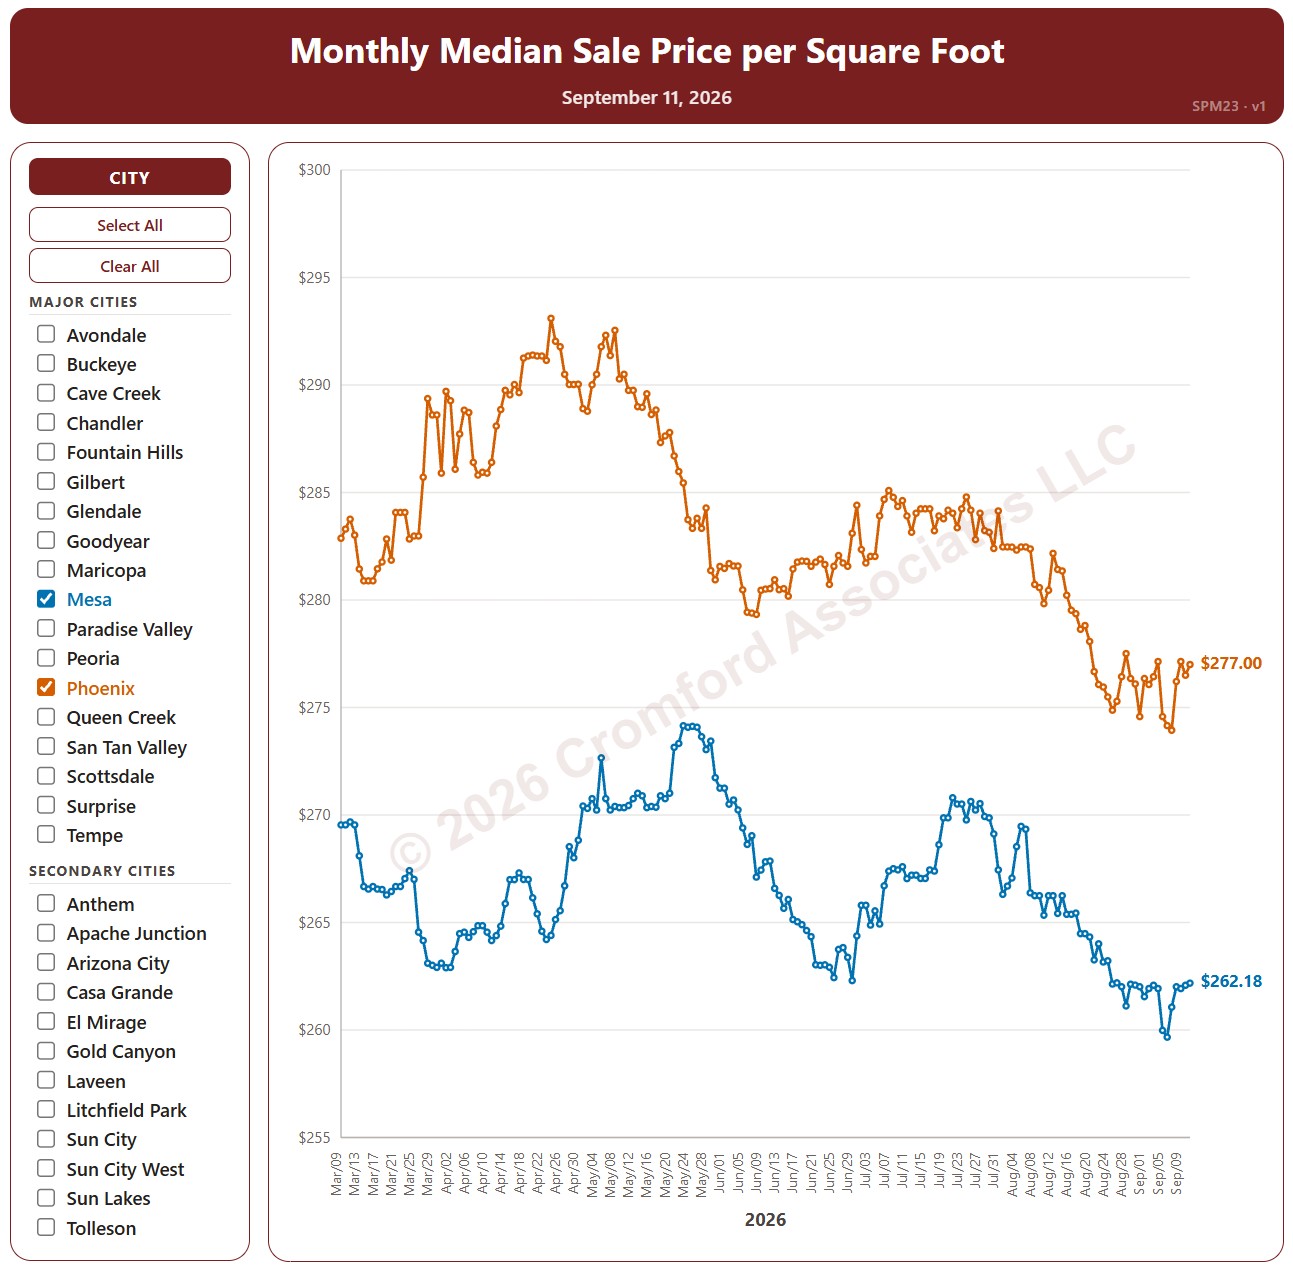
This chart compares the median sales price per square foot across 34 cities in and around Greater Phoenix, every day over the last six months, for single-family detached homes that closed through ARMLS. Each point covers the closings in the month up to that day.

The 18 major cities are drawn as solid lines and the 16 secondary cities as dashed lines. It opens on Mesa and Phoenix; use the city check boxes, or Select All and Clear All, to choose which cities are shown.

Hover over a line to see the exact figure for that day.
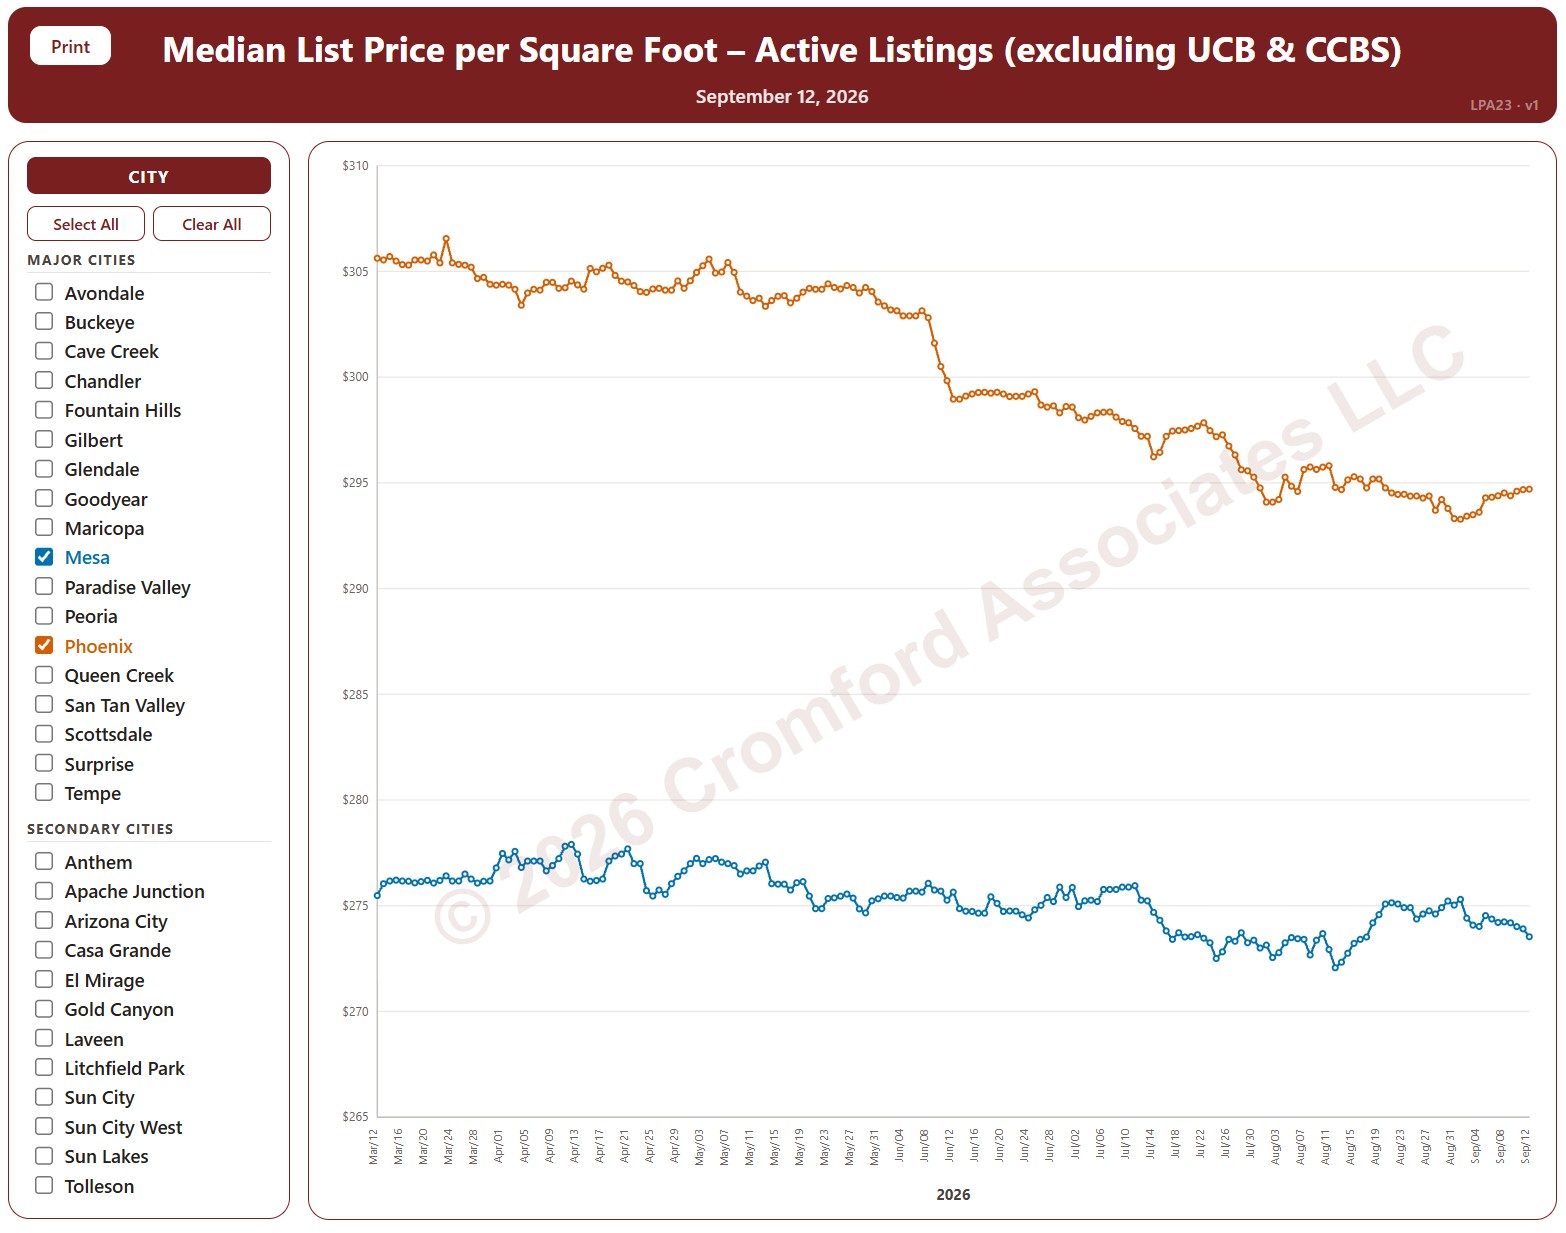
Median List Price per Square Foot by City – Active Listings

About this chart

This chart compares the median list price per square foot of active listings (not counting UCB / CCBS) across 34 cities in and around Greater Phoenix, every day over the last six months, for single-family detached homes on ARMLS. It shows what sellers are asking.

The 18 major cities are drawn as solid lines and the 16 secondary cities as dashed lines. It opens on Mesa and Phoenix; use the city check boxes, or Select All and Clear All, to choose which cities are shown.

Hover over a line to see the exact figure for that day.