
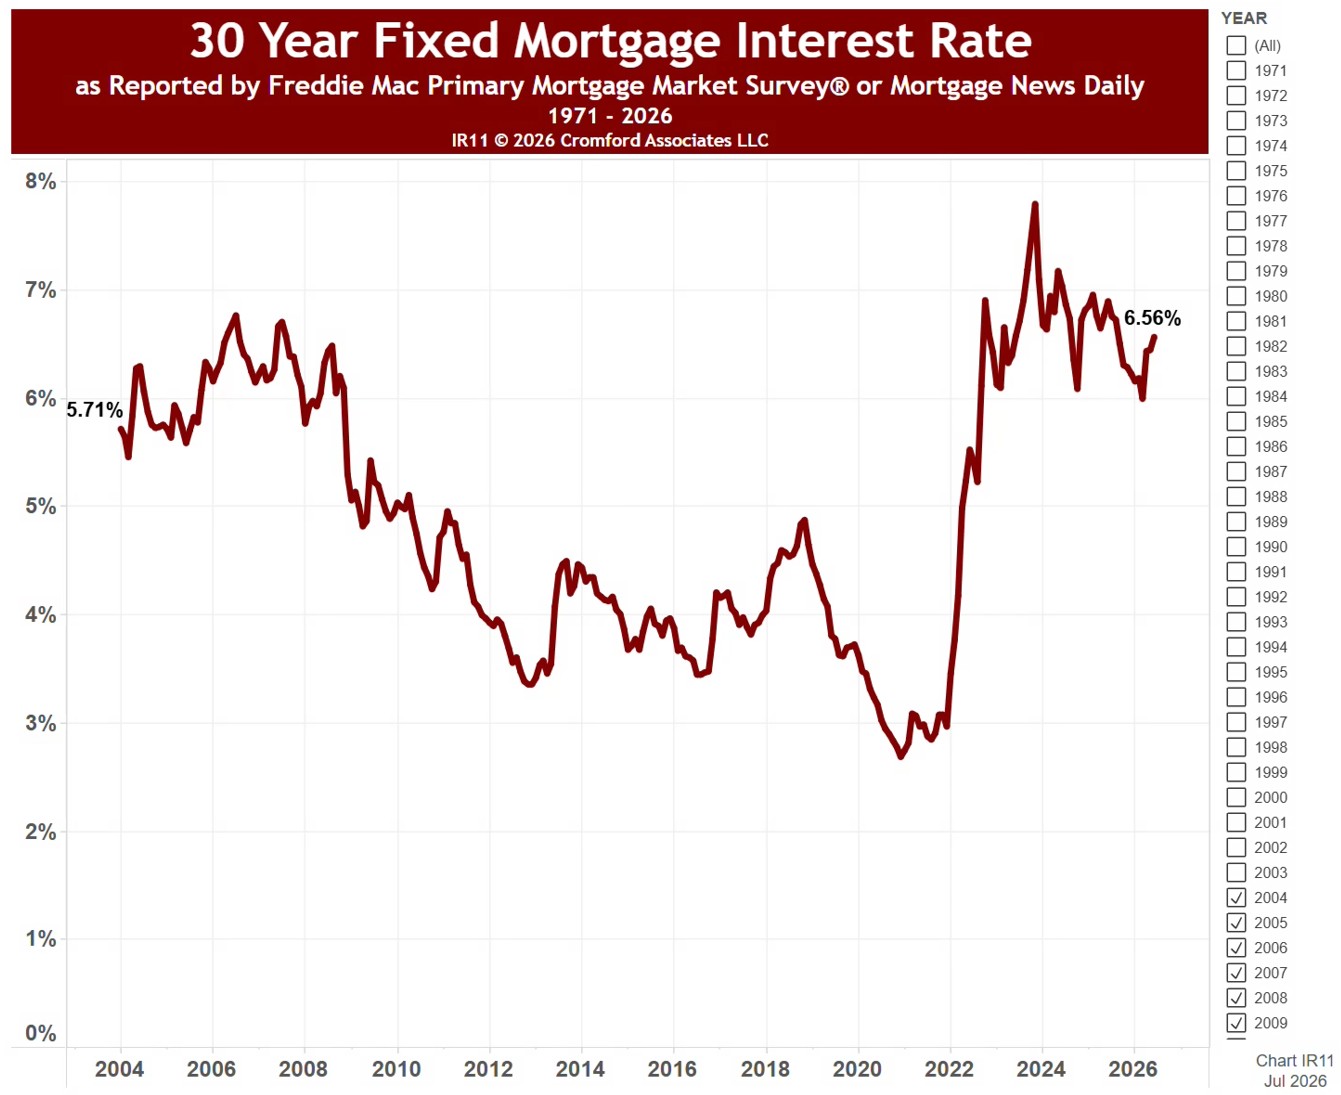
About this chart
This chart shows the average 30-year fixed mortgage rate each month since April 1971, as reported by the Freddie Mac Primary Mortgage Market Survey®. The line under the title gives the latest rate and the lowest and highest for the months shown.
It opens on the whole history; use the Recording Month range to zoom in on any stretch of months, and the line under the title updates to match.
Rates feed straight into what buyers can afford: on the same budget, a higher rate means a smaller loan. Hover over the line to see the rate for any month.