About this chart
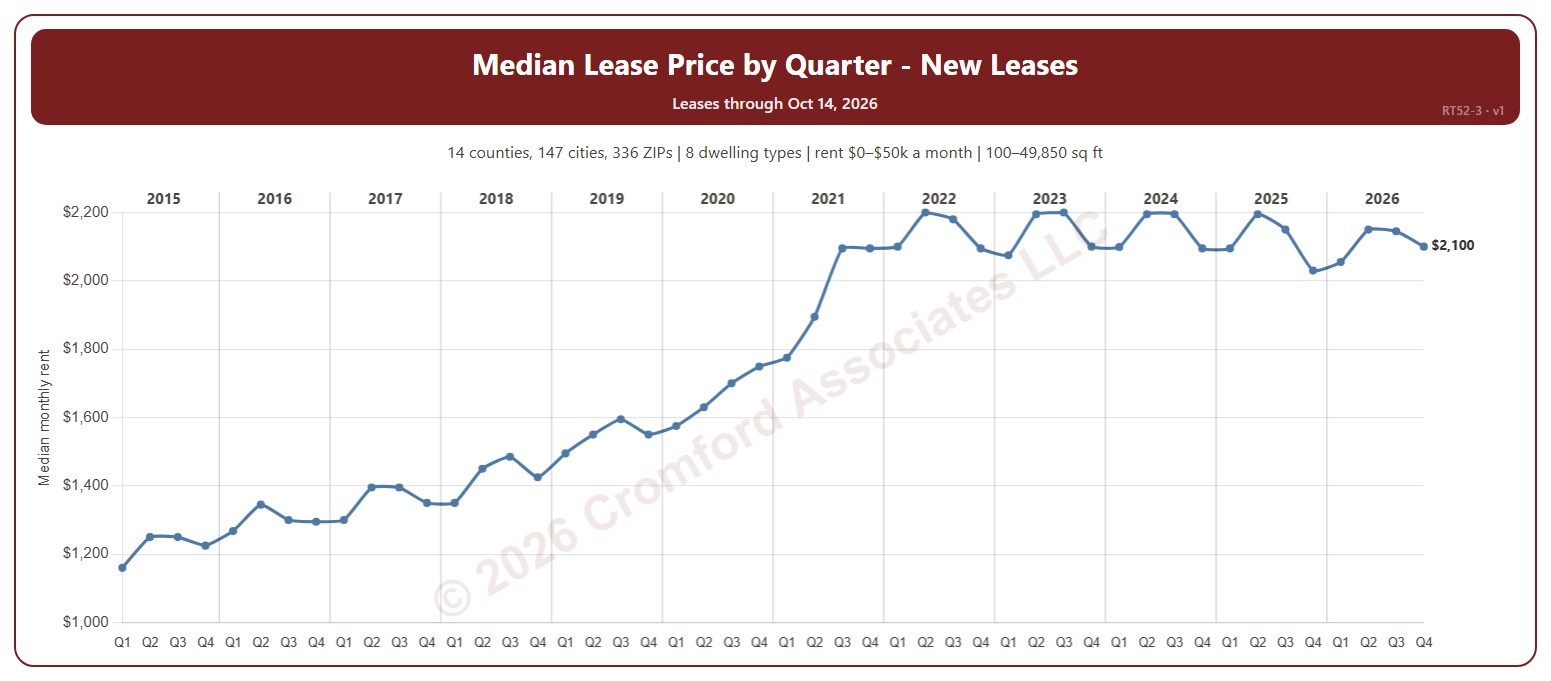
This chart shows the median monthly rent of the homes leased each quarter. It covers residential rentals leased through ARMLS, using the monthly rent each lease closed at, and places each lease in the month its tenancy starts.
It opens on 2015 to date; tick other years in the Year panel to go back as far as 2001. The newest quarter is the quarter so far.
It opens on every area in ARMLS; tick or untick counties, cities, and ZIP codes to narrow it. Narrow it further with the Dwelling Type and Furnished boxes and the monthly rent, home size, and year built sliders.
Hover over the chart to see the figures for that quarter.