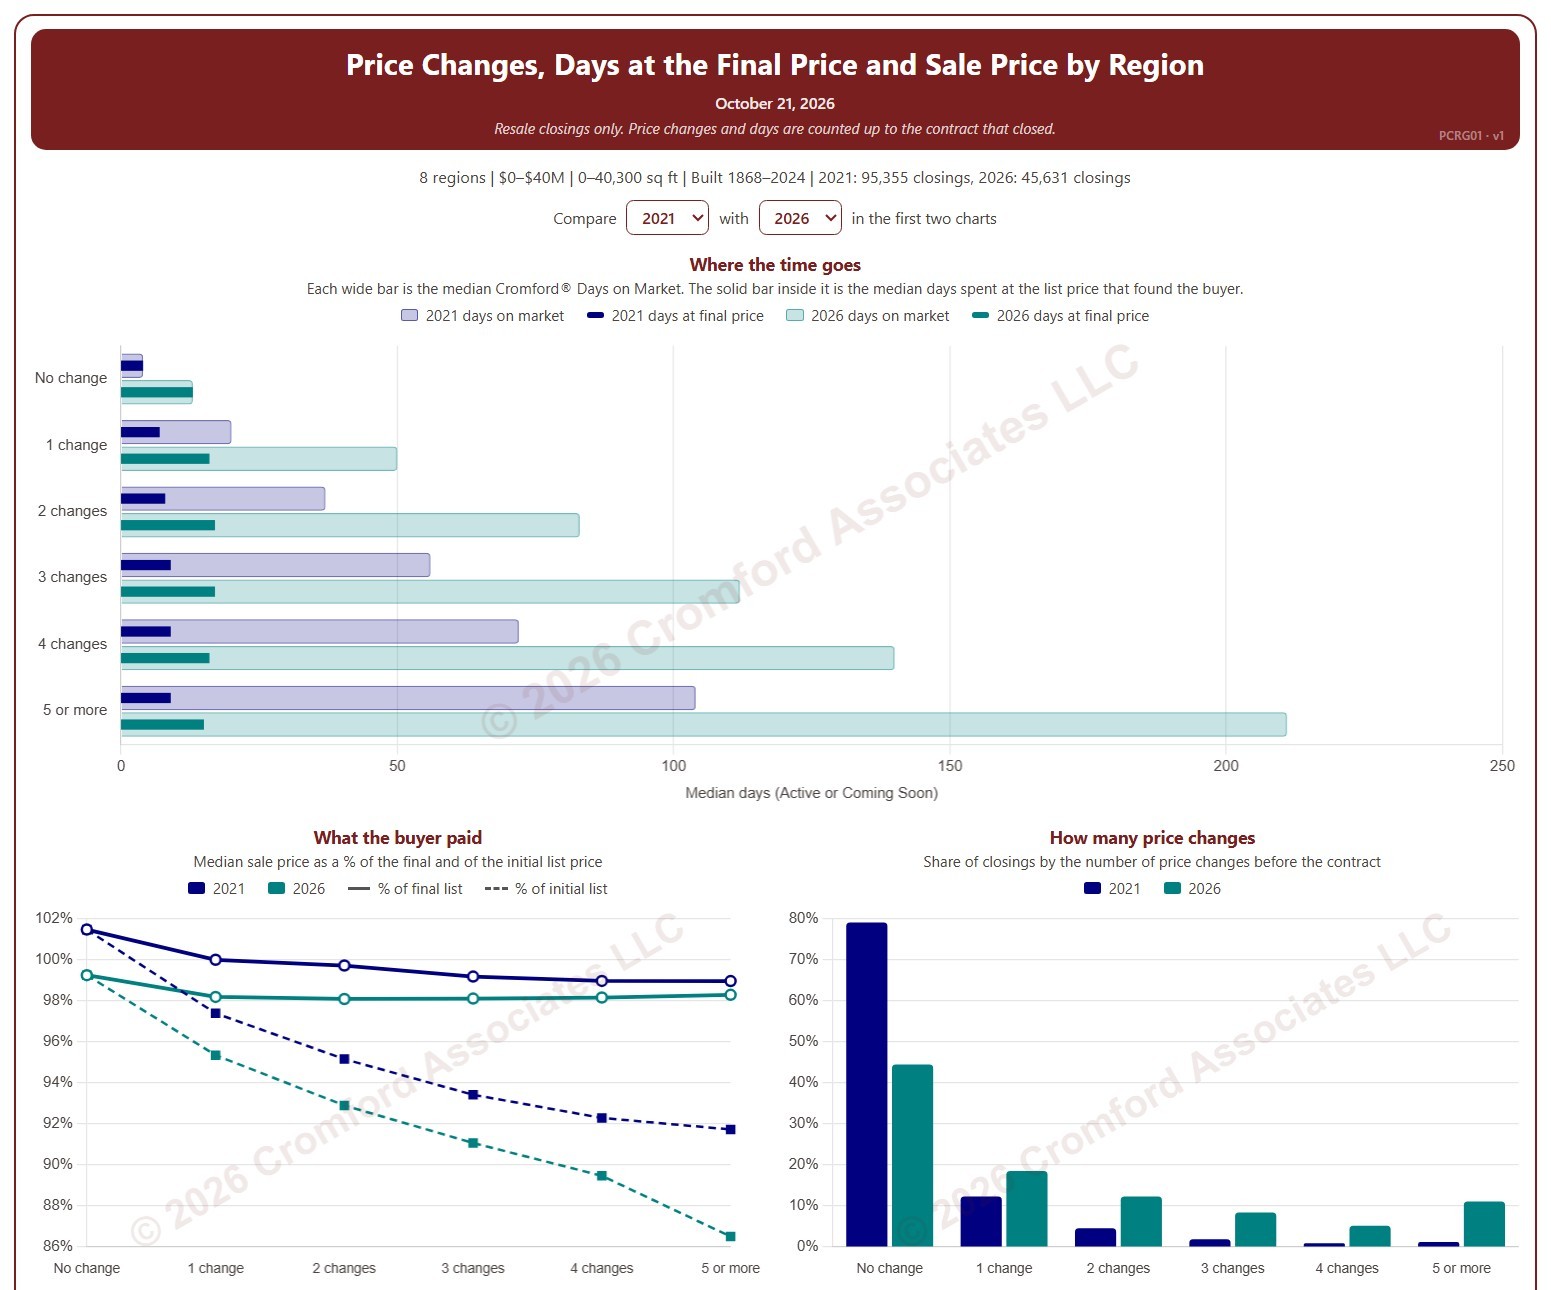
Price Changes, Days at the Final Price and Sale Price by Region

About this chart

This chart shows how many times homes changed their list price before going under contract, and what that meant for how long they took to sell and the price they sold for, by region. Each closed resale is grouped by the number of list price changes before the contract that closed, from none to five or more. Price increases and price cuts both count as a change.

The top chart compares two figures for each group. The wide bar is the median Cromford® Days on Market. The solid bar inside it is the median number of days the home spent at its final list price, the price that found the buyer. However long a home was on the market, the time it spent at the price that sold it is usually much shorter.

The top two charts compare any two years from 2020 on, picked with the selectors above them. The lower left chart shows the median sale price as a percentage of the final list price (solid line) and of the initial list price (dashed line). The lower right chart shows the share of closings in each group for the years ticked in the Year panel.

The map shades every ZIP code with its region’s figure for one year at a time, chosen with the year selector above it, so each region reads as one block. A few ZIP codes lie in two regions; they are striped in both regions’ shades and their closings count in both. Regions not ticked in the Region panel are faded. Click a ZIP code to show its region alone in the charts.

Days count while the home was Active or Coming Soon, up to the contract that closed. A contract that fell through does not reset the count. New construction is excluded. Years are by closing date, and the current year is year to date. The chart opens on 2021 and the current year in the Greater Phoenix regions, with manufactured and modular homes left out.
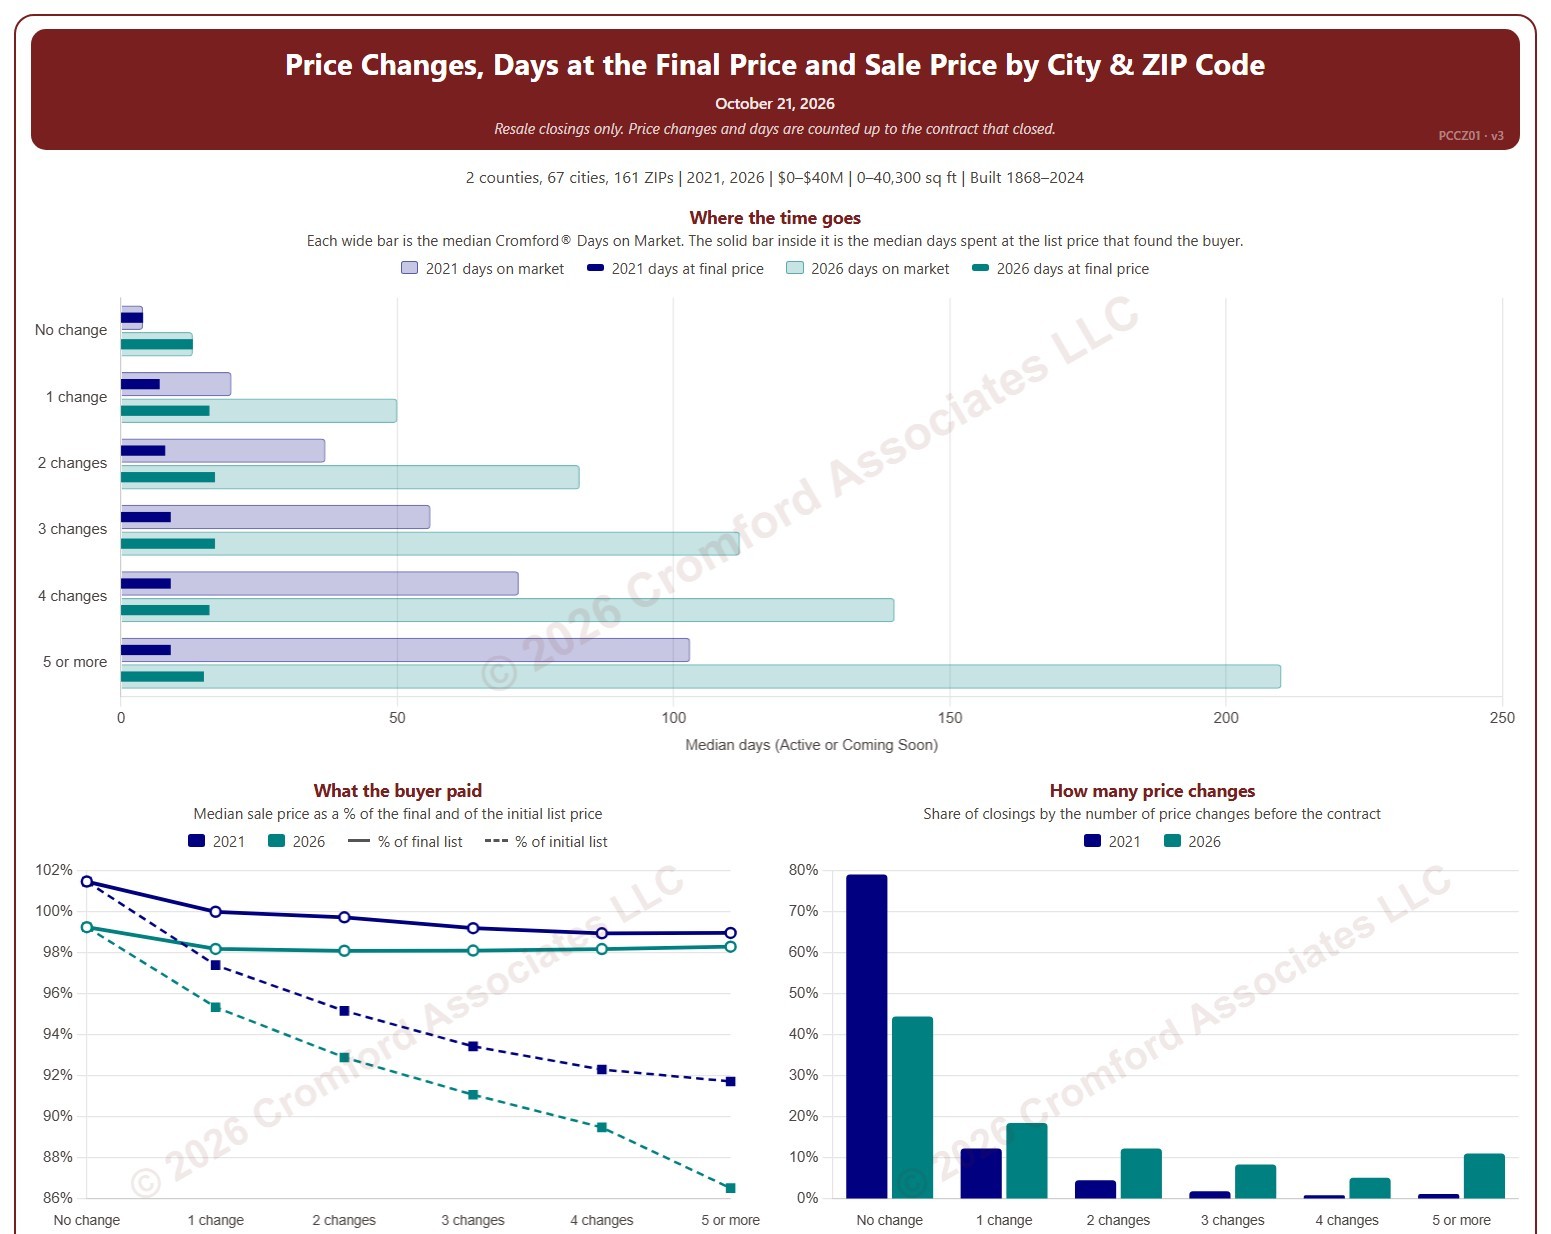
Price Changes, Days at the Final Price and Sale Price by City and ZIP Code

About this chart

This chart shows how many times homes changed their list price before going under contract, and what that meant for how long they took to sell and the price they sold for. Each closed resale is grouped by the number of list price changes before the contract that closed, from none to five or more. Price increases and price cuts both count as a change.

The top chart compares two figures for each group. The wide bar is the median Cromford® Days on Market. The solid bar inside it is the median number of days the home spent at its final list price, the price that found the buyer. However long a home was on the market, the time it spent at the price that sold it is usually much shorter.

The top two charts compare any two years from 2020 on, picked with the selectors above them. The lower left chart shows the median sale price as a percentage of the final list price (solid line) and of the initial list price (dashed line). The lower right chart shows the share of closings in each group for the years ticked in the Year panel.

The map shades each ZIP code for one year at a time, chosen with the year selector above it. ZIP codes with fewer than 20 closings are shown in gray. Click a ZIP code to show it alone in the charts.

Days count while the home was Active or Coming Soon, up to the contract that closed. A contract that fell through does not reset the count. New construction is excluded. Years are by closing date, and the current year is year to date. The chart opens on 2021 and the current year in Maricopa and Pinal counties, with manufactured and modular homes left out.

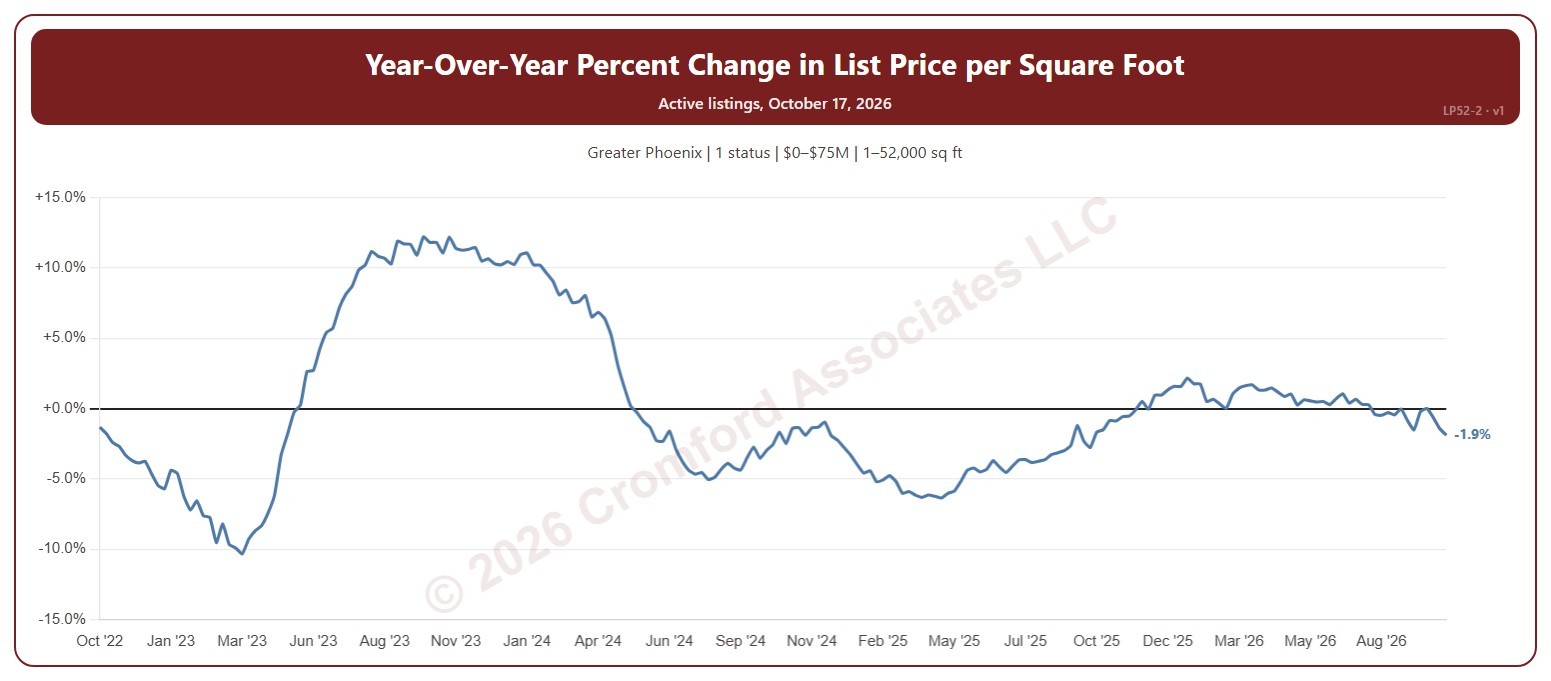
Year-over-Year Percent Change in List Price per Square Foot – Active Listings

About this chart

This chart shows how the average asking price per square foot of the homes for sale compares with the same Saturday a year earlier, as a percentage. The average is the total asking price of the active listings divided by their total square feet, taken every Saturday, so larger homes count for more.

It opens on the last 4 years; choose a longer period in the Period box, back to 2012. The chart is updated every day.

It opens on the Greater Phoenix area and on Active listings; tick UCB / CCBS or Coming Soon in the Status box to add them. Tick or untick counties, cities, and ZIP codes to change the area, including counties beyond Greater Phoenix. Narrow it further with the Dwelling Type, Transaction Type, and New / Resale boxes and the list price, home size, year built, and days on market sliders.

Hover over the line to see the change and the two prices per square foot it compares, each with its Saturday.