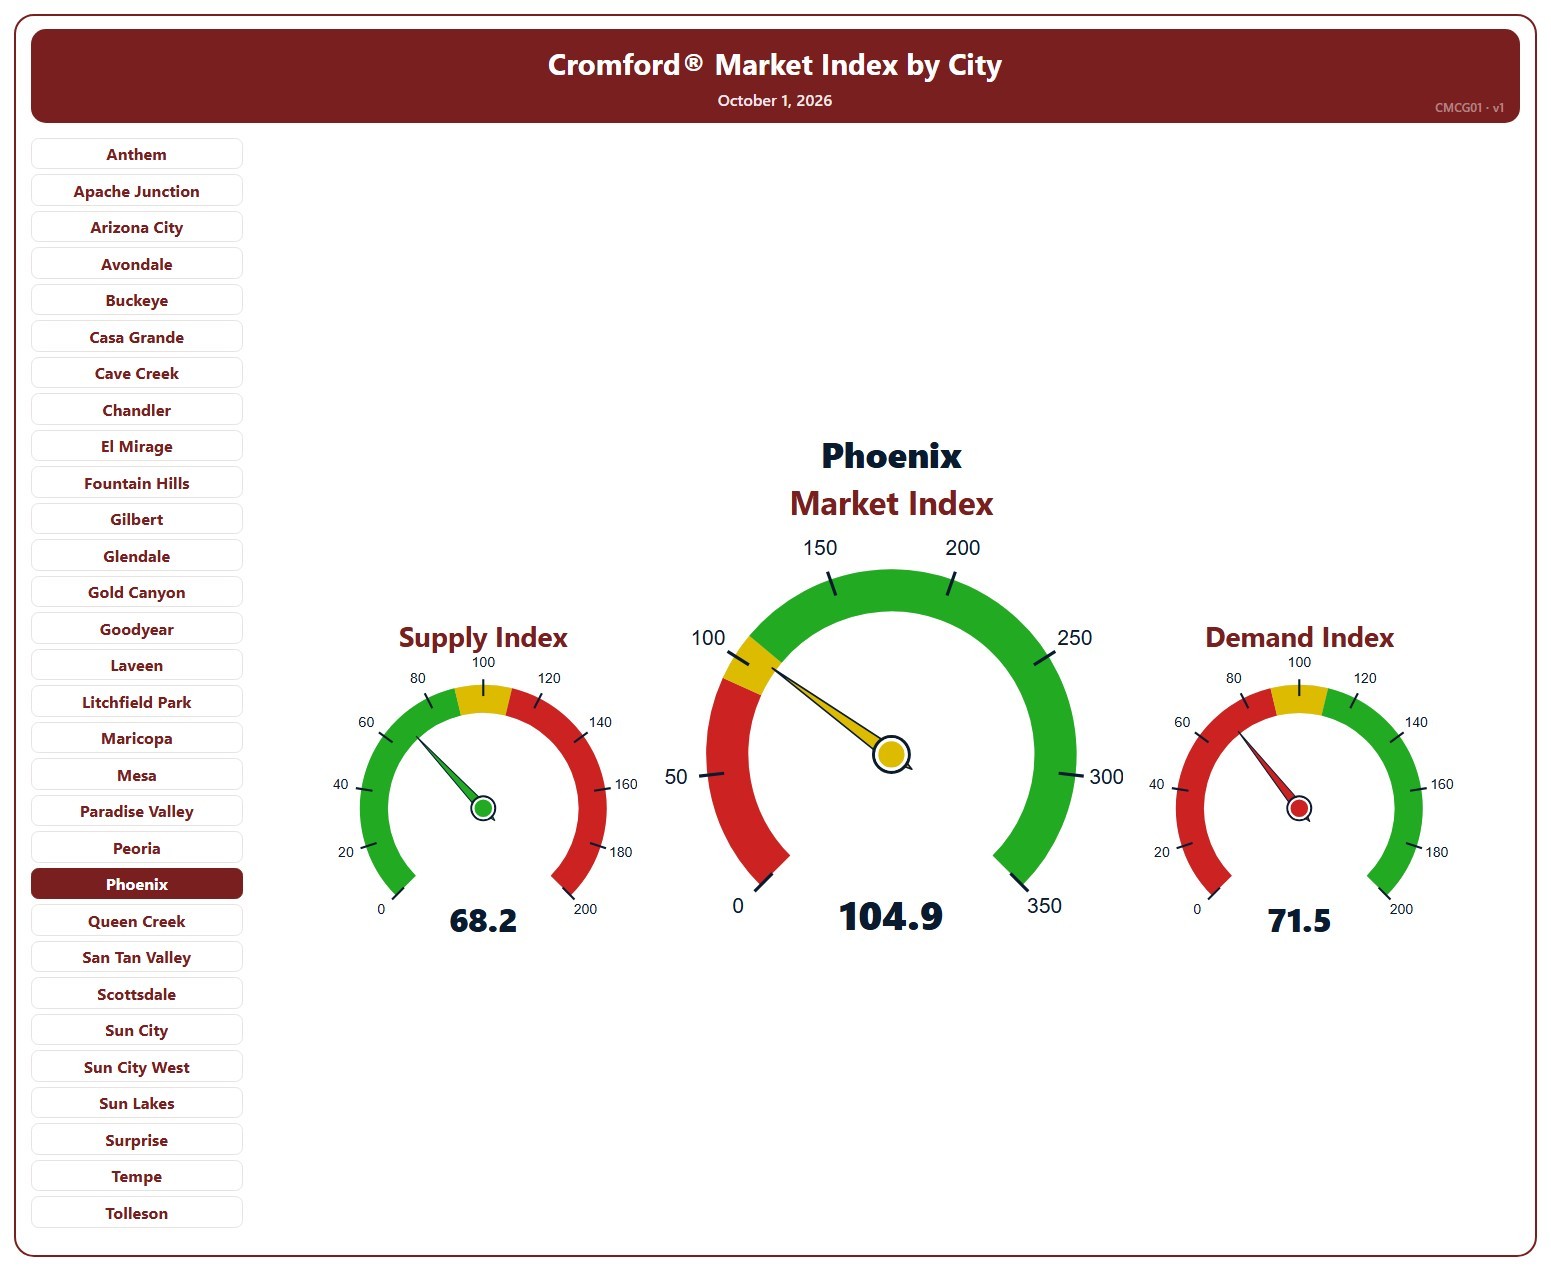
Cromford® Market Index by City – Gauges

About this chart

This page shows three gauges for one city: the Cromford® Supply Index, Market Index, and Demand Index at their latest reading, for single-family detached resale homes on ARMLS. It opens on Phoenix; pick any of the 34 cities from the list.

Each dial has three bands, below 90, 90 to 110, and above 110, and the needle takes the color of the band it points into. On the Market and Demand dials green is above 110 and red below 90; on the Supply dial the colors are reversed, because low supply favors sellers.

A Market Index below 90 indicates a buyer’s market, above 110 a seller’s market, and between 90 and 110 a balanced market.
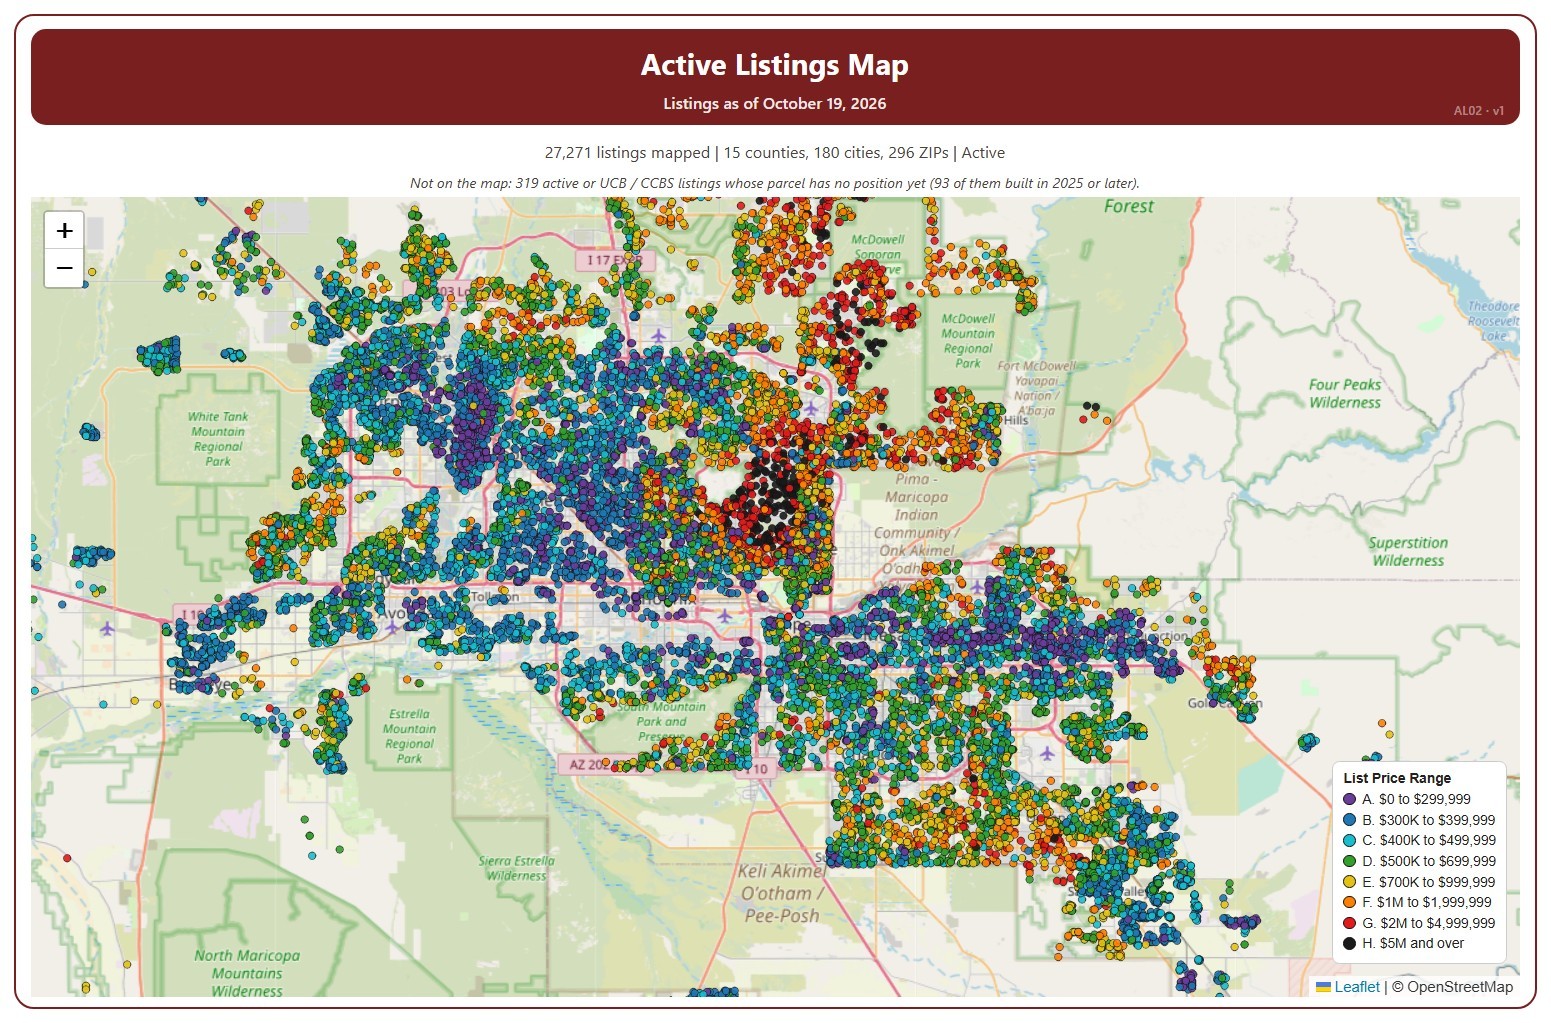
Active Listings Map

About this chart

This map shows every home listed for sale or coming soon on ARMLS across Arizona today, one dot per listing, coloured by its list price range, from A (under $300,000) to H ($5 million and over).

It opens on Active and Coming Soon listings in every county; tick UCB / CCBS in the Status box to add listings under contract with a contingency. Tick or untick counties, cities, and ZIP codes to change the area, and use the Price Range boxes to show or hide a range. The map is updated every day.

Narrow it further with the Dwelling Type, Transaction Type, and New / Resale boxes and the list price, home size, year built, and days on market sliders. A listing whose parcel has no map position yet is not shown; the note above the map says how many.

Hover over a dot to see the address, list price, status, dwelling and transaction type, size, year built, days on market, and listing office.