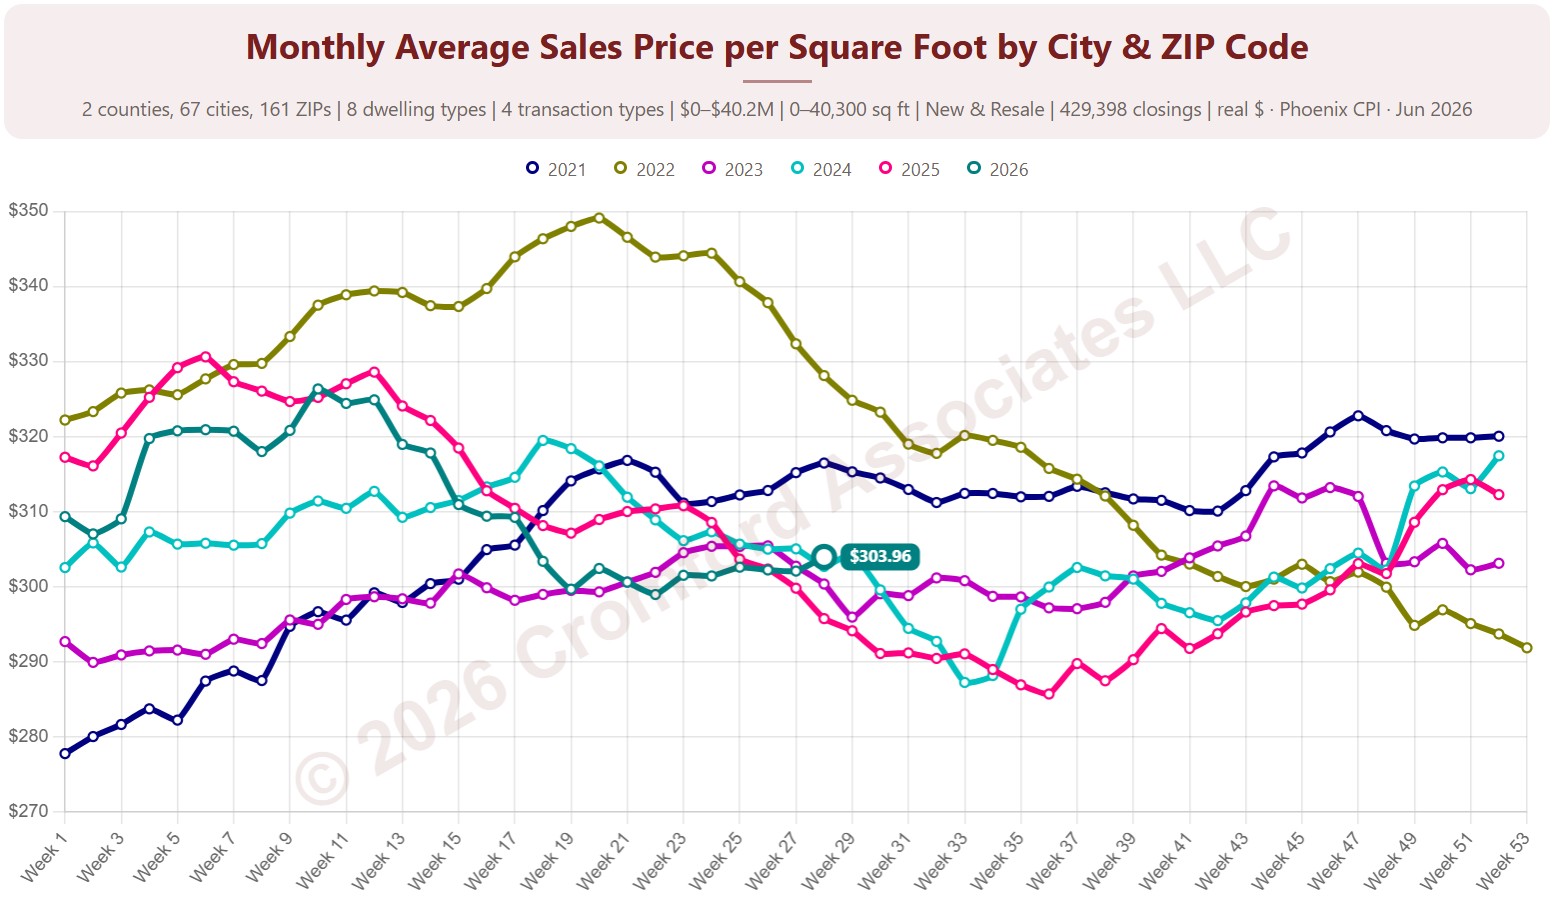
Monthly Average Sales Price per Square Foot by City & ZIP Code

About this chart

This chart shows the average sales price per square foot of homes that closed through ARMLS, measured every week. Each point covers the homes that closed in the month up to that week. Price per square foot lets you compare homes of different sizes; this is the true average across all the square feet sold.

Each year has its own line, laid out by week of the year, so you can compare this year with earlier years at the same point in the season. It opens on the last three years; tick any year back to 2001 in the Year panel.

It opens on Maricopa and Pinal Counties with every city and ZIP code included. Use the County, City, and ZIP panels to focus on any area, from a whole county down to a single ZIP code. Narrow it with the Dwelling Type, Transaction Type, and New / Resale boxes and the sales price, home size, and year built sliders. The Inflation (CPI) option restates prices in today’s dollars using national or Phoenix inflation.

Hover over a line to see the exact figure for that week.
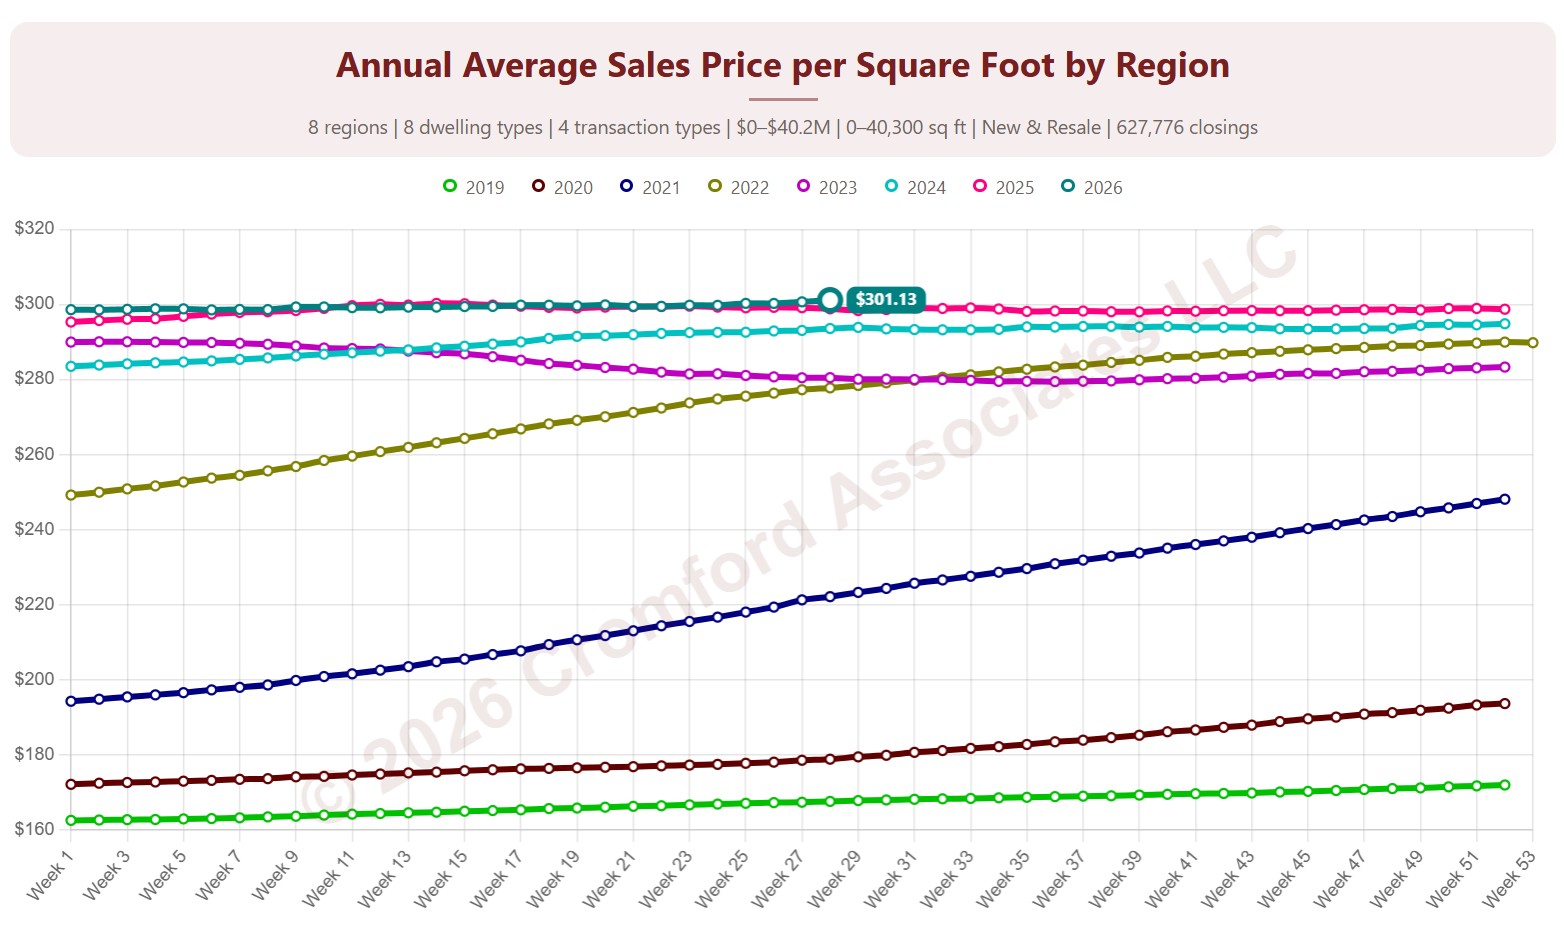
Annual Average Sales Price per Square Foot by Region

About this chart

This chart shows the average sales price per square foot of homes that closed through ARMLS, measured every week. Each point covers the homes that closed in the 12 months up to that week. Price per square foot lets you compare homes of different sizes; this is the true average across all the square feet sold.

Each year has its own line, laid out by week of the year, so you can compare this year with earlier years at the same point in the season. It opens on the last three years; tick any year back to 2001 in the Year panel.

It opens with every region included. Use the Region panel to focus on one region or compare a combination of them. Narrow it with the Dwelling Type, Transaction Type, and New / Resale boxes and the sales price, home size, and year built sliders. The Inflation (CPI) option restates prices in today’s dollars using national or Phoenix inflation.

Hover over a line to see the exact figure for that week.
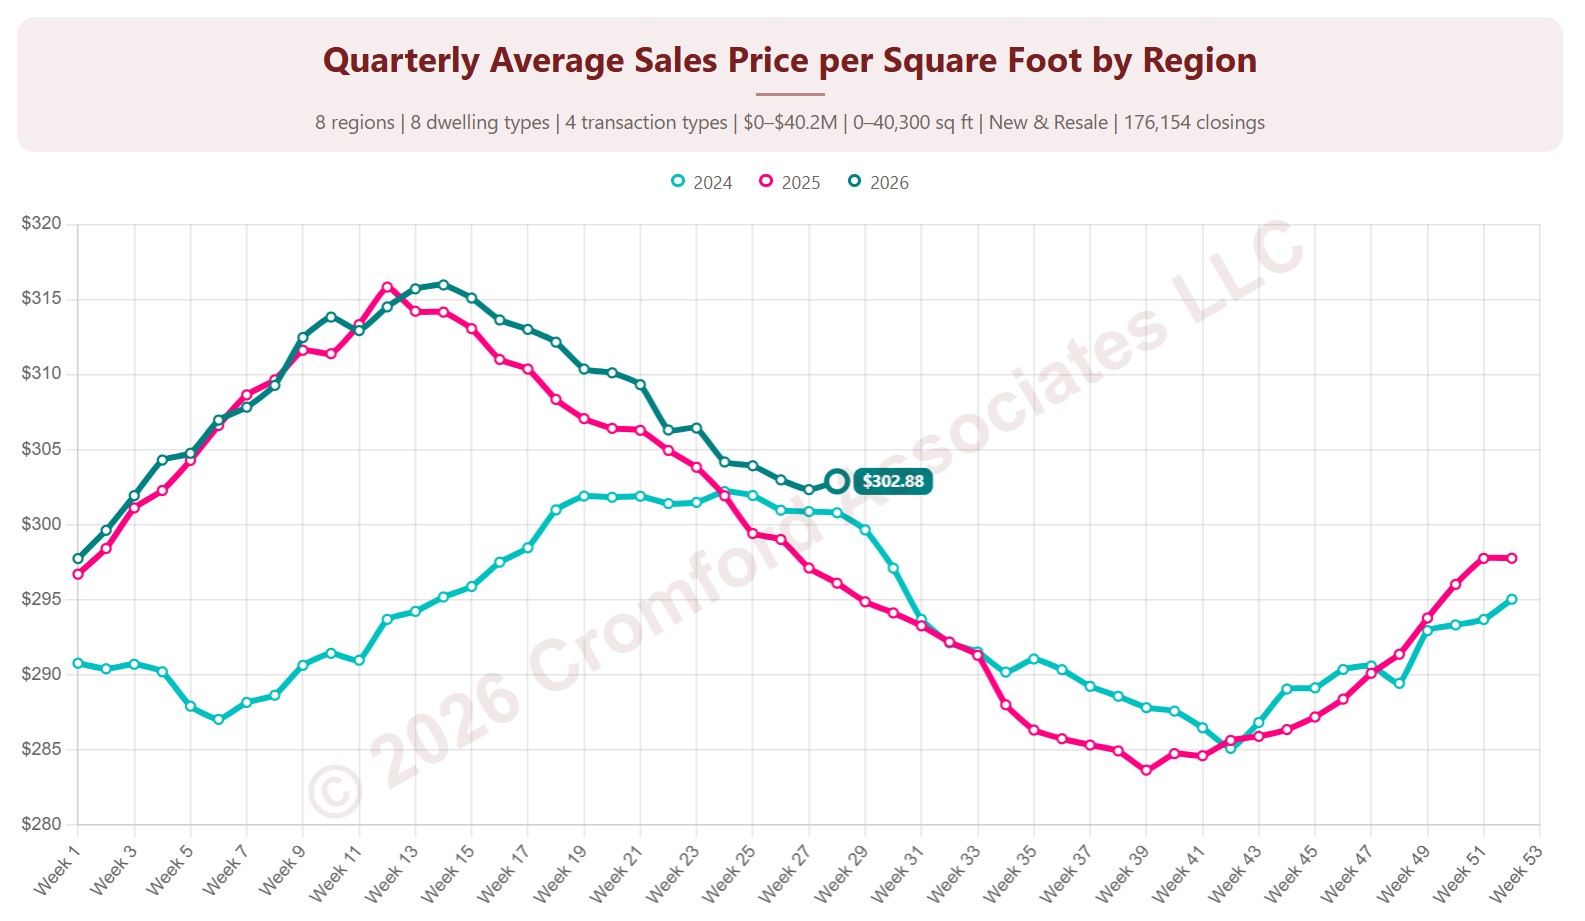
Quarterly Average Price per Square Foot by Region

About this chart

This chart shows the average sales price per square foot of homes that closed through ARMLS, measured every week. Each point covers the homes that closed in the three months up to that week. Price per square foot lets you compare homes of different sizes; this is the true average across all the square feet sold.

Each year has its own line, laid out by week of the year, so you can compare this year with earlier years at the same point in the season. It opens on the last three years; tick any year back to 2001 in the Year panel.

It opens with every region included. Use the Region panel to focus on one region or compare a combination of them. Narrow it with the Dwelling Type, Transaction Type, and New / Resale boxes and the sales price, home size, and year built sliders. The Inflation (CPI) option restates prices in today’s dollars using national or Phoenix inflation.

Hover over a line to see the exact figure for that week.
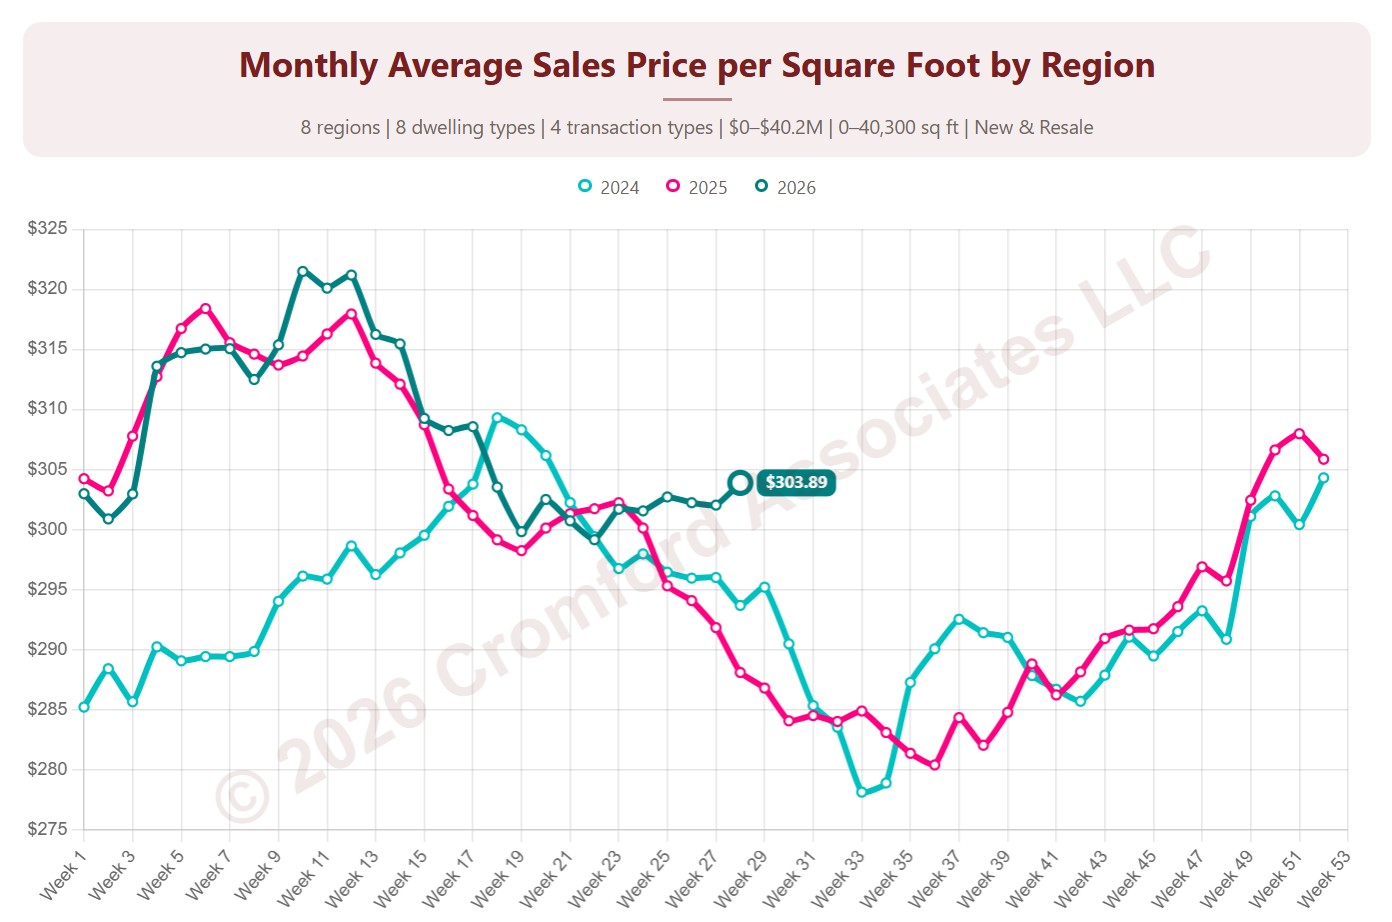
Monthly Average Sales Price per Square Foot by Region

About this chart

This chart shows the average sales price per square foot of homes that closed through ARMLS, measured every week. Each point covers the homes that closed in the month up to that week. Price per square foot lets you compare homes of different sizes; this is the true average across all the square feet sold.

Each year has its own line, laid out by week of the year, so you can compare this year with earlier years at the same point in the season. It opens on the last three years; tick any year back to 2001 in the Year panel.

It opens with every region included. Use the Region panel to focus on one region or compare a combination of them. Narrow it with the Dwelling Type, Transaction Type, and New / Resale boxes and the sales price, home size, and year built sliders. The Inflation (CPI) option restates prices in today’s dollars using national or Phoenix inflation.

Hover over a line to see the exact figure for that week.
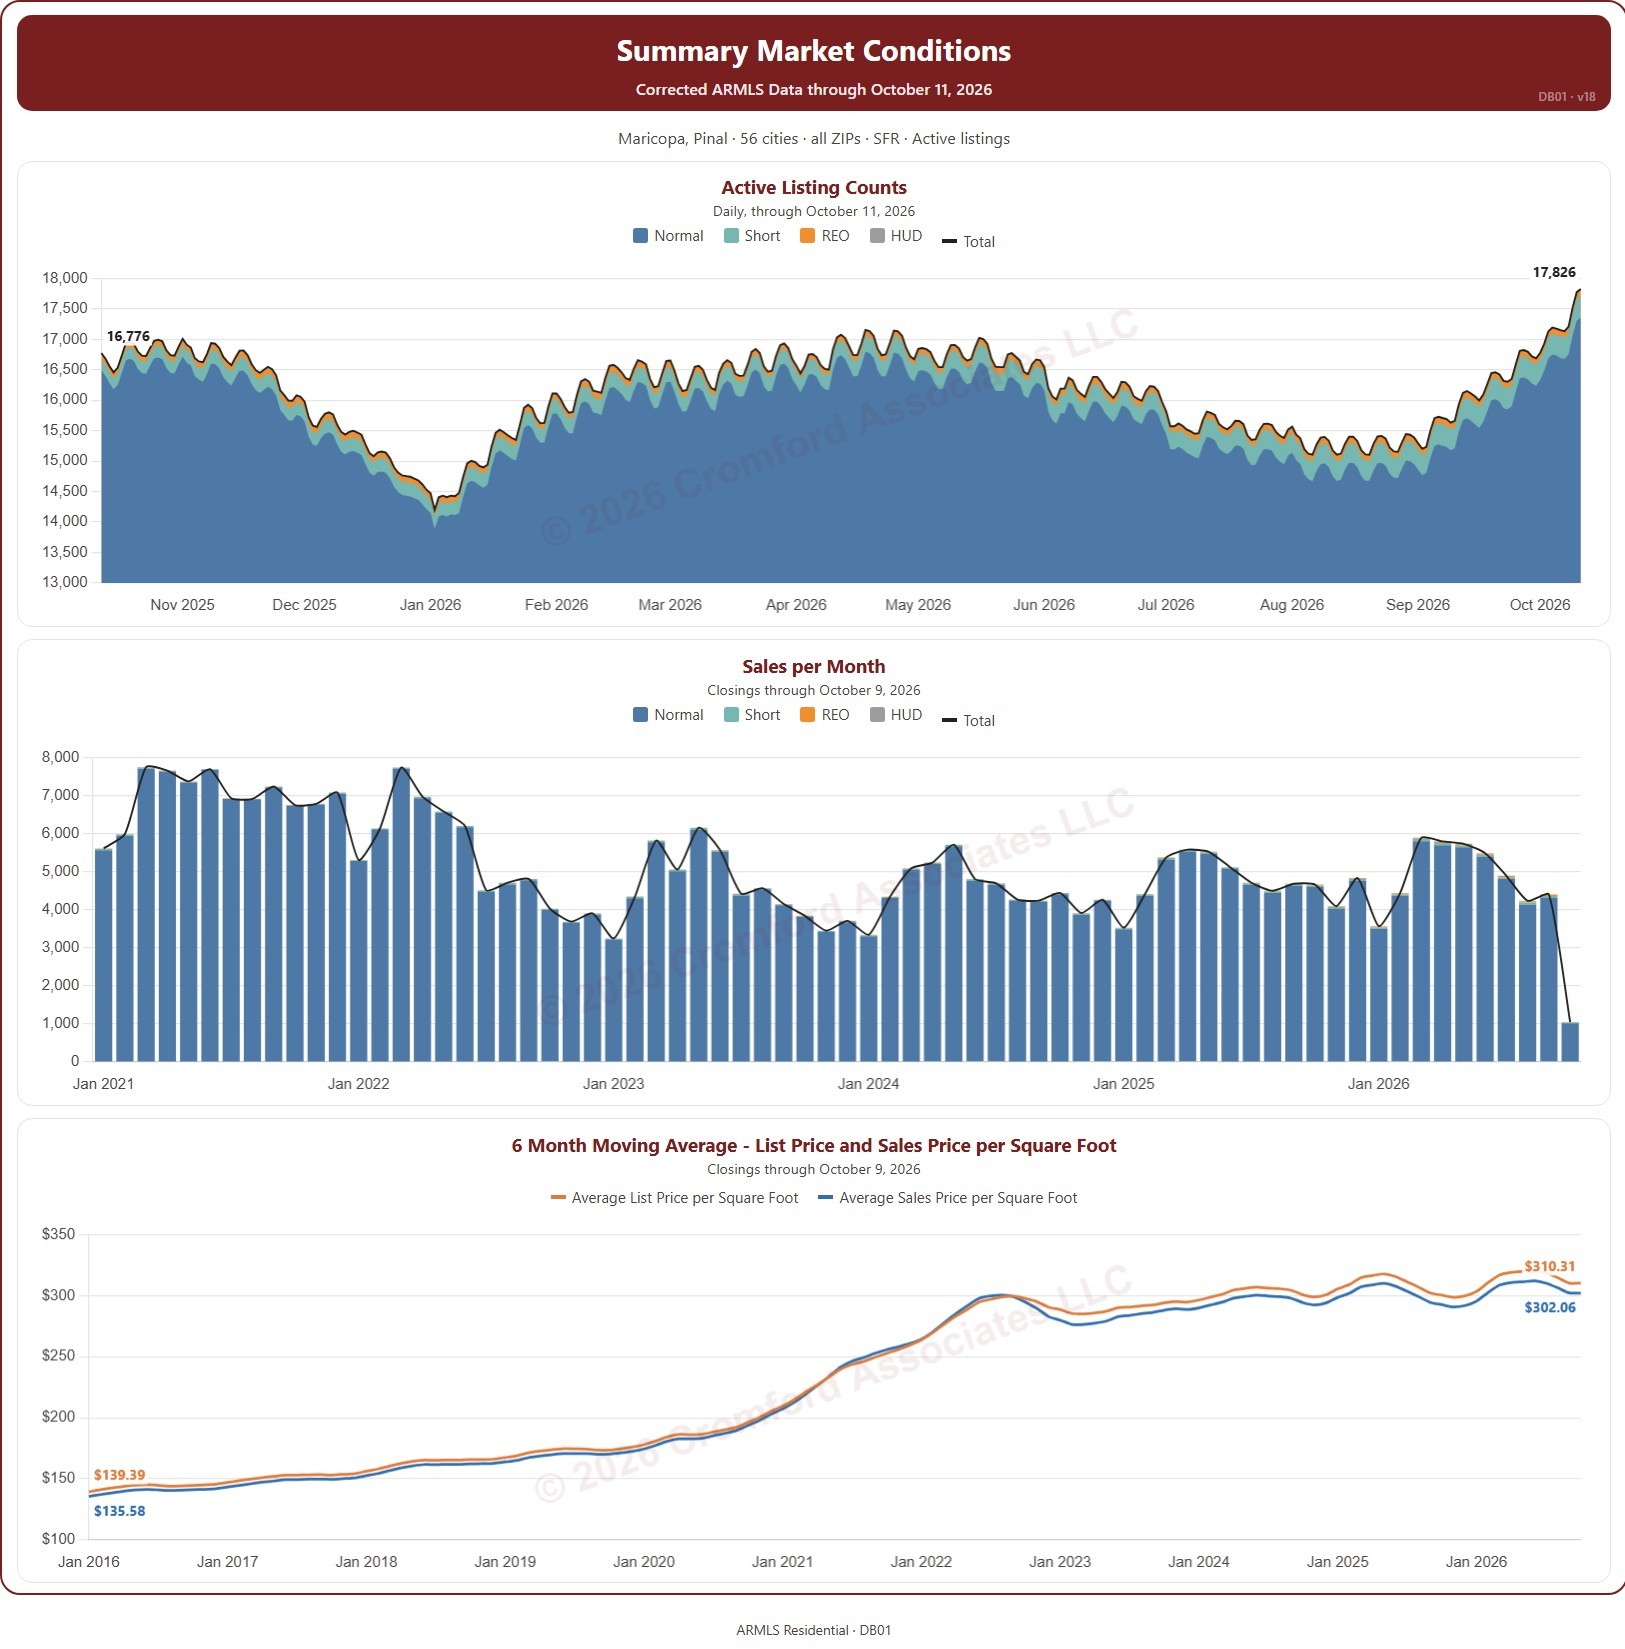
Listing Presentation Dashboard – with Price Filter

About this chart

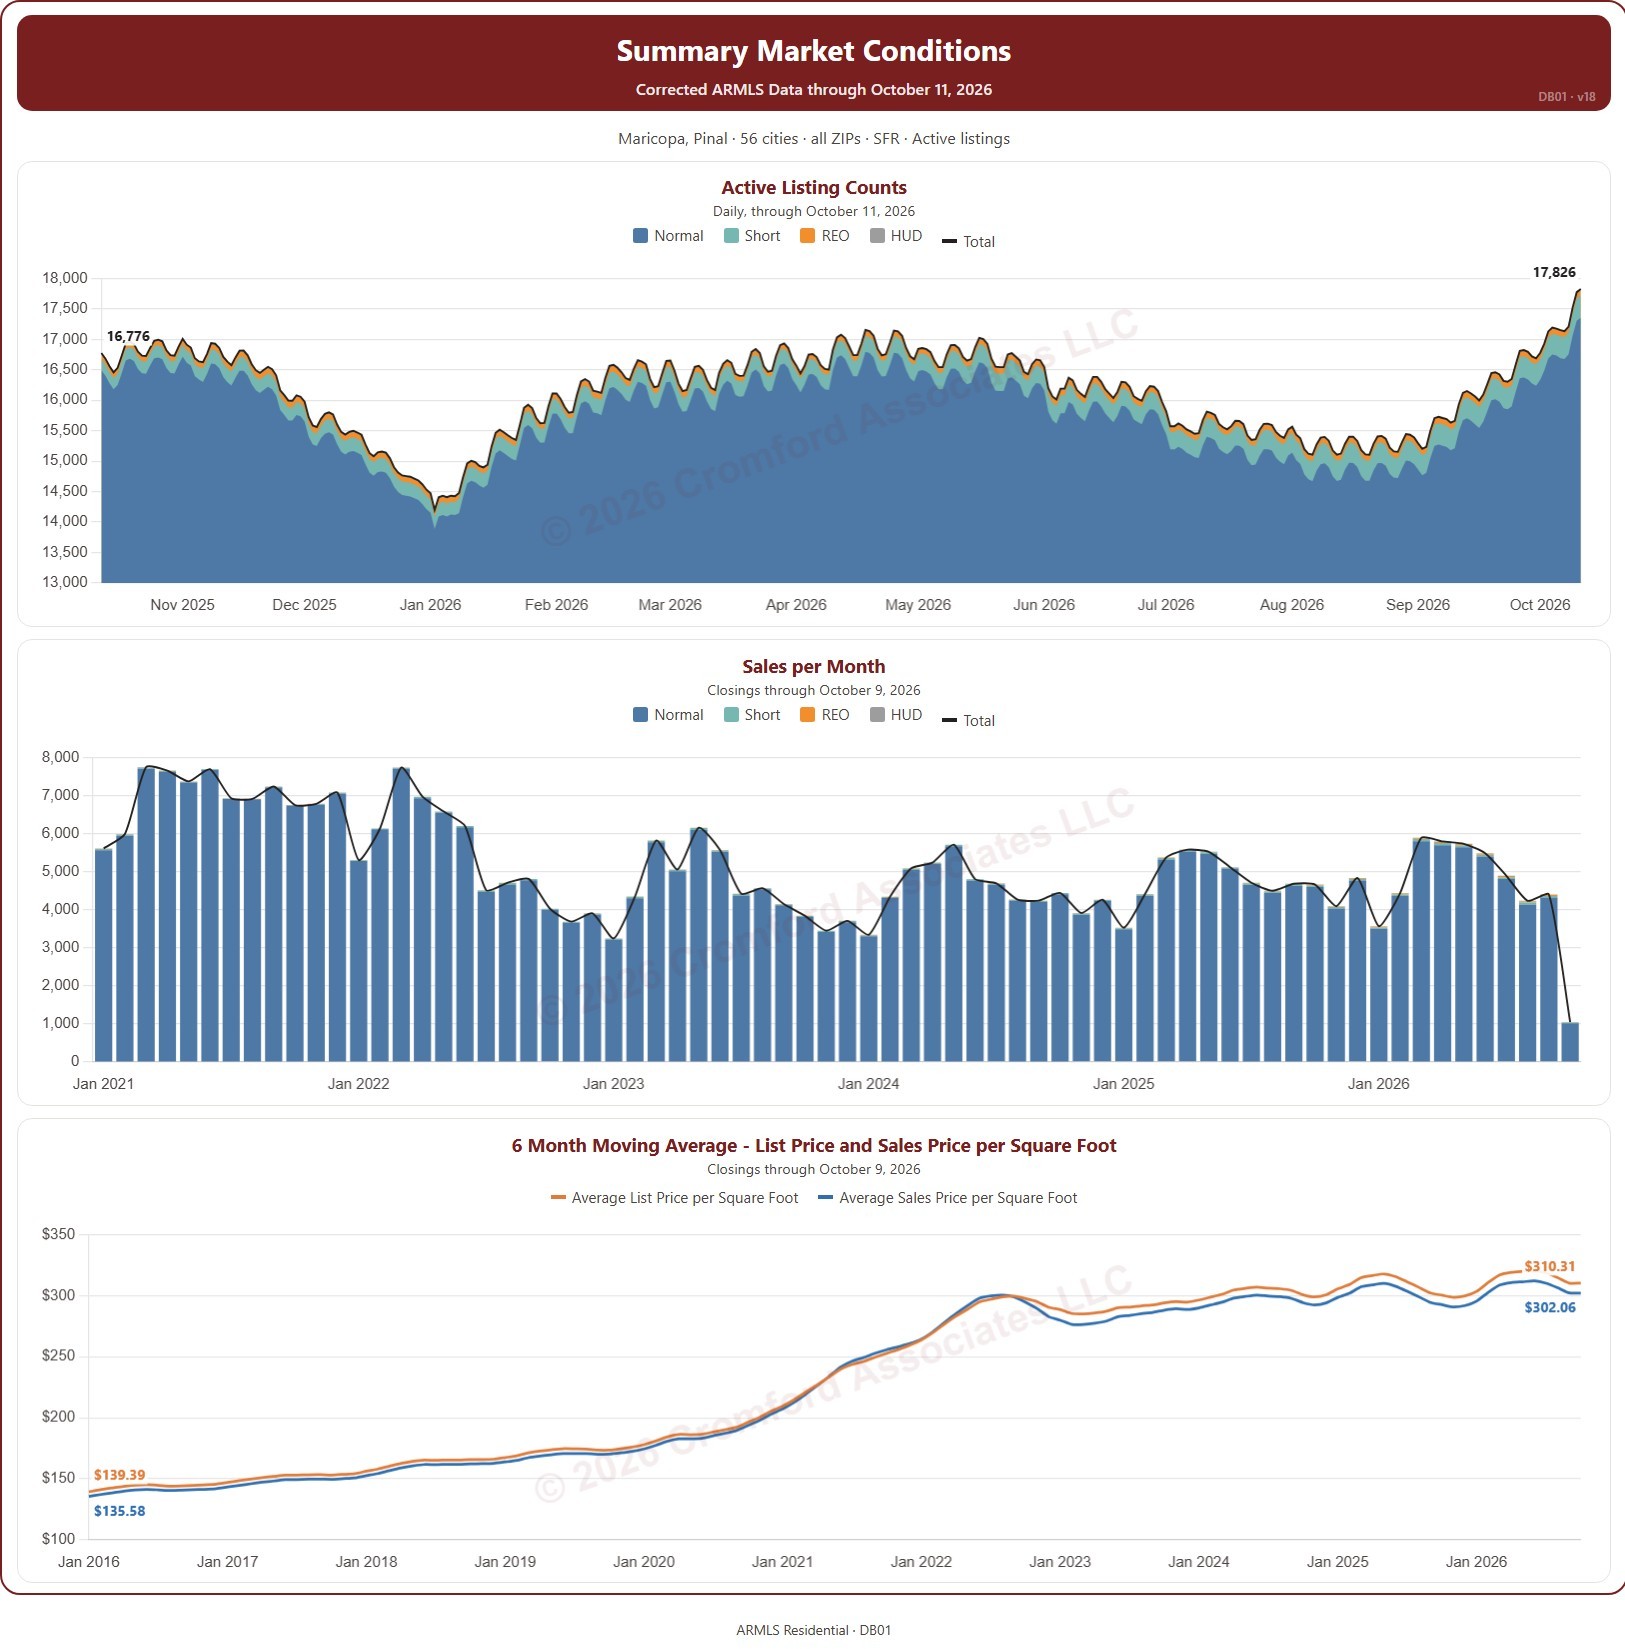
This dashboard puts three charts together for a listing presentation, for the area and type of home you choose: the number of active listings every day, split by transaction type (normal, short sale, REO, and HUD) with a total line; the number of closings each month; and the 6-month moving average of the list price and sale price per square foot.

Each chart has its own date range control beneath it. Active listings open on the last 12 months, closings on the months since January 2021 (back to January 2015 if you widen the range), and price per square foot on the months since January 2016.

It opens on the Greater Phoenix cities and ZIP codes of Maricopa and Pinal Counties, single-family homes, and Active listings. Use the County, City, and ZIP panels to focus on a client’s area, the Dwelling Type and Transaction Type boxes and the list price and square footage ranges to match their home, and Active Chart Status to add UCB / CCBS or Coming Soon listings to the first chart.

Fill in Your Details (name, contact, and company) and they are printed on the dashboard, so you can hand it to a client. Print fits the whole dashboard on one letter-size page. It is updated every day; the newest month of closings is the month so far.

Listing Presentation Dashboard – with Sq Ft Filter

Year-over-Year Percent Change in List Price per Square Foot – Active Listings

About this chart

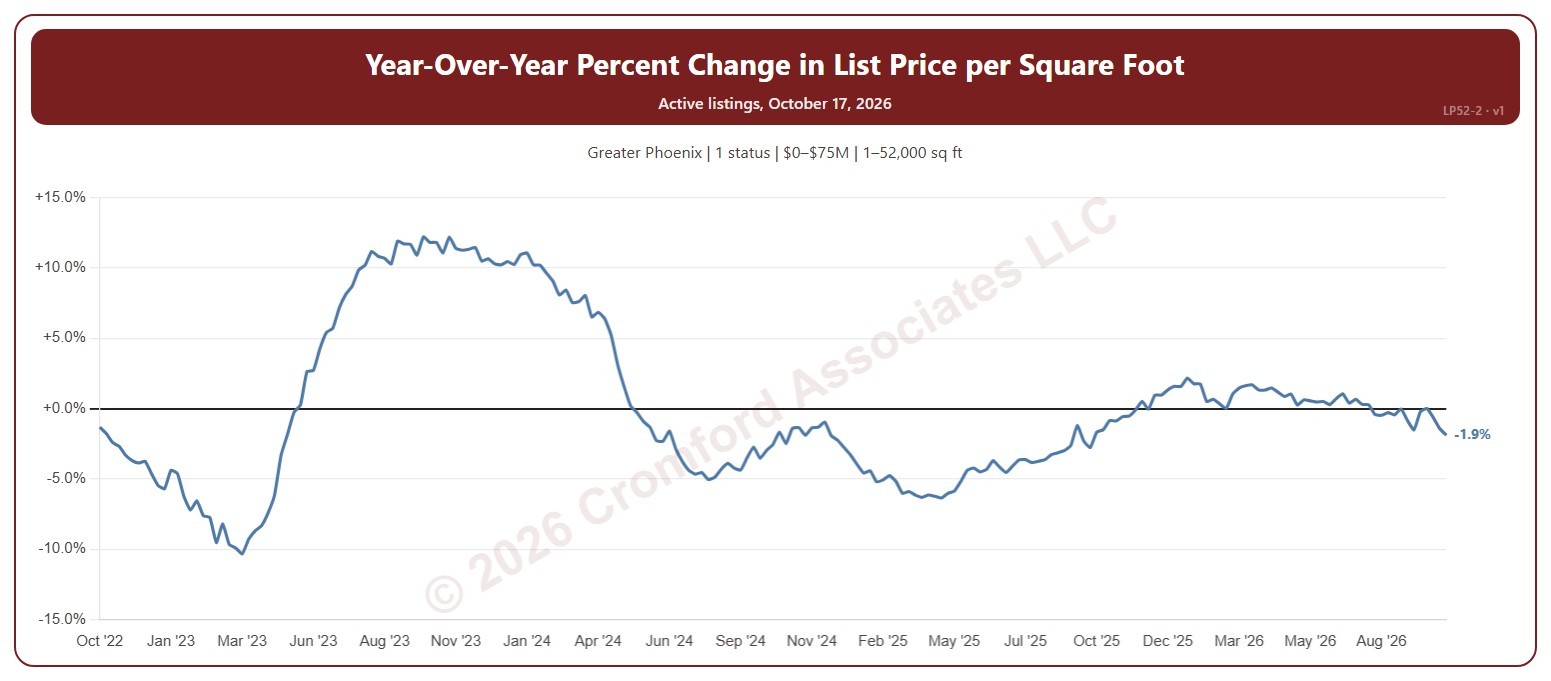
This chart shows how the average asking price per square foot of the homes for sale compares with the same Saturday a year earlier, as a percentage. The average is the total asking price of the active listings divided by their total square feet, taken every Saturday, so larger homes count for more.

It opens on the last 4 years; choose a longer period in the Period box, back to 2012. The chart is updated every day.

It opens on the Greater Phoenix area and on Active listings; tick UCB / CCBS or Coming Soon in the Status box to add them. Tick or untick counties, cities, and ZIP codes to change the area, including counties beyond Greater Phoenix. Narrow it further with the Dwelling Type, Transaction Type, and New / Resale boxes and the list price, home size, year built, and days on market sliders.

Hover over the line to see the change and the two prices per square foot it compares, each with its Saturday.

Average List Price per Square Foot – Active Listings

About this chart

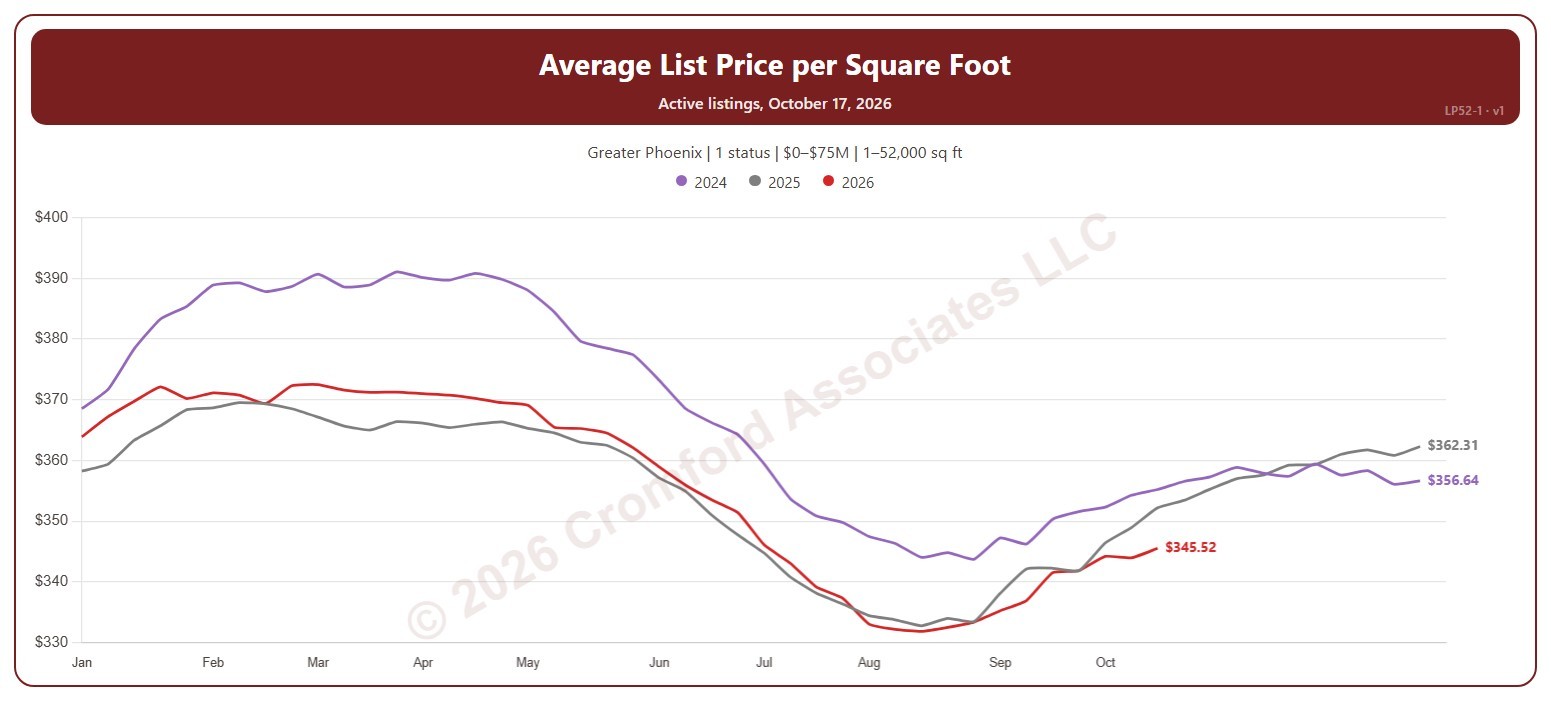
This chart shows the average asking price per square foot of the homes for sale, a line per year through the weeks of the year, so this year can be read against earlier years. The average is the total asking price of the active listings divided by their total square feet, taken every Saturday, so larger homes count for more.

It opens on the latest 3 years; tick other years in the Year box to go back as far as 2011. Click a ticked year again to fade it, and once more to remove it. The chart is updated every day.

It opens on the Greater Phoenix area and on Active listings; tick UCB / CCBS or Coming Soon in the Status box to add them. Tick or untick counties, cities, and ZIP codes to change the area, including counties beyond Greater Phoenix. Narrow it further with the Dwelling Type, Transaction Type, and New / Resale boxes and the list price, home size, year built, and days on market sliders.

Hover over the chart to see each year’s figure for that week and its Saturday.

Quarterly Average Price per Square Foot

About this chart

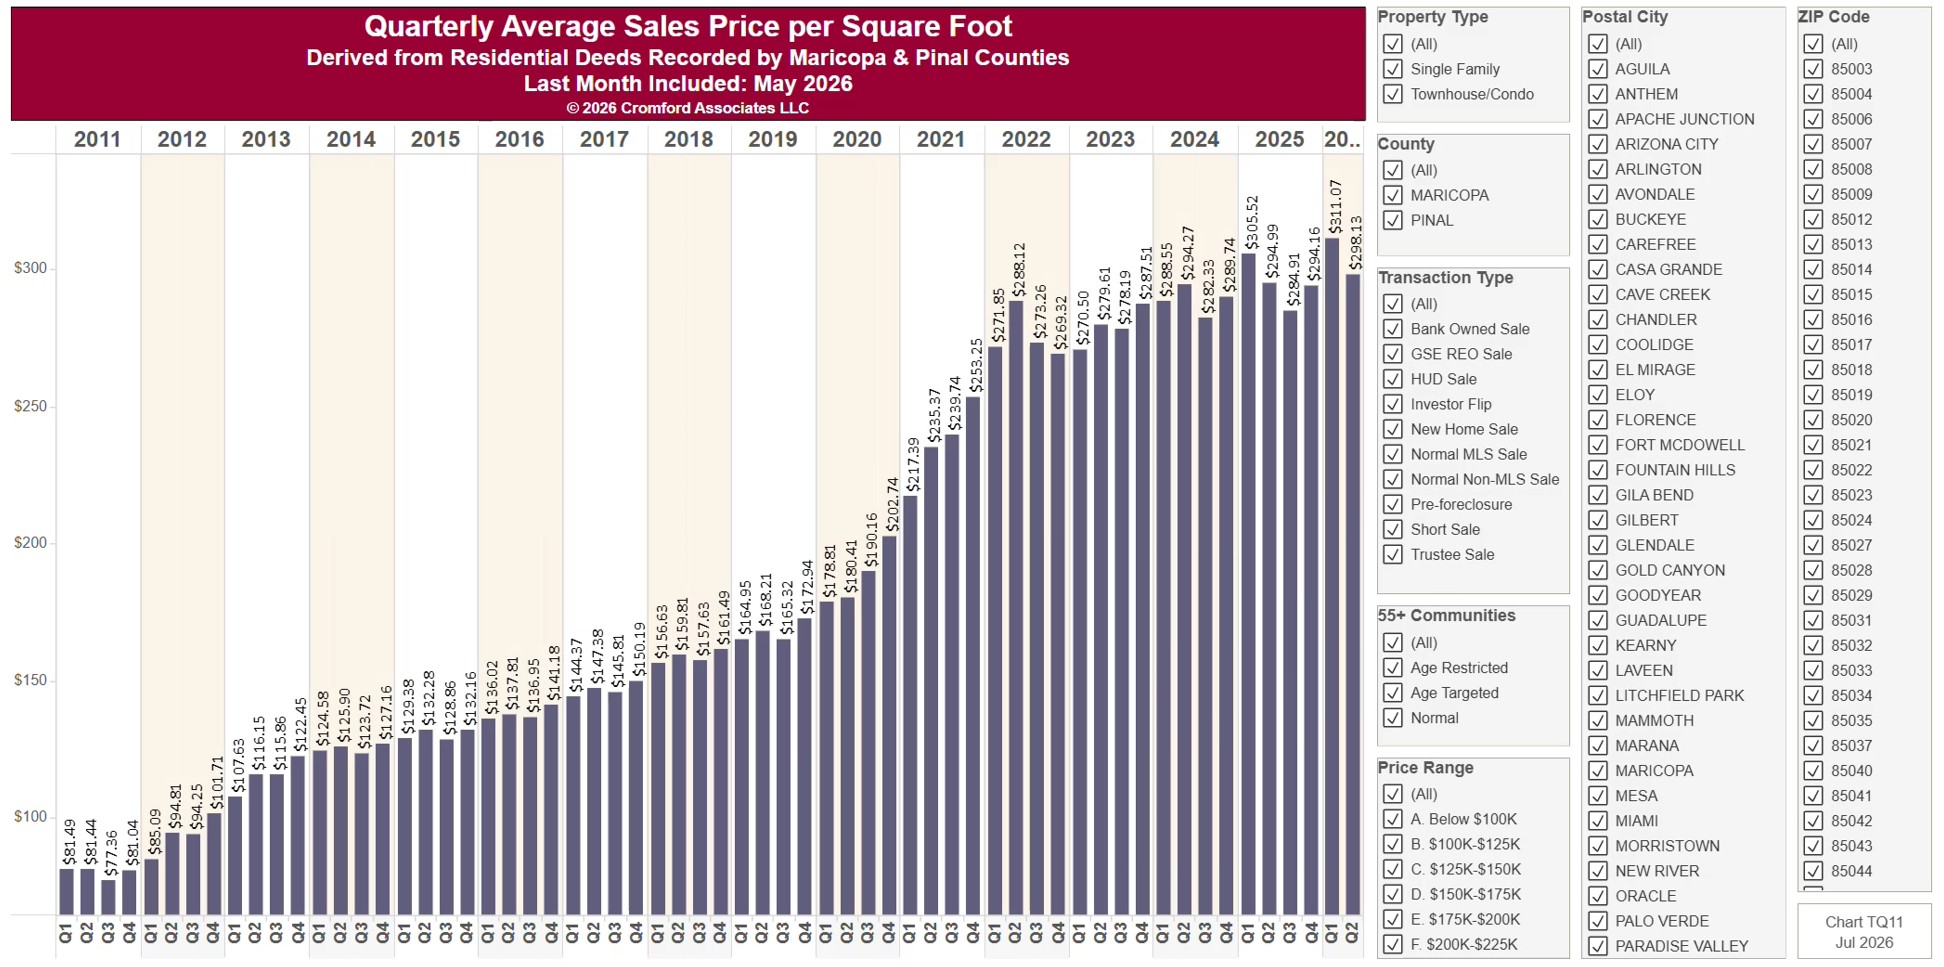
This chart shows the average price per square foot of homes sold, one bar per calendar quarter since 2011, from residential deeds recorded by Maricopa and Pinal Counties. Price per square foot lets you compare homes of different sizes. Because it is built from recorded deeds, it covers every recorded sale, not just homes listed on ARMLS: new homes, private sales, and investor deals are all included.

It opens on Maricopa and Pinal Counties with everything included. Narrow it with the County, City, and ZIP panels, the Transaction Type, Property Type, and 55+ Communities boxes, and the sale price and home size sliders. Untick years in the Year panel to drop them from the chart.

The newest quarter is usually only part of a quarter, because the records run to the end of last month. Hover over a bar to see the exact figure for that quarter.

Monthly Average Sales Price per Square Foot

About this chart

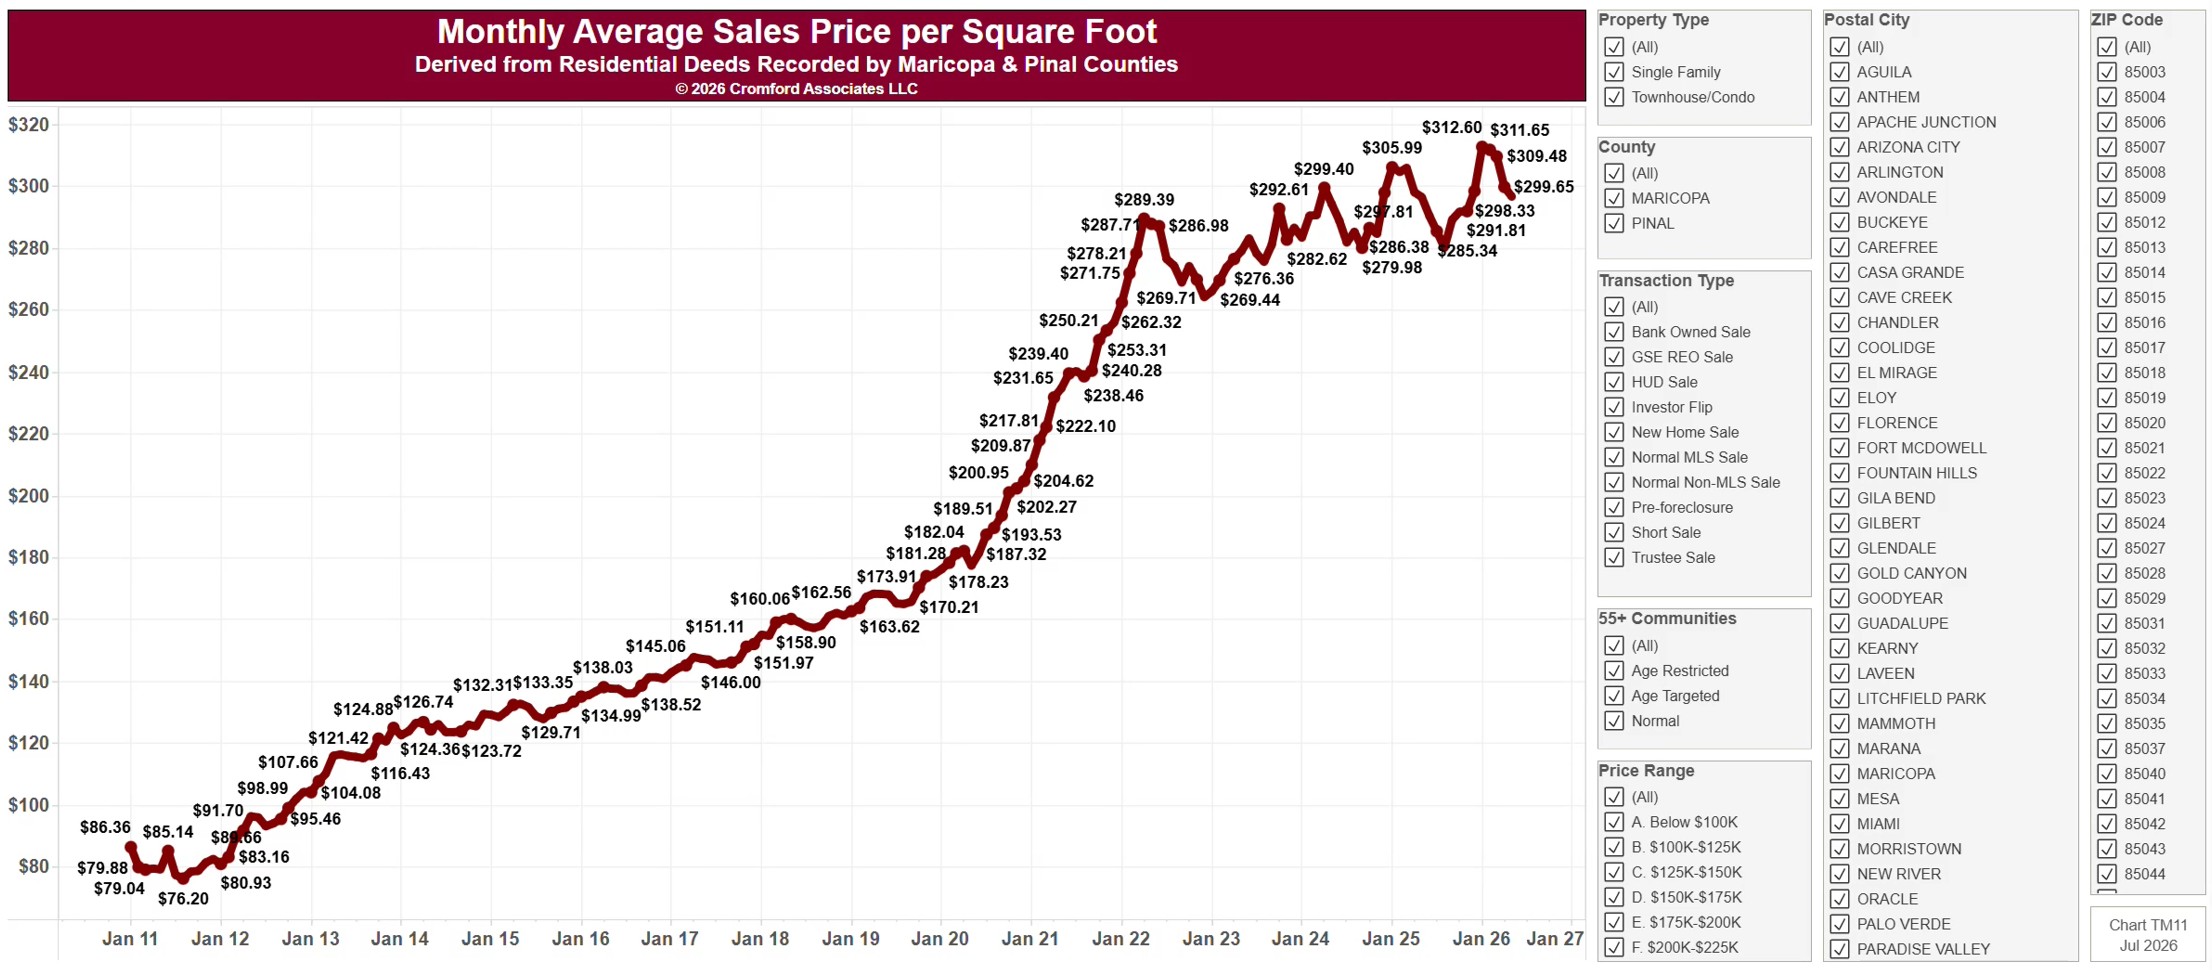
This chart shows the average price per square foot of homes sold, as a line by calendar month since January 2011, from residential deeds recorded by Maricopa and Pinal Counties. Price per square foot lets you compare homes of different sizes. Because it is built from recorded deeds, it covers every recorded sale, not just homes listed on ARMLS: new homes, private sales, and investor deals are all included.

It opens on Maricopa and Pinal Counties with everything included. Narrow it with the County, City, and ZIP panels, the Transaction Type, Property Type, and 55+ Communities boxes, and the sale price and home size sliders. Untick years in the Year panel to drop them from the chart.

The records run to the end of last month and are updated monthly. Hover over the line to see the exact figure for that month.