Average Sales Price – Monthly – Long Term

About this chart

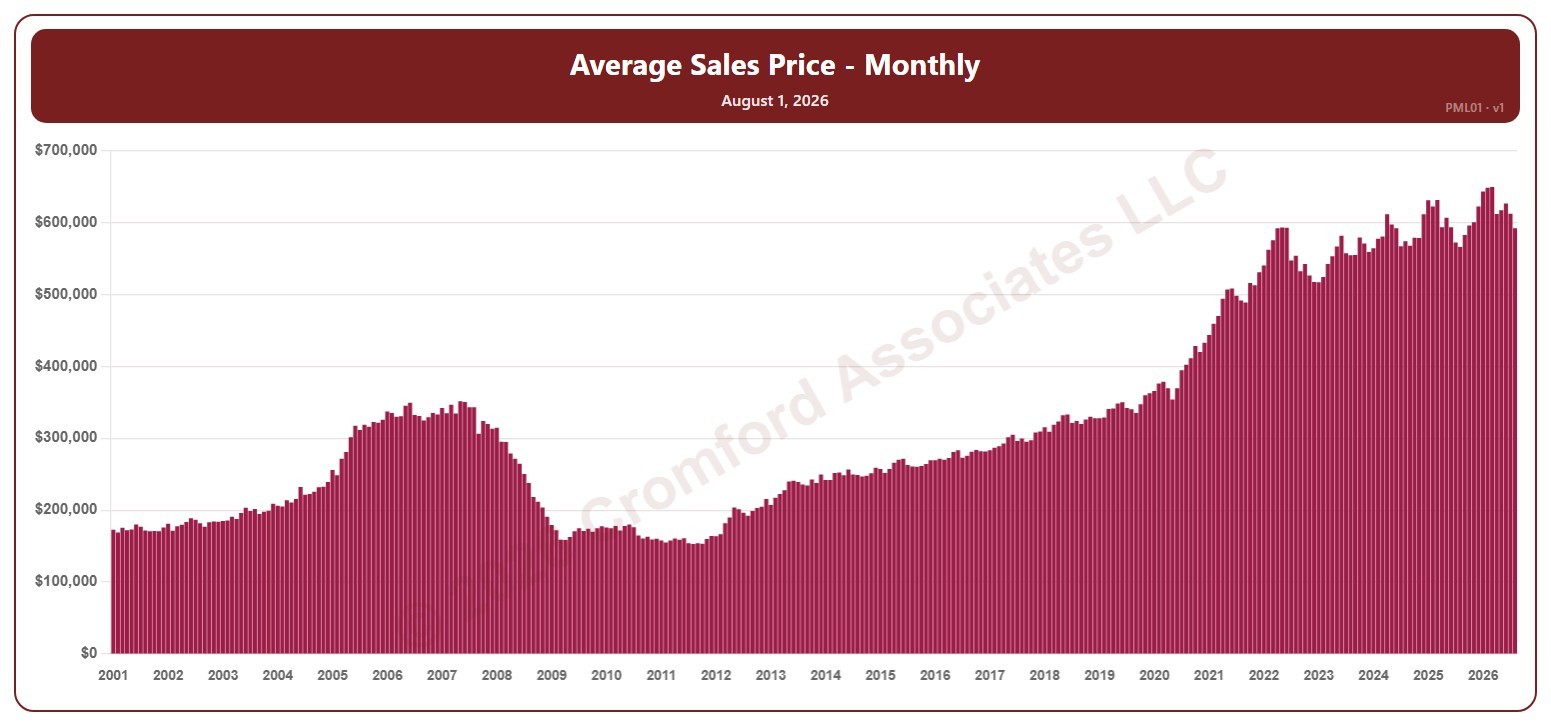
This chart shows the average sales price of the homes that closed in a month, for the whole ARMLS market, all areas and all dwelling types, as one bar per month since January 2001. Each bar covers the closings in that calendar month. Sales of large, expensive homes pull the average up more than the median.

Hover over a bar to see the exact figure for that month.

Market Dashboard

About this chart

This dashboard summarizes the current state of the residential market for all areas and types covered by ARMLS. It is measured daily and shows where the market stands today; for longer-term trends, use the individual charts in the Analysis section.

Use Select Type of Data to switch between 14 views: Sale Price / Sq Ft, Cromford® Index, Inventory, Active Listings, Under Contract, Expired Listings, Canceled Listings, List Price / Sq Ft, Closed Listings, Dollar Volume, Days on Market, Success Rate, Square Feet, and Sale Price $.

Each tile compares a recent figure with an earlier one and is colored to show whether the change is good for sellers, bad for sellers, or neither. The chart beneath the tiles shows the last 13 months, month by month. Hover over it to see each figure.

Quarterly Average Sales Price by Region

About this chart

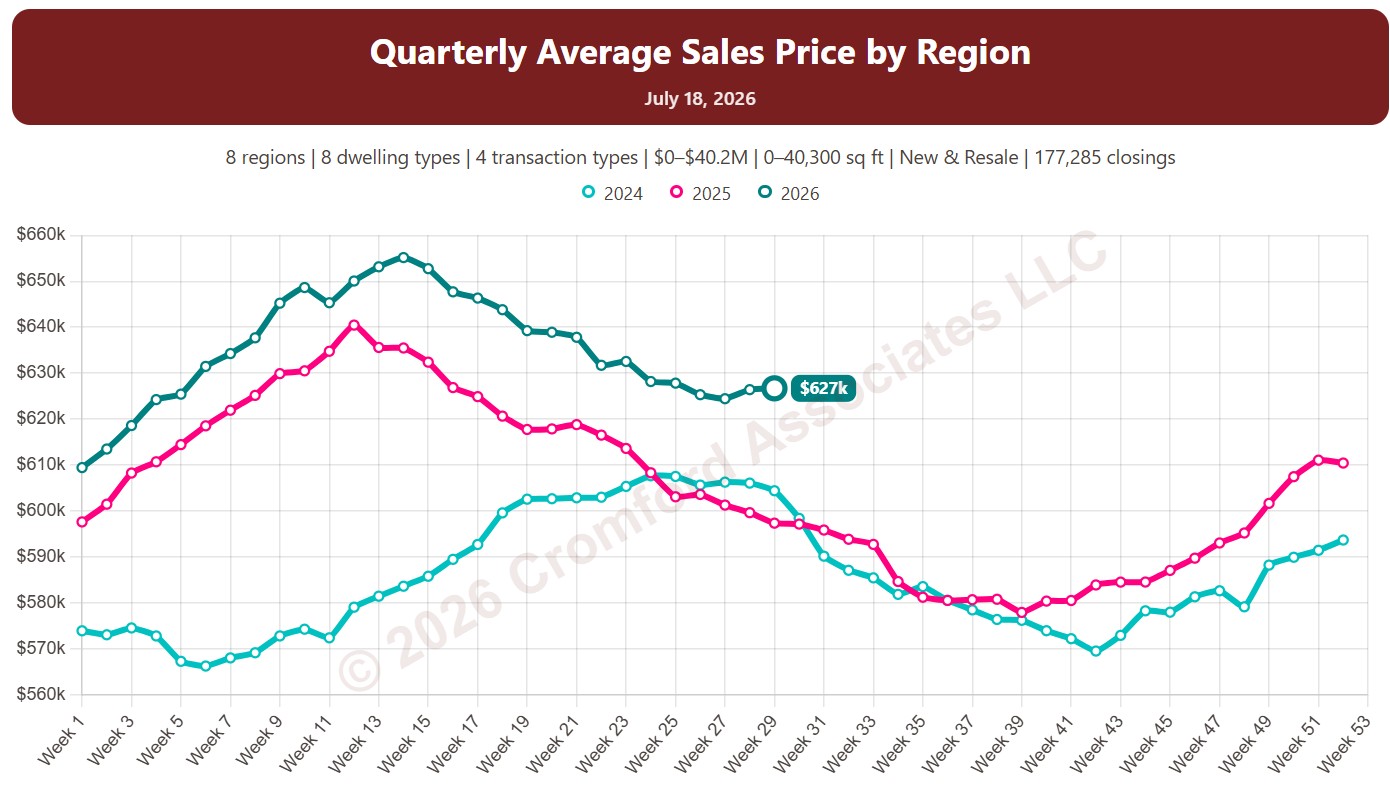
This chart shows the average sales price of homes that closed through ARMLS, measured every week. Each point covers the homes that closed in the three months up to that week. Sales of large, expensive homes pull the average up more than the median, so it usually sits above the median price.

Each year has its own line, laid out by week of the year, so you can compare this year with earlier years at the same point in the season. It opens on the last three years; tick any year back to 2001 in the Year panel.

It opens with every region included. Use the Region panel to focus on one region or compare a combination of them. Narrow it with the Dwelling Type, Transaction Type, and New / Resale boxes and the sales price, home size, and year built sliders. The Inflation (CPI) option restates prices in today’s dollars using national or Phoenix inflation.

Hover over a line to see the exact figure for that week.

Quarterly Average Sales Price by City and ZIP Code

About this chart

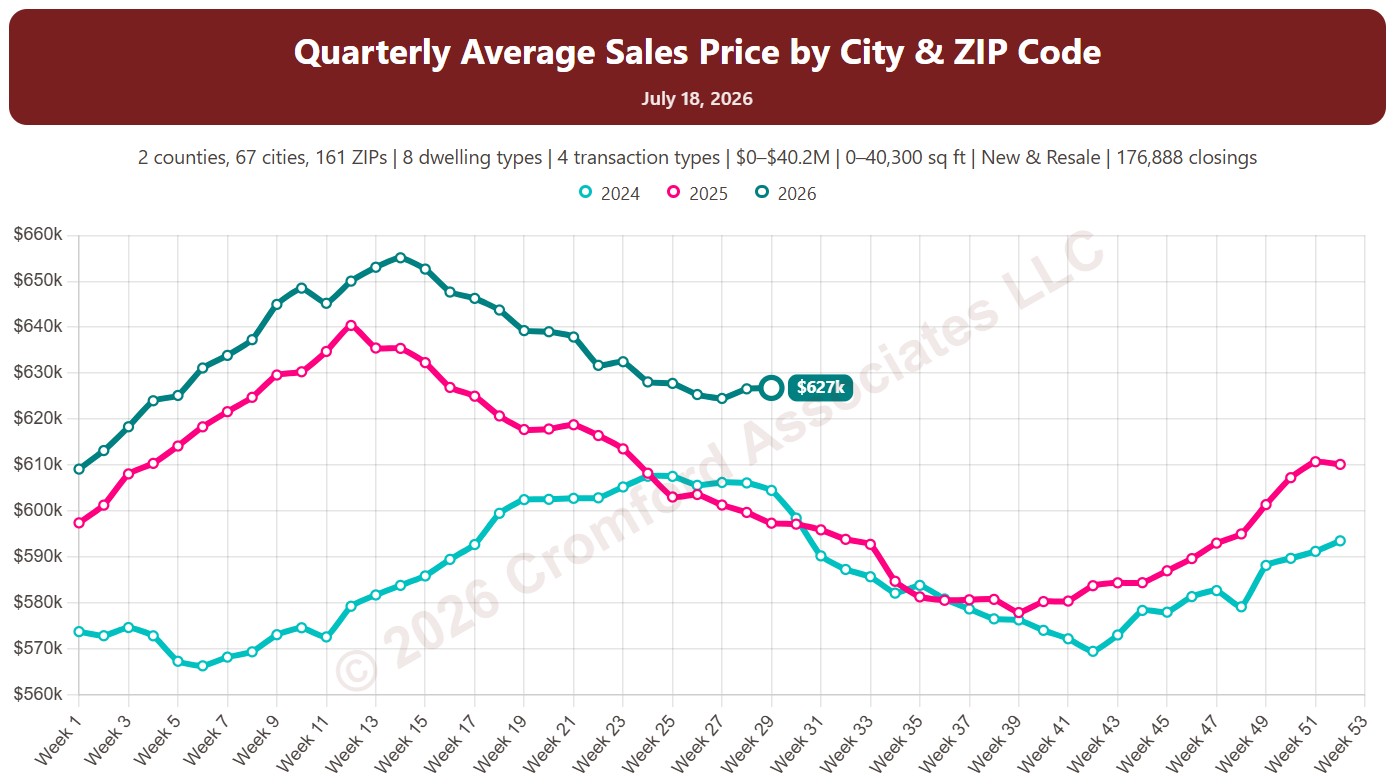
This chart shows the average sales price of homes that closed through ARMLS, measured every week. Each point covers the homes that closed in the three months up to that week. Sales of large, expensive homes pull the average up more than the median, so it usually sits above the median price.

Each year has its own line, laid out by week of the year, so you can compare this year with earlier years at the same point in the season. It opens on the last three years; tick any year back to 2001 in the Year panel.

It opens on Maricopa and Pinal Counties with every city and ZIP code included. Use the County, City, and ZIP panels to focus on any area, from a whole county down to a single ZIP code. Narrow it with the Dwelling Type, Transaction Type, and New / Resale boxes and the sales price, home size, and year built sliders. The Inflation (CPI) option restates prices in today’s dollars using national or Phoenix inflation.

Hover over a line to see the exact figure for that week.

Monthly Average Sales Price by Region

About this chart

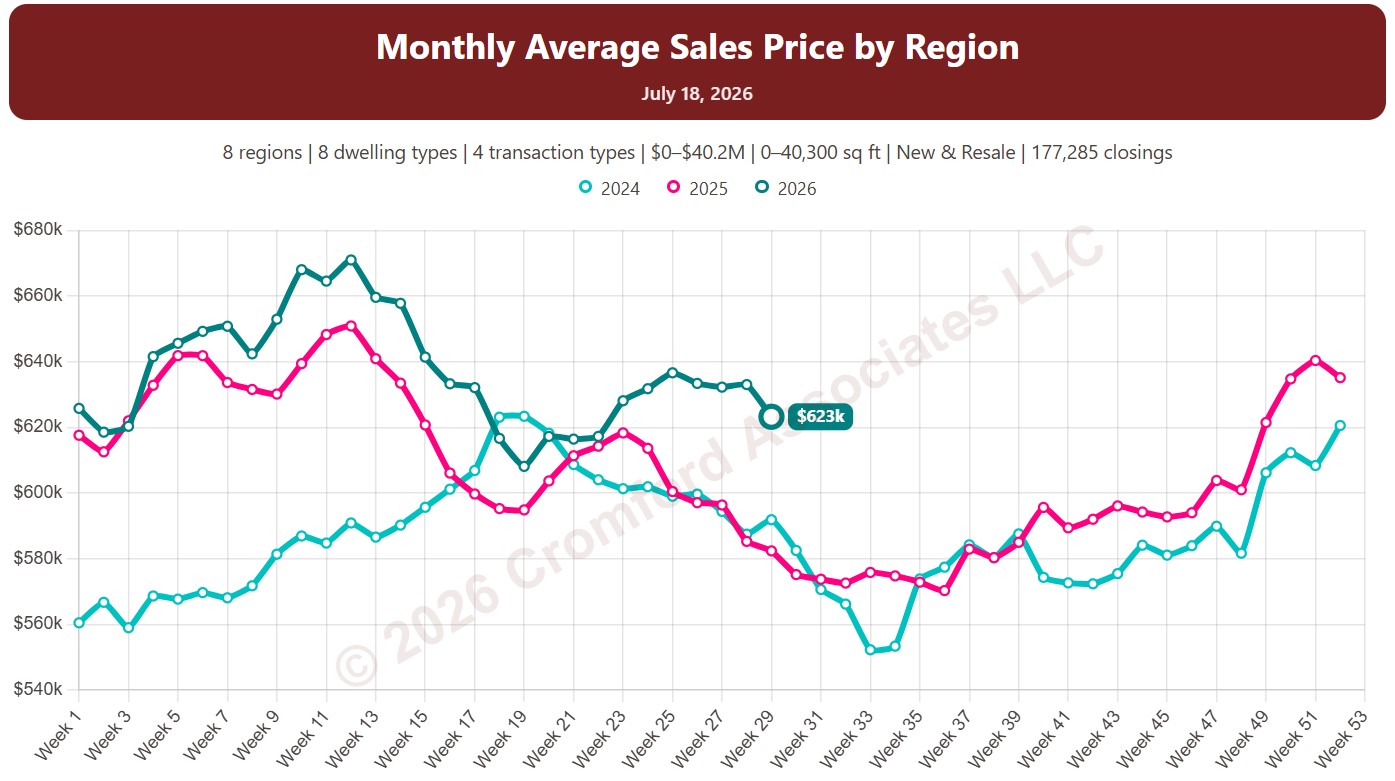
This chart shows the average sales price of homes that closed through ARMLS, measured every week. Each point covers the homes that closed in the month up to that week. Sales of large, expensive homes pull the average up more than the median, so it usually sits above the median price.

Each year has its own line, laid out by week of the year, so you can compare this year with earlier years at the same point in the season. It opens on the last three years; tick any year back to 2001 in the Year panel.

It opens with every region included. Use the Region panel to focus on one region or compare a combination of them. Narrow it with the Dwelling Type, Transaction Type, and New / Resale boxes and the sales price, home size, and year built sliders. The Inflation (CPI) option restates prices in today’s dollars using national or Phoenix inflation.

Hover over a line to see the exact figure for that week.

Monthly Average Sales Price by City and ZIP Code

About this chart

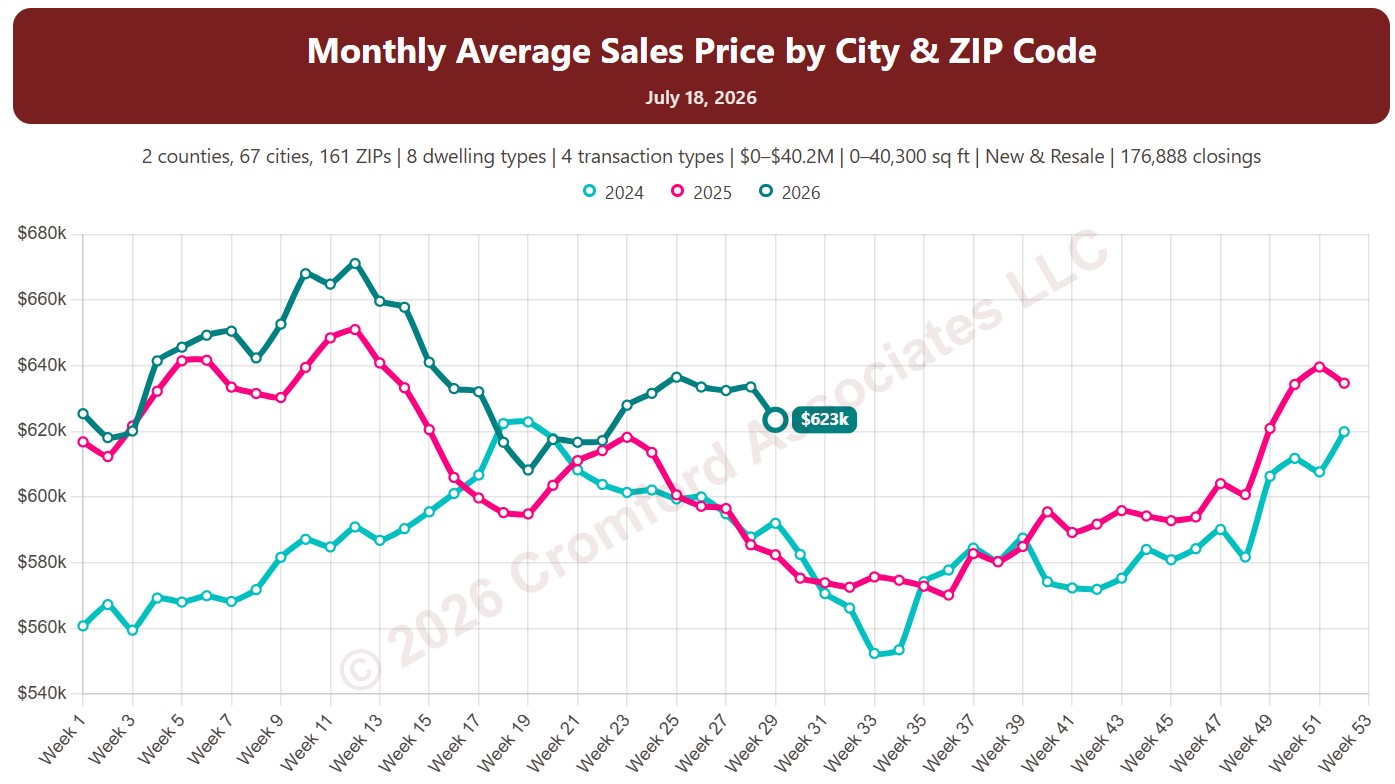
This chart shows the average sales price of homes that closed through ARMLS, measured every week. Each point covers the homes that closed in the month up to that week. Sales of large, expensive homes pull the average up more than the median, so it usually sits above the median price.

Each year has its own line, laid out by week of the year, so you can compare this year with earlier years at the same point in the season. It opens on the last three years; tick any year back to 2001 in the Year panel.

It opens on Maricopa and Pinal Counties with every city and ZIP code included. Use the County, City, and ZIP panels to focus on any area, from a whole county down to a single ZIP code. Narrow it with the Dwelling Type, Transaction Type, and New / Resale boxes and the sales price, home size, and year built sliders. The Inflation (CPI) option restates prices in today’s dollars using national or Phoenix inflation.

Hover over a line to see the exact figure for that week.

Annual Average Sales Price by Region

About this chart

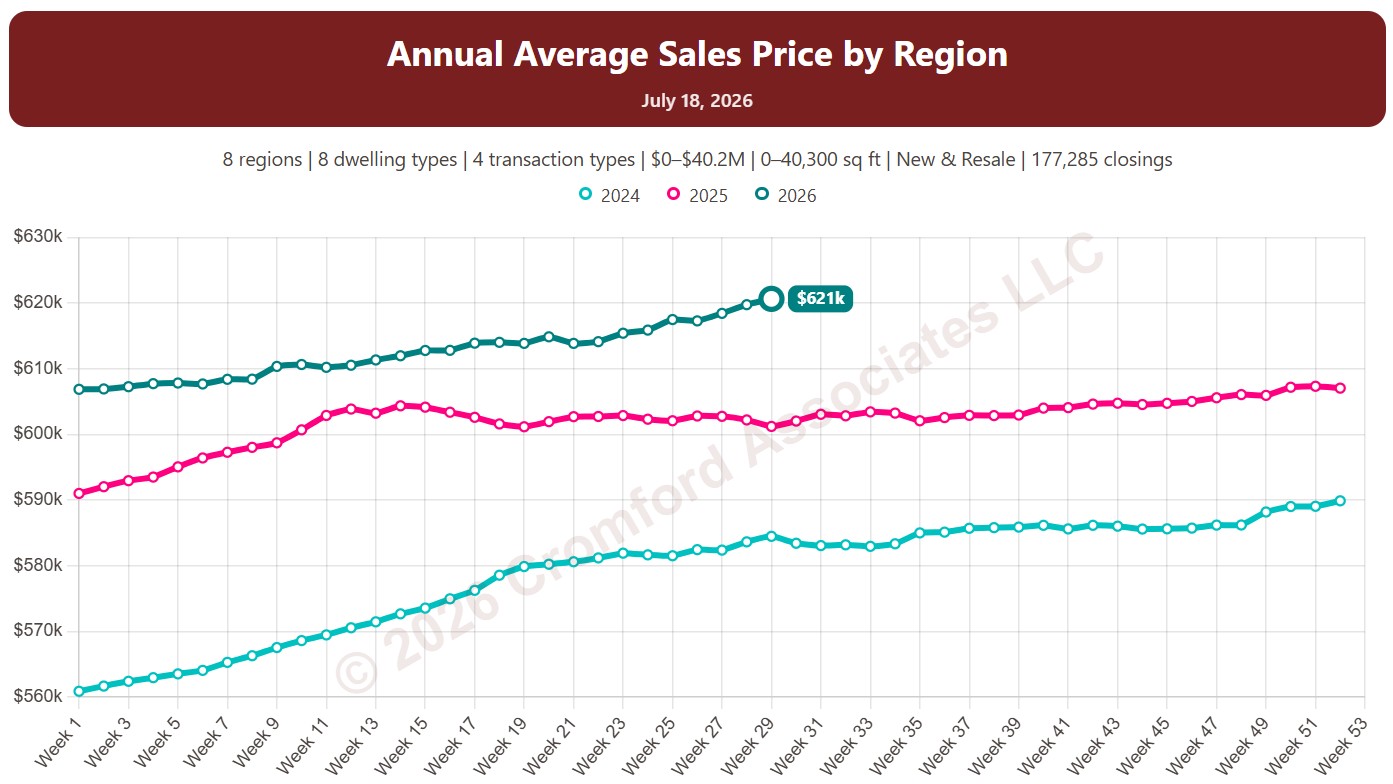
This chart shows the average sales price of homes that closed through ARMLS, measured every week. Each point covers the homes that closed in the 12 months up to that week. Sales of large, expensive homes pull the average up more than the median, so it usually sits above the median price.

Each year has its own line, laid out by week of the year, so you can compare this year with earlier years at the same point in the season. It opens on the last three years; tick any year back to 2001 in the Year panel.

It opens with every region included. Use the Region panel to focus on one region or compare a combination of them. Narrow it with the Dwelling Type, Transaction Type, and New / Resale boxes and the sales price, home size, and year built sliders. The Inflation (CPI) option restates prices in today’s dollars using national or Phoenix inflation.

Hover over a line to see the exact figure for that week.

Annual Average Sales Price by City and ZIP Code

About this chart

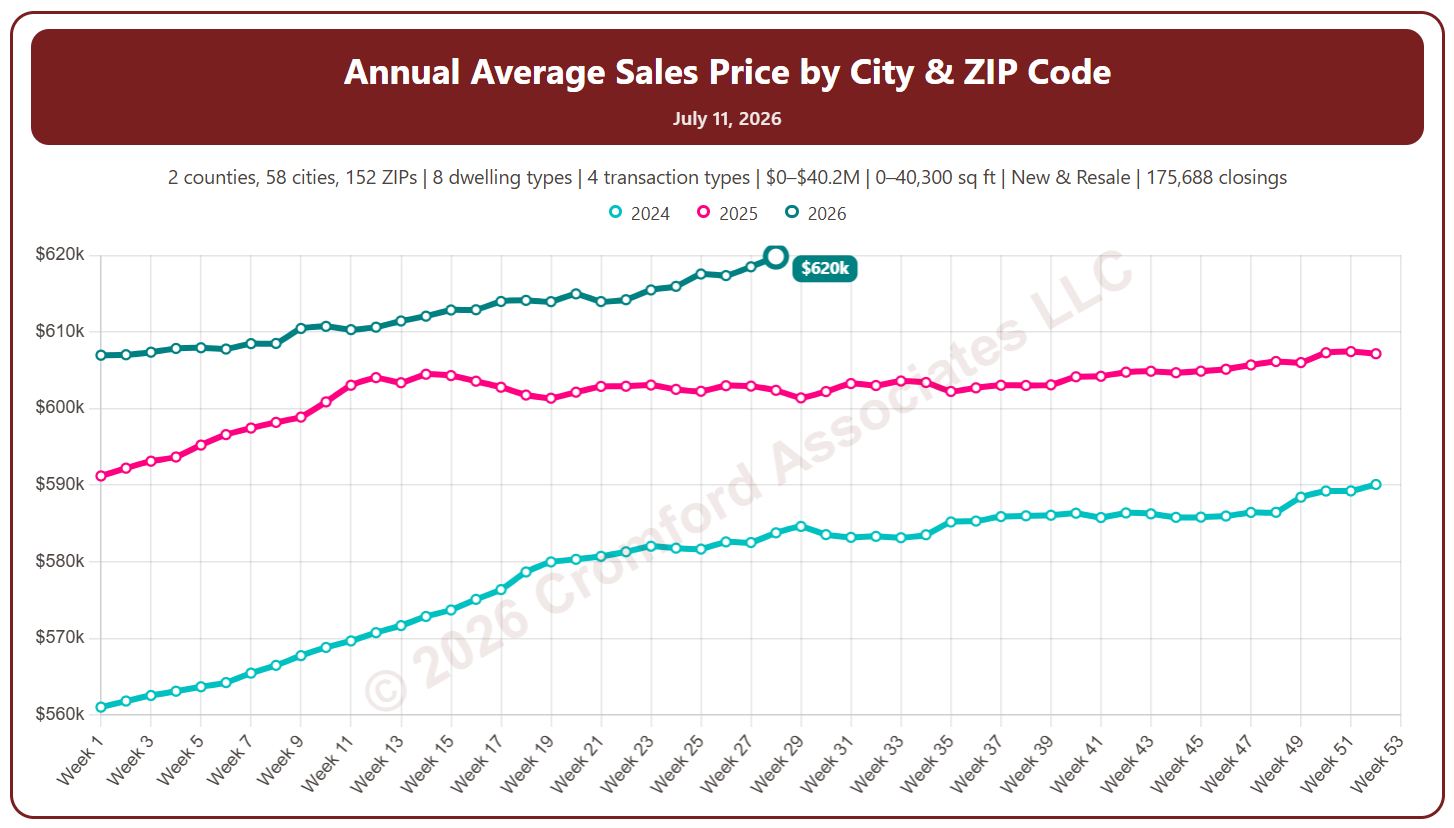
This chart shows the average sales price of homes that closed through ARMLS, measured every week. Each point covers the homes that closed in the 12 months up to that week. Sales of large, expensive homes pull the average up more than the median, so it usually sits above the median price.

Each year has its own line, laid out by week of the year, so you can compare this year with earlier years at the same point in the season. It opens on the last three years; tick any year back to 2001 in the Year panel.

It opens on Maricopa and Pinal Counties with every city and ZIP code included. Use the County, City, and ZIP panels to focus on any area, from a whole county down to a single ZIP code. Narrow it with the Dwelling Type, Transaction Type, and New / Resale boxes and the sales price, home size, and year built sliders. The Inflation (CPI) option restates prices in today’s dollars using national or Phoenix inflation.

Hover over a line to see the exact figure for that week.

Monthly Average Sales Price

About this chart

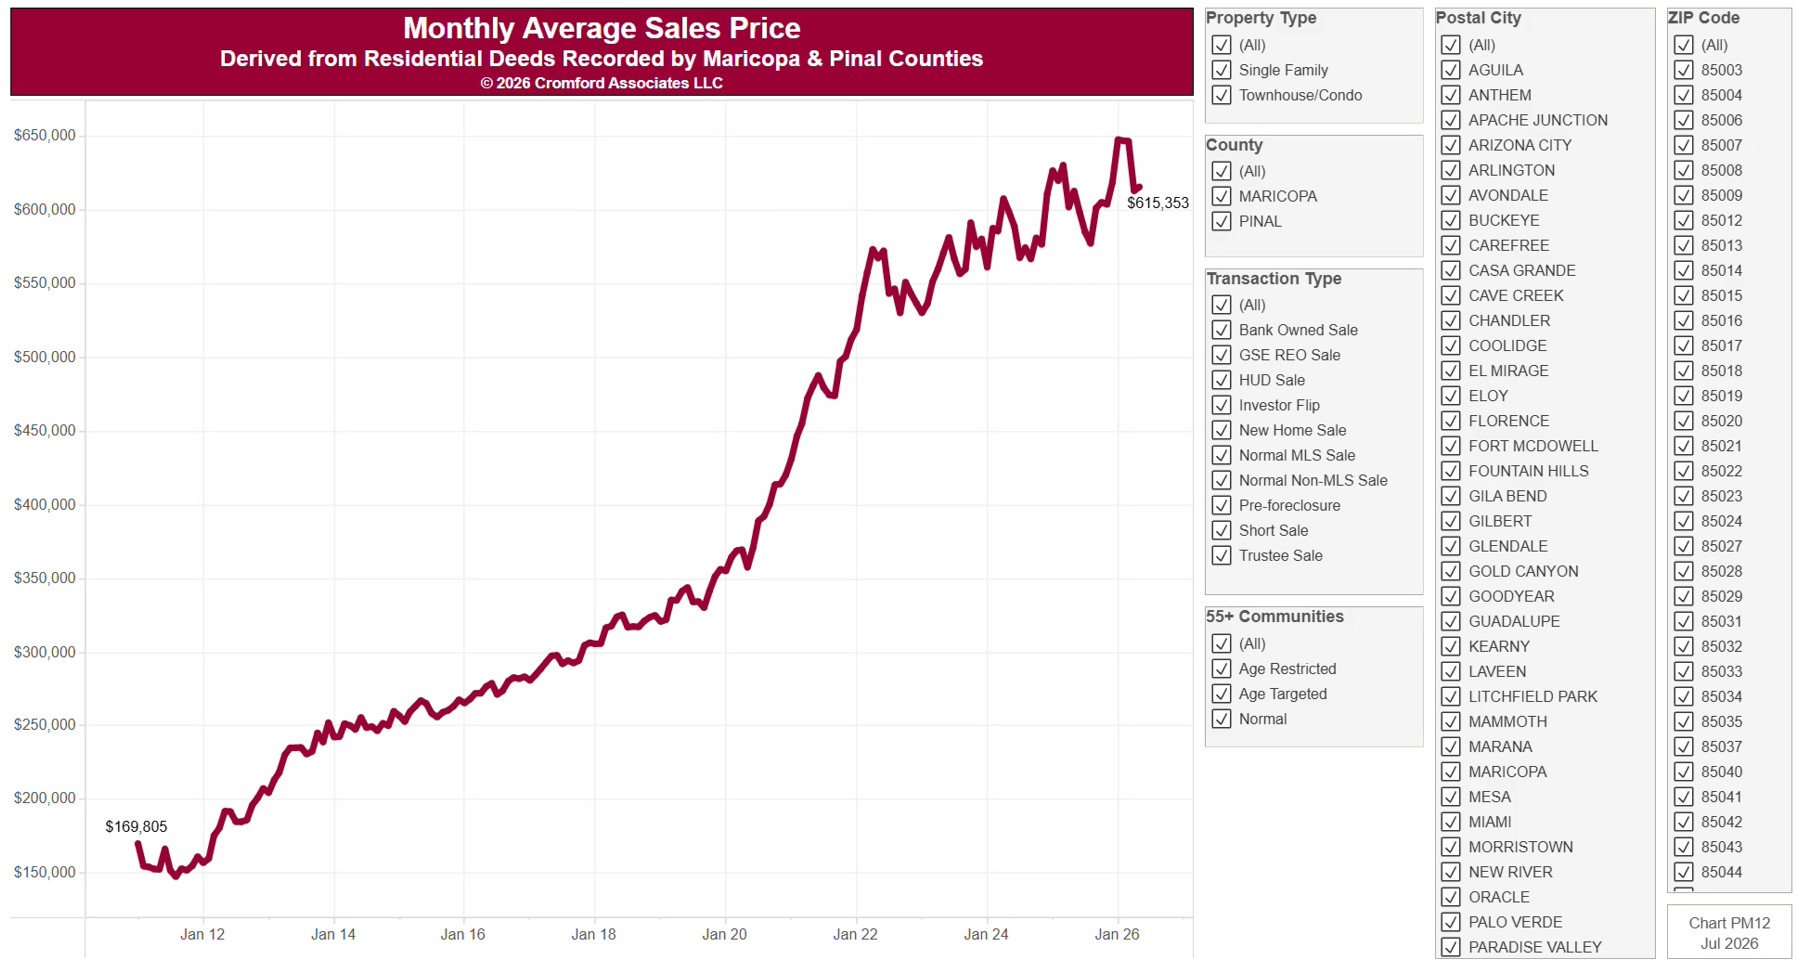
This chart shows the average sale price of homes as a line by calendar month since January 2011, from residential deeds recorded by Maricopa and Pinal Counties. It is the same series as PM11, drawn as a line. Sales of large, expensive homes pull the average up more than the median. Because it is built from recorded deeds, it covers every recorded sale, not just homes listed on ARMLS: new homes, private sales, and investor deals are all included.

It opens on Maricopa and Pinal Counties with everything included. Narrow it with the County, City, and ZIP panels, the Transaction Type, Property Type, and 55+ Communities boxes, and the sale price and home size sliders.

The records run to the end of last month and are updated monthly. Hover over the line to see the exact figure for that month.

Monthly Average Sale Price

About this chart

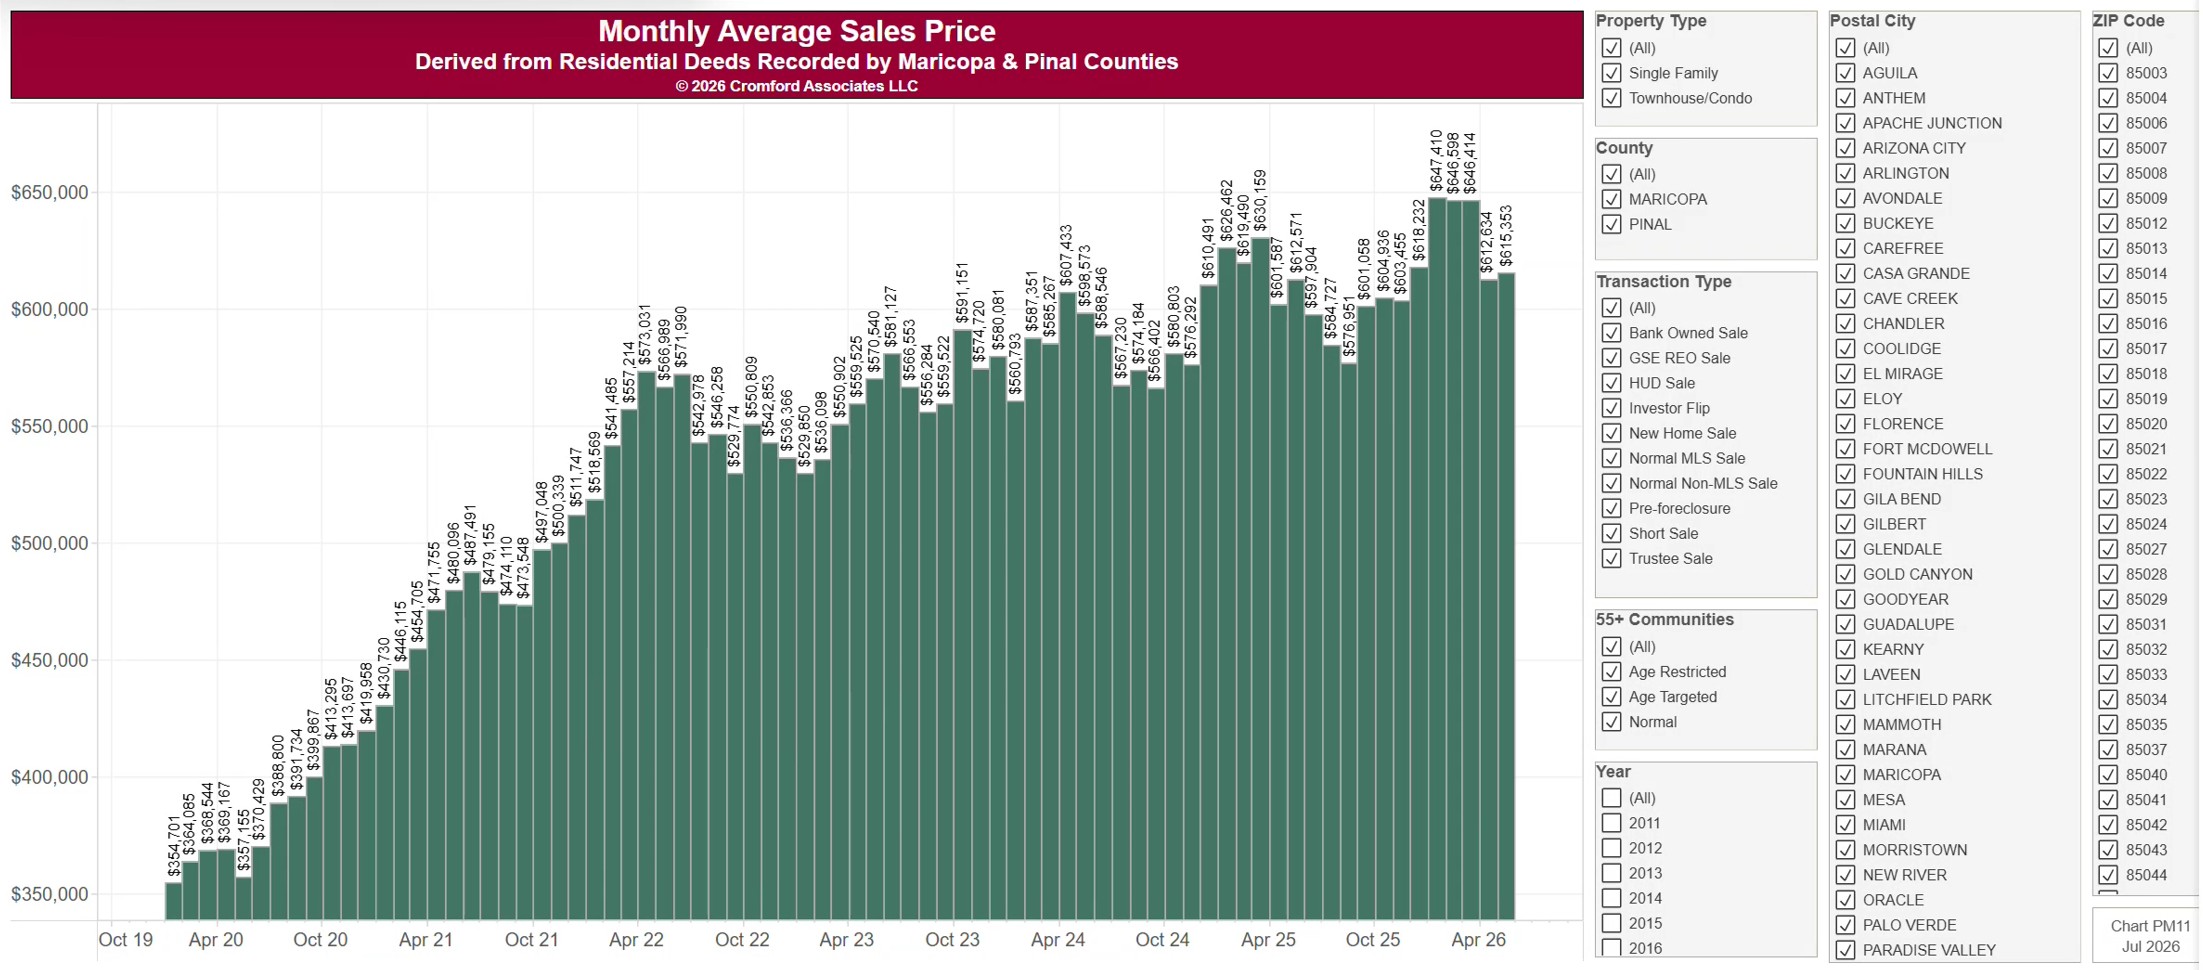
This chart shows the average sale price of homes, one bar per calendar month since January 2011, from residential deeds recorded by Maricopa and Pinal Counties. Sales of large, expensive homes pull the average up more than the median. Because it is built from recorded deeds, it covers every recorded sale, not just homes listed on ARMLS: new homes, private sales, and investor deals are all included.

It opens on Maricopa and Pinal Counties with everything included. Narrow it with the County, City, and ZIP panels, the Transaction Type, Property Type, and 55+ Communities boxes, and the sale price slider. Untick years in the Year panel to drop them from the chart.

The records run to the end of last month and are updated monthly. Hover over a bar to see the exact figure for that month.