Market Dashboard

About this chart

This dashboard summarizes the current state of the residential market for all areas and types covered by ARMLS. It is measured daily and shows where the market stands today; for longer-term trends, use the individual charts in the Analysis section.

Use Select Type of Data to switch between 14 views: Sale Price / Sq Ft, Cromford® Index, Inventory, Active Listings, Under Contract, Expired Listings, Canceled Listings, List Price / Sq Ft, Closed Listings, Dollar Volume, Days on Market, Success Rate, Square Feet, and Sale Price $.

Each tile compares a recent figure with an earlier one and is colored to show whether the change is good for sellers, bad for sellers, or neither. The chart beneath the tiles shows the last 13 months, month by month. Hover over it to see each figure.
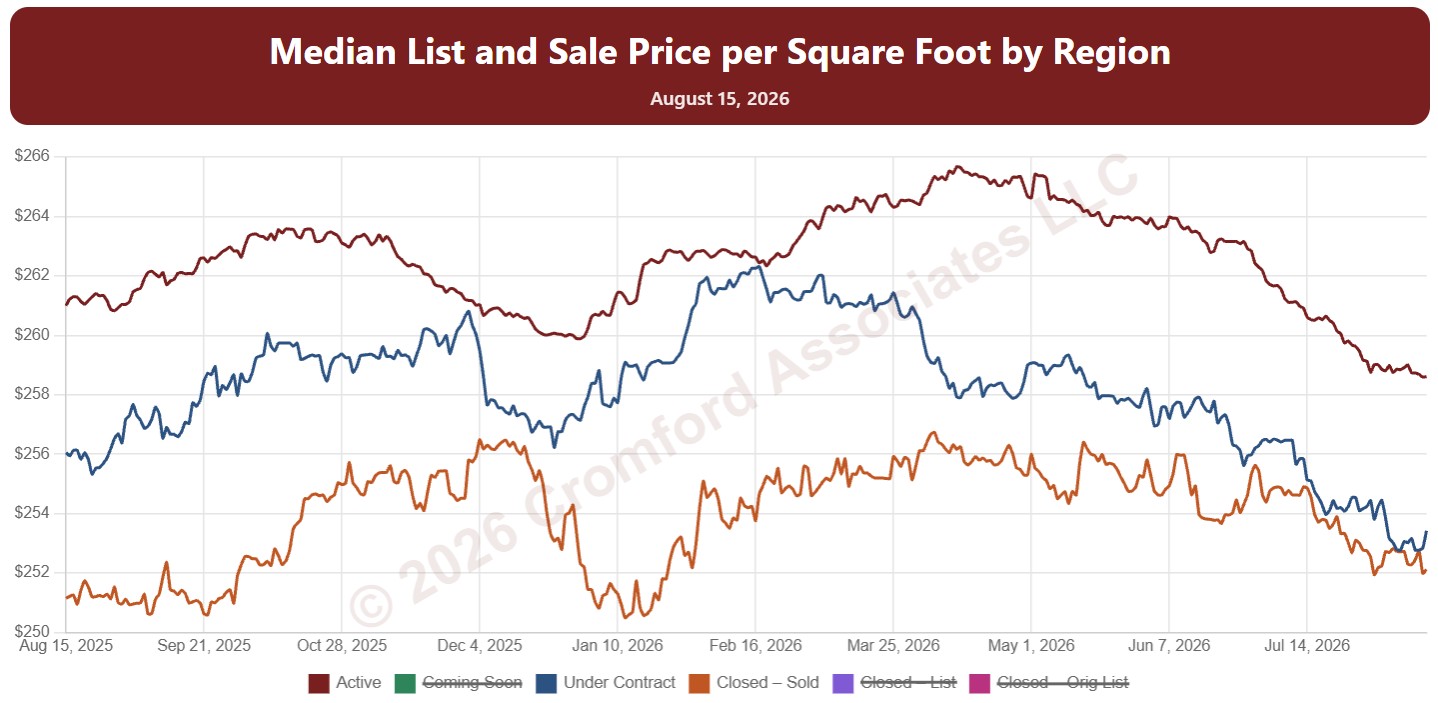
Median List Price per Square Foot by Region

About this chart

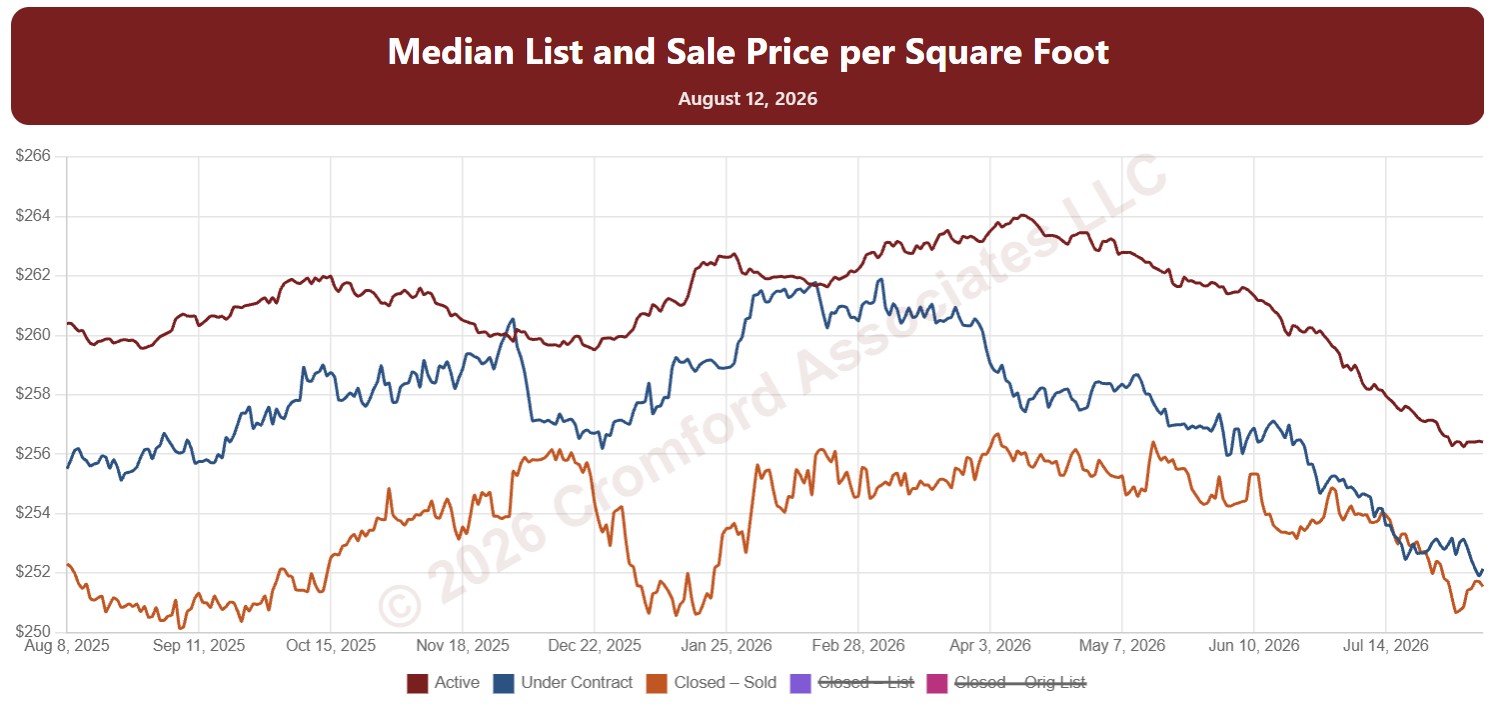
This chart shows median price per square foot every day over the last 12 months, with one line each for Active, Coming Soon, and Under Contract listings (their list prices) and three for homes that closed: the sale price, the final list price, and the original list price.

Reading the lines together shows the gap between what sellers ask and what buyers pay, and how much prices were cut along the way.

It opens with every region included. Use the Region panel to focus on one region or compare a combination of them. Narrow it with the Dwelling Type, Transaction Type, and New / Resale boxes and the list price, home size, and year built sliders.

Hover over the chart to see each figure for that day.

Median Price per Square Foot by City and ZIP Code

About this chart

This chart shows median price per square foot every day over the last 12 months, with one line each for Active, Coming Soon, and Under Contract listings (their list prices) and three for homes that closed: the sale price, the final list price, and the original list price.

Reading the lines together shows the gap between what sellers ask and what buyers pay, and how much prices were cut along the way.

It opens on Maricopa and Pinal Counties with every city and ZIP code included. Use the County, City, and ZIP panels to focus on any area, from a whole county down to a single ZIP code. Narrow it with the Dwelling Type, Transaction Type, and New / Resale boxes and the list price, home size, and year built sliders.

Hover over the chart to see each figure for that day.