
About this chart
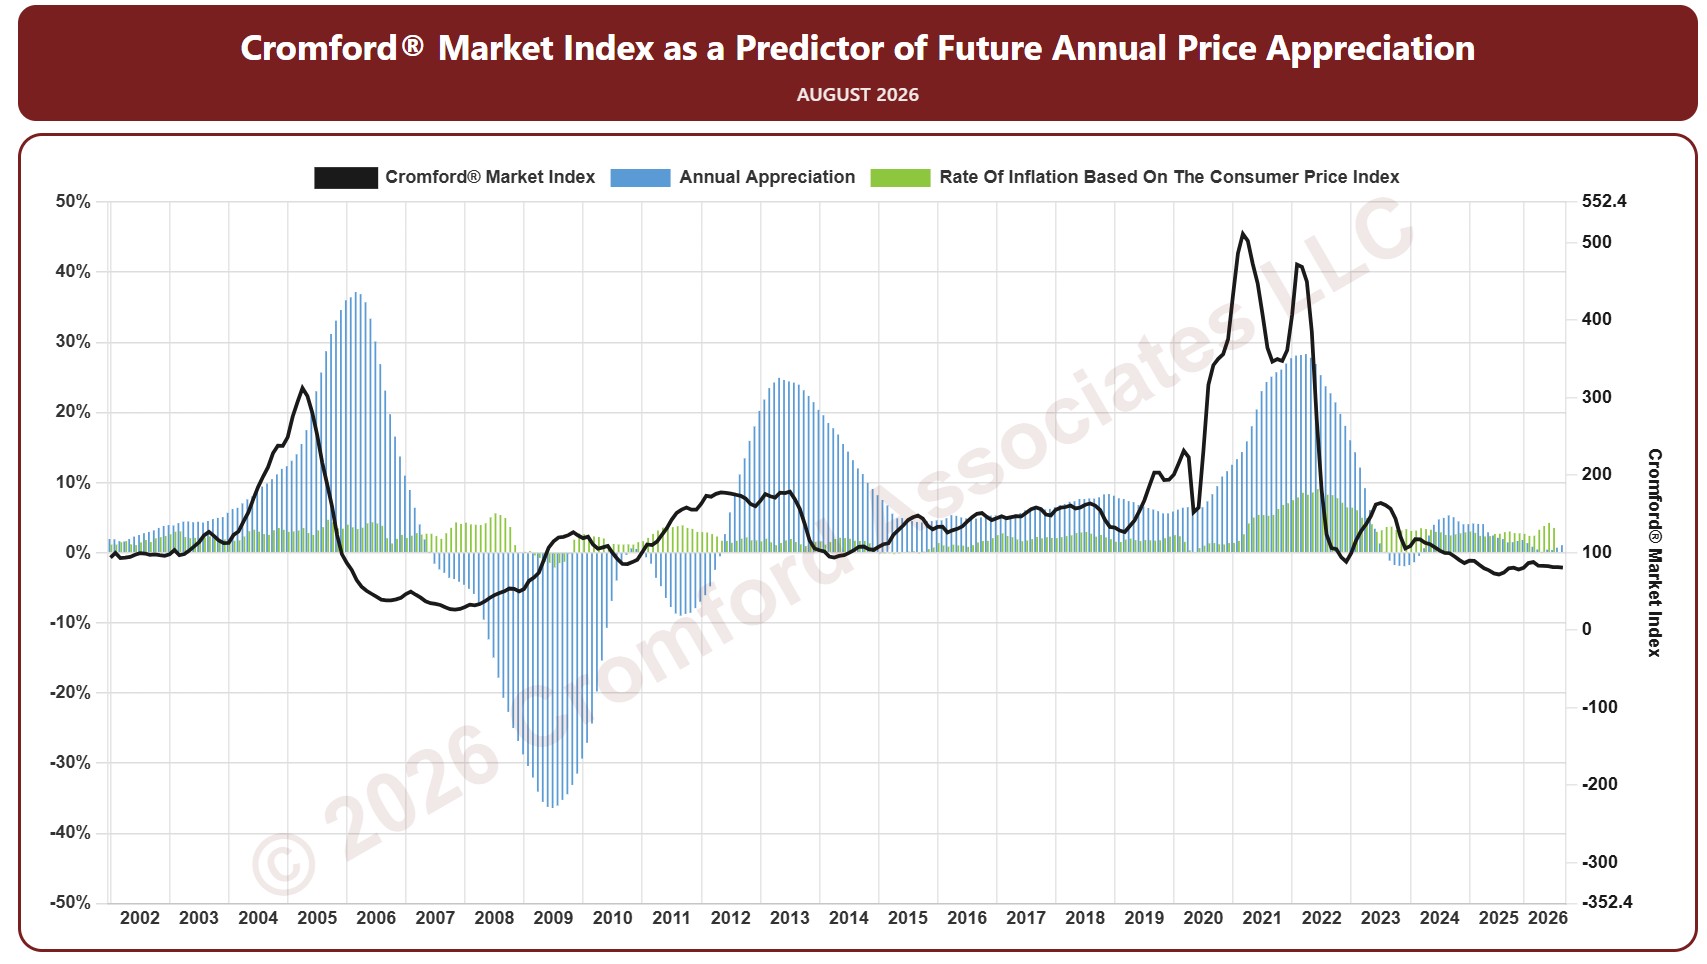
This chart sets the Cromford® Market Index beside annual appreciation for the whole ARMLS market, all areas and all dwelling types, one reading on the 1st of each month since January 2002, with the rate of inflation (Consumer Price Index) alongside. It shows how a shift in the balance between buyers and sellers has been followed by a change in prices.
A reading below 90 indicates a buyer’s market, above 110 a seller’s market, and between 90 and 110 a balanced market. Appreciation is the change in the average sales price per square foot over the last 12 months compared with a year earlier.
The options label the minimum, maximum, and latest values and switch the Market Index to a logarithmic axis. Use the date slider, or Full range, to choose the stretch of history shown. Hover over the chart to see the figures for that month.