Contract Fall-Throughs per Week

About this chart

This chart shows the number of contracts that fell through each week, a line per year. Weeks run Sunday to Saturday and week 1 of each year starts on 1 January, so the first and last weeks of a year can be short. A fall-through is an accepted contract (UCB, CCBS, or Pending) that ended without the home closing: the listing came back on the market, was taken temporarily off it, or was cancelled or expired while under contract. Each one is counted on the day it happened, so a home whose contract fell through twice counts twice.

It opens on the latest 3 years; tick other years in the Year box to go back as far as 2014. Click a ticked year again to fade it, and once more to remove it. Use the Month box to count only some months of the year. Only complete weeks are shown, so the newest point is the week that ended on the last Saturday. The chart is updated every week.

It opens on the Greater Phoenix area: the counties, cities, and ZIP codes that make it up are ticked to start with. Tick or untick any of them to change the area, including counties beyond Greater Phoenix. Narrow it further with the Dwelling Type, Transaction Type, and New / Resale boxes and the list price, home size, and year built sliders. The list price is the price when the contract was accepted.

Hover over the chart to see each year’s count for that week. Contracts that ended in a cancellation or expiration are also counted on the cancelled (CL52) and expired (EL51) listing charts. For the share of contracts that fall through, see FTRG01 and FTCZ01.

Year-to-Date Contract Fall-Throughs

About this chart

This chart shows the running total of contract fall-throughs from 1 January to the end of each week of the year, a line per year, so this year’s pace can be read against earlier years. Weeks run Sunday to Saturday and week 1 of each year starts on 1 January, so the first and last weeks of a year can be short. A fall-through is an accepted contract (UCB, CCBS, or Pending) that ended without the home closing: the listing came back on the market, was taken temporarily off it, or was cancelled or expired while under contract. Each one is counted on the day it happened, so a home whose contract fell through twice counts twice.

It opens on the latest 5 years; tick other years in the Year box to go back as far as 2014, and use the Month box to count only some months. Use Zoom to latest to see the newest complete week and four weeks either side, with every year’s total at that week. The chart is updated every week.

It opens on the Greater Phoenix area: the counties, cities, and ZIP codes that make it up are ticked to start with. Tick or untick any of them to change the area, including counties beyond Greater Phoenix. Narrow it further with the Dwelling Type, Transaction Type, and New / Resale boxes and the list price, home size, and year built sliders. The list price is the price when the contract was accepted.

Hover over the chart to see each year’s total at that week. Contracts that ended in a cancellation or expiration are also counted on the cancelled (CL52) and expired (EL51) listing charts. For the share of contracts that fall through, see FTRG01 and FTCZ01.
Contract Fall-Through Rate by City and ZIP Code

About this chart

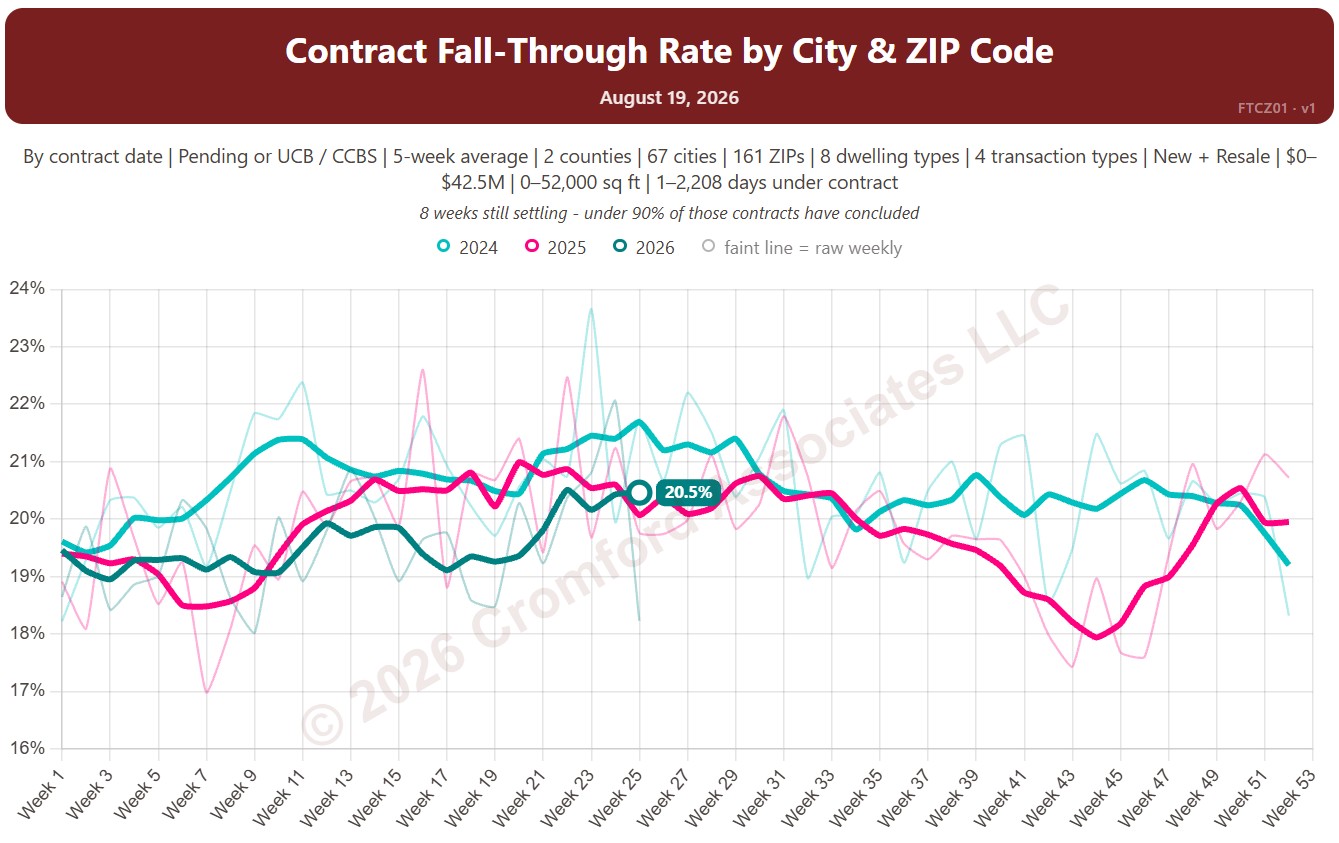
This chart shows the contract fall-through rate, measured every week: the share of accepted contracts that ended without the home closing, for example because financing or an inspection failed. The lines show a 5-week average to smooth out week-to-week noise.

By default contracts are counted by the date they were accepted and include Pending and UCB / CCBS contracts. Rate Basis switches to the date each contract ended, and Listing Status can limit it to Pending contracts only.

Each year has its own line, laid out by week of the year, so you can compare this year with earlier years at the same point in the season. It opens on the last three years; tick any year back to 2011 in the Year panel.

It opens on Maricopa and Pinal Counties with every city and ZIP code included. Use the County, City, and ZIP panels to focus on any area, from a whole county down to a single ZIP code. Narrow it with the Dwelling Type, Transaction Type, and New / Resale boxes and the list price, home size, and days under contract sliders.

Hover over a line to see the exact figure for that week.

Contract Fall-Through Rate by Region

About this chart

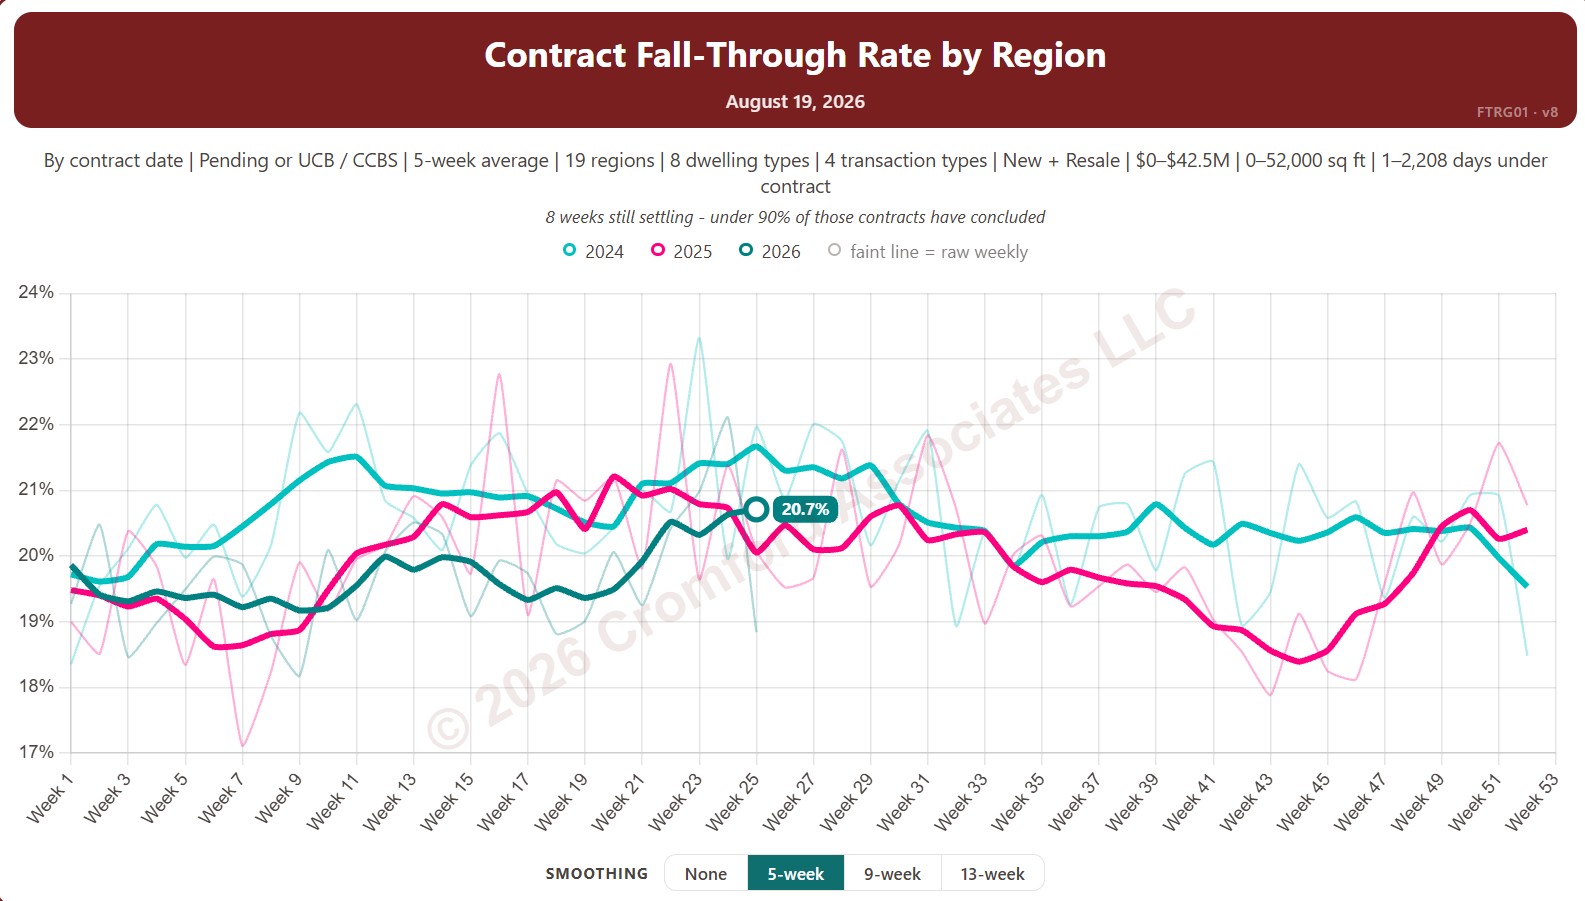
This chart shows the contract fall-through rate, measured every week: the share of accepted contracts that ended without the home closing, for example because financing or an inspection failed. The lines show a 5-week average to smooth out week-to-week noise.

By default contracts are counted by the date they were accepted and include Pending and UCB / CCBS contracts. Rate Basis switches to the date each contract ended, and Listing Status can limit it to Pending contracts only.

Each year has its own line, laid out by week of the year, so you can compare this year with earlier years at the same point in the season. It opens on the last three years; tick any year back to 2011 in the Year panel.

It opens with every Arizona region included. Use the Region panel to focus on one region or compare a combination of them. Narrow it with the Dwelling Type, Transaction Type, and New / Resale boxes and the list price, home size, and days under contract sliders.

Hover over a line to see the exact figure for that week.