Phoenix Urban Village Snapshot

About this chart

This table shows 38 measures of the market for single-family detached homes in each of 14 of the City of Phoenix’s urban villages, one village at a time. Pick the village from the box at the top. Rio Vista, the fifteenth village, has too few sales to include.

Each measure is shown today, a month ago, a quarter ago, a year ago, and two years ago, and earlier dates back to January 2018 can be chosen from the date box. The ST and LT marks compare today with last month and with last year, colored by whether the change favors sellers or buyers.

Urban villages are planning areas inside the City of Phoenix, so every home in them is also counted in Phoenix. Laveen Urban Village is not the same as the postal city of Laveen, and Paradise Valley Urban Village is not the Town of Paradise Valley.
Year-to-Date Dollar Volume

About this chart

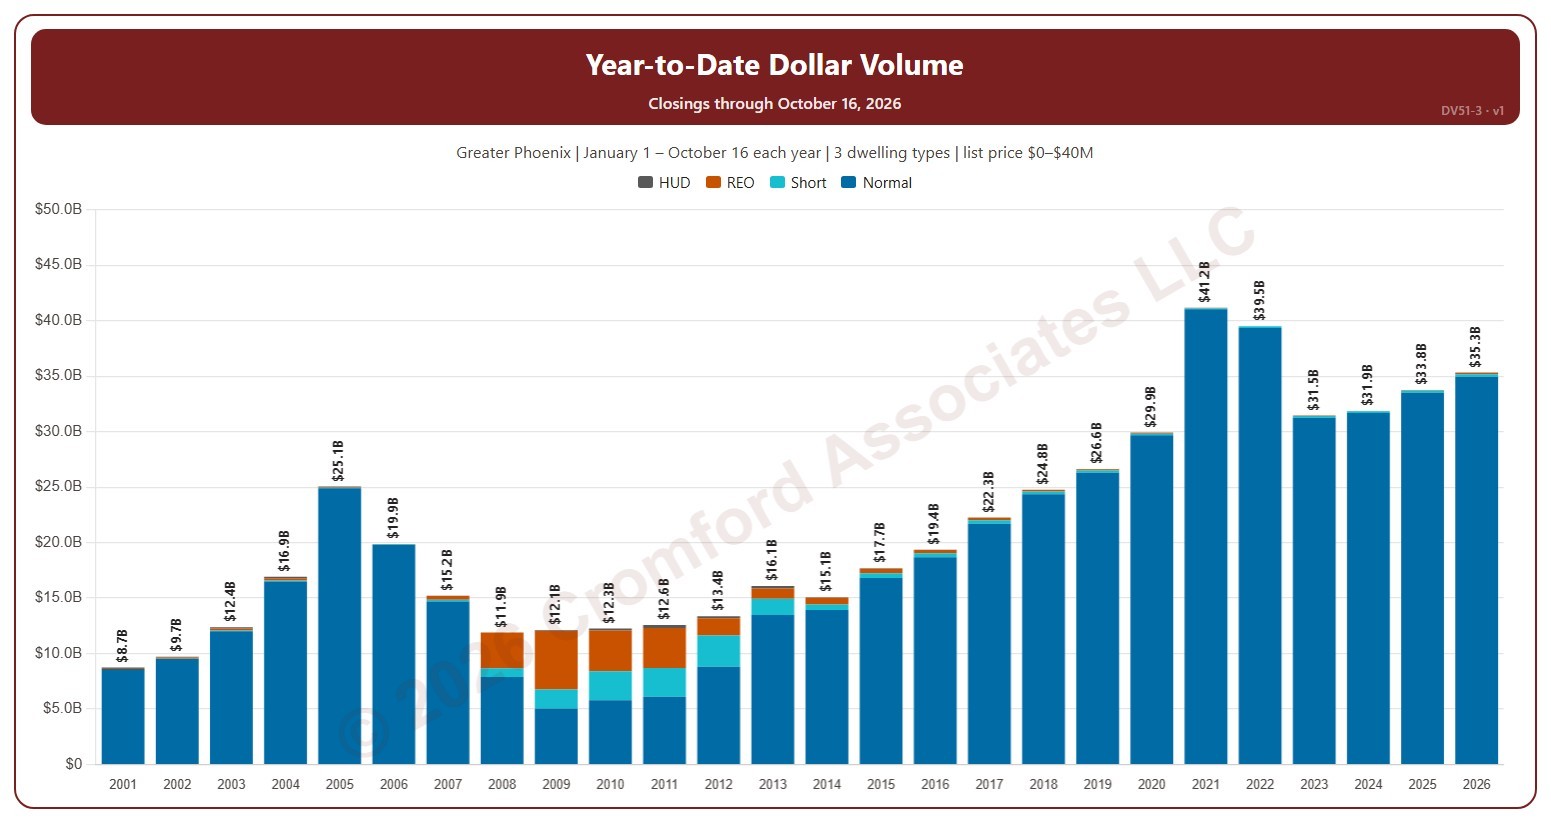
This chart compares the dollar volume of closings year to date: every year is cut to 1 January – the day of the latest closing, so this year so far can be read against the same days of earlier years. Dollar volume is the total of the sale prices of the homes that closed on ARMLS, each bar split by transaction type (normal, short sale, lender-owned, HUD).

It opens on 2001 to date; drag the handles of the date slider under the chart to choose the years shown, as far back as 2001. Use the Month box to count only some months of the year. The chart is updated every day.

It opens on the Greater Phoenix area: the counties, cities, and ZIP codes that make it up are ticked to start with. Tick or untick any of them to change the area, including counties beyond Greater Phoenix. Narrow it further with the Dwelling Type, Transaction Type, and New / Resale boxes and the list price, home size, and year built sliders.

Hover over a bar to see each transaction type and the year-to-date total.

Extreme Statistics

About this chart

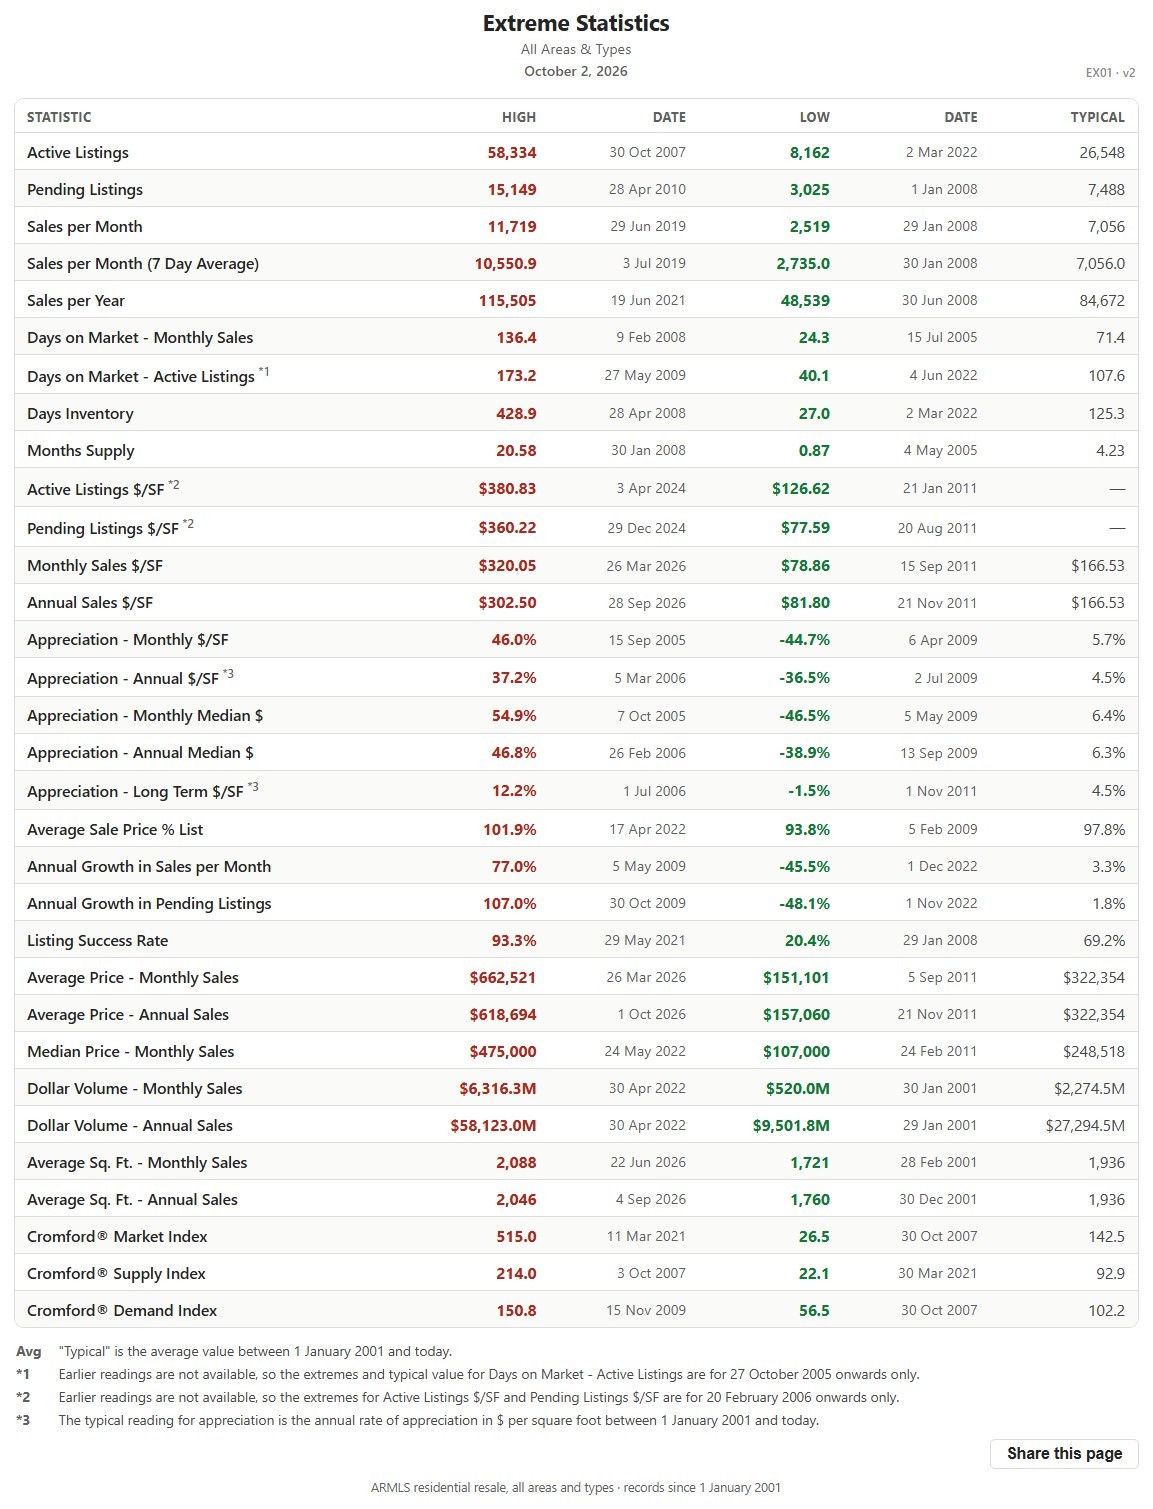
This table lists the record high and record low of more than 30 market measures for the whole ARMLS market, all areas and all dwelling types, each with the date it happened, since January 1, 2001, together with a typical value for comparison.

It shows how extreme past markets have been and what a typical reading looks like, a yardstick for the current figures on the other charts. The numbered notes under the table explain the few measures that are counted differently.

Price Range Market Snapshot

About this chart

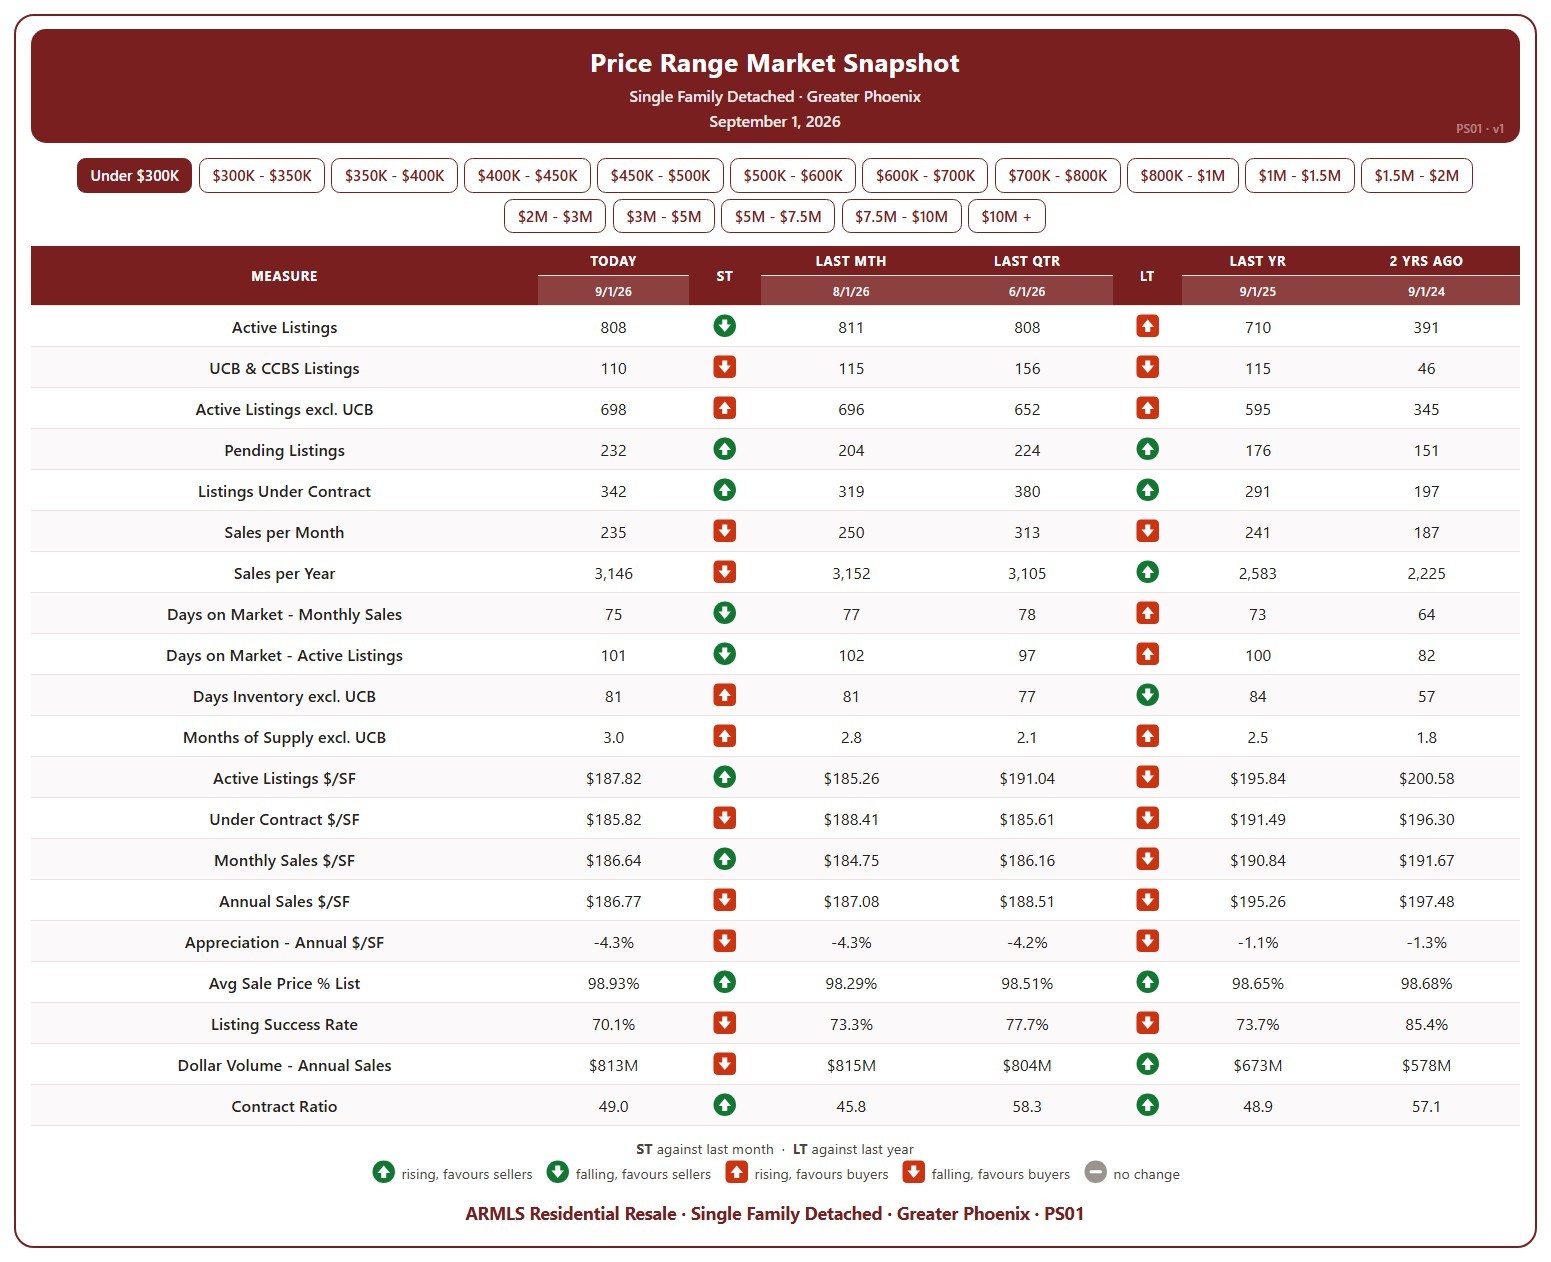
This table shows 20 measures of the market for single-family detached homes in Greater Phoenix, for one list price band at a time, from under $300K up to $10M and over. Pick the band with the buttons at the top.

Each measure is shown today (the 1st of the month), a month ago, a quarter ago, a year ago, and two years ago, so you can see how that part of the market has moved. The ST and LT marks compare today with last month and with last year, colored by whether the change favors sellers or buyers.

It covers supply (active listings, UCB / CCBS, pending, days inventory, months of supply), demand (sales per month and per year, days on market, listing success rate, contract ratio), and pricing ($/SF of active, under contract, and sold homes, appreciation, sale price as a percentage of list, and dollar volume).

Dollar Volume – Long Term

About this chart

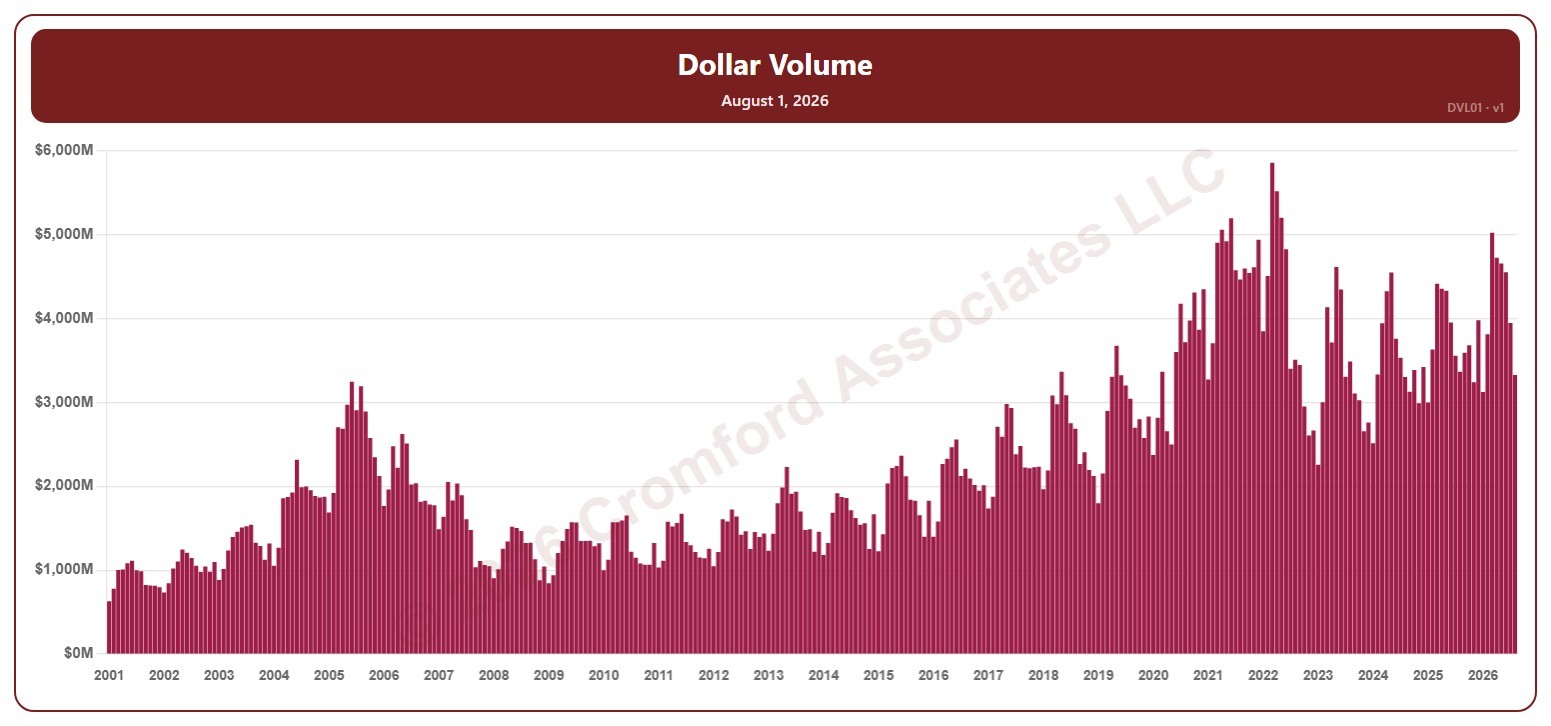
This chart shows dollar volume: the total value of the homes that closed in a month, for the whole ARMLS market, all areas and all dwelling types, as one bar per month since January 2001. Each bar covers the closings in that calendar month. It reflects both how many homes closed and the prices they sold for.

Hover over a bar to see the exact figure for that month.

Dollar Volume – Weekly

About this chart

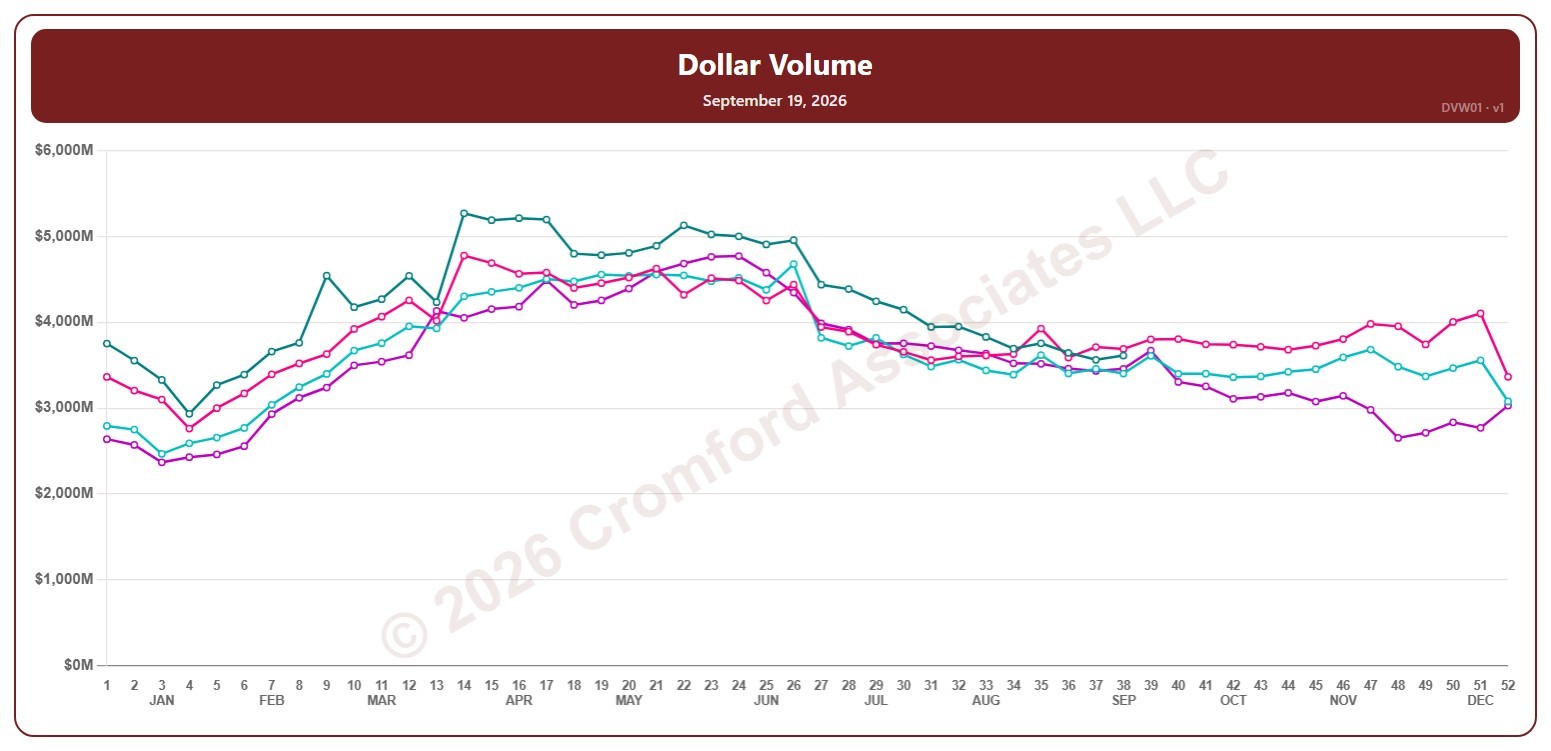
This chart shows dollar volume: the total value of the homes that closed in a month, for the whole ARMLS market, all areas and all dwelling types, measured every week. Each point covers the closings in the month up to that Saturday. It reflects both how many homes closed and the prices they sold for.

Each year has its own line, laid out by week of the year (each Saturday), so you can compare this year with earlier years at the same point in the season. It opens on the last four years; tick any year back to 2001 in the Year panel.

Hover over a line to see the exact figure for that week.

Year to Date Dollar Volume

About this chart

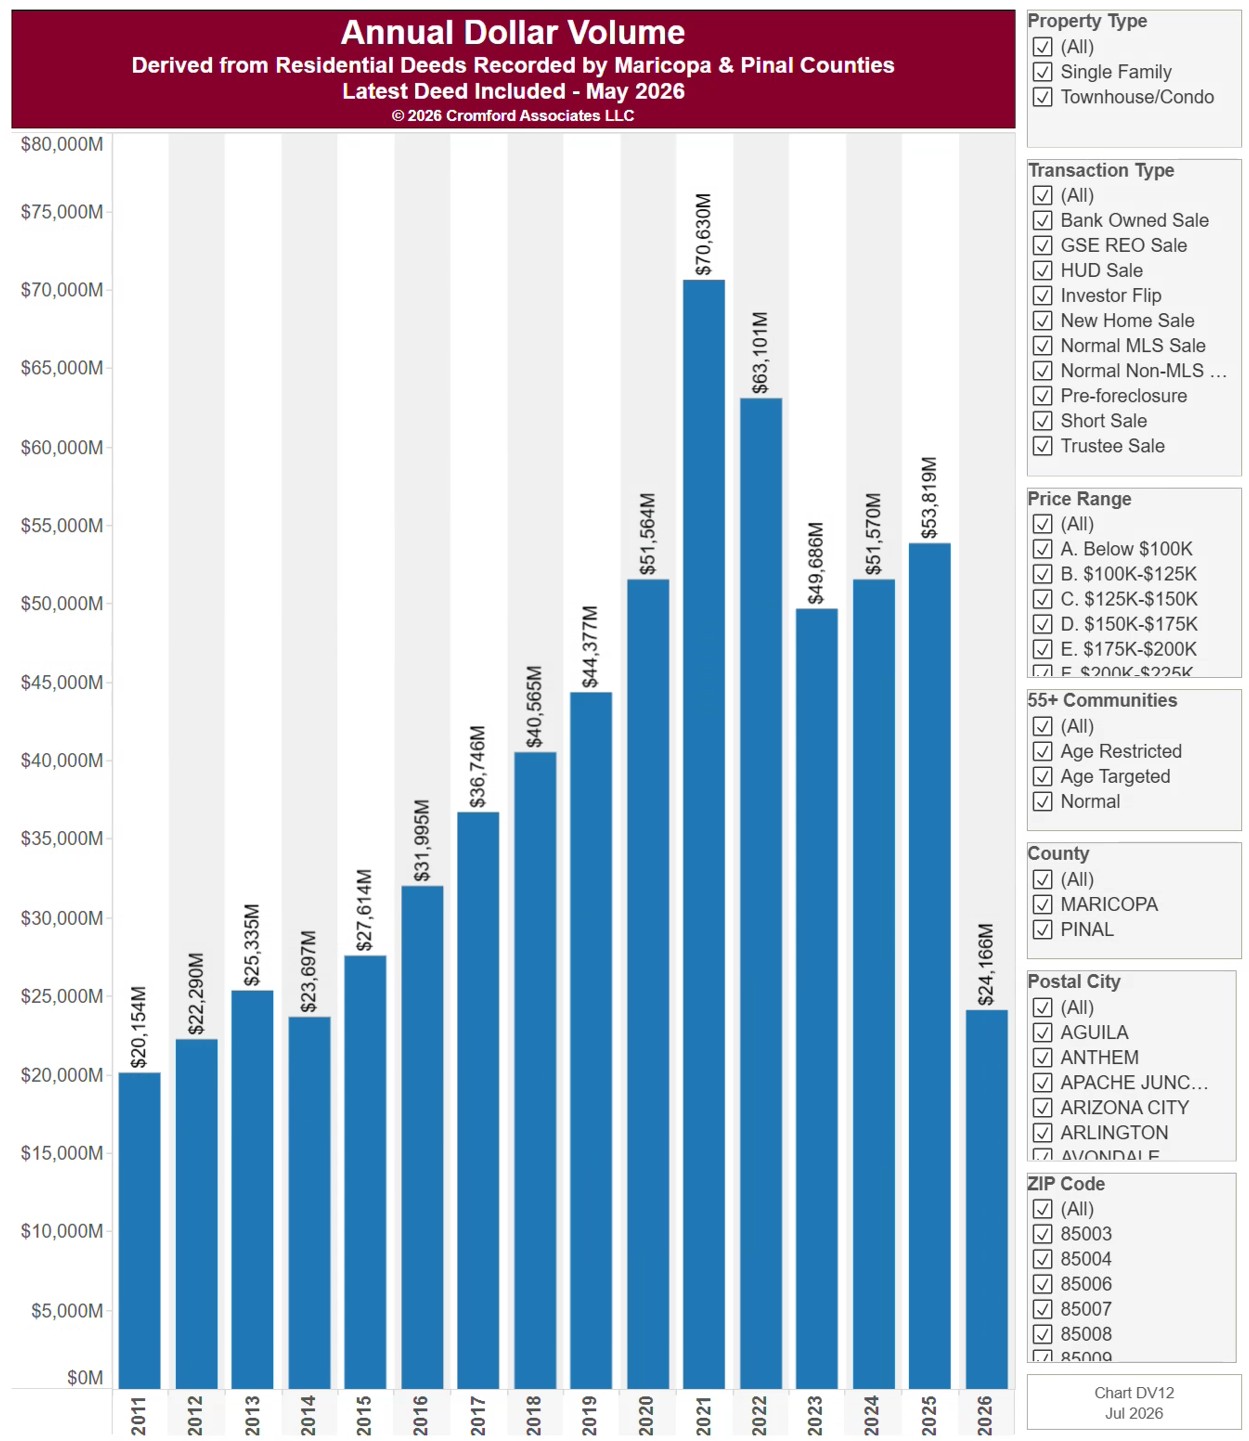
This chart shows dollar volume: the total value of the homes sold each year since 2011, from residential deeds recorded by Maricopa and Pinal Counties, with every year cut to the same months (January to the latest month recorded), so the current year can be compared fairly with earlier ones. Because it is built from recorded deeds, it covers every recorded sale, not just homes listed on ARMLS: new homes, private sales, and investor deals are all included.

It opens on Maricopa and Pinal Counties with everything included. Narrow it with the County, City, and ZIP panels, the Transaction Type, Property Type, and 55+ Communities boxes, and the sale price slider.

The records run to the end of last month and are updated monthly. Hover over a bar to see the exact figure for that year.

Market Dashboard

About this chart

This dashboard summarizes the current state of the residential market for all areas and types covered by ARMLS. It is measured daily and shows where the market stands today; for longer-term trends, use the individual charts in the Analysis section.

Use Select Type of Data to switch between 14 views: Sale Price / Sq Ft, Cromford® Index, Inventory, Active Listings, Under Contract, Expired Listings, Canceled Listings, List Price / Sq Ft, Closed Listings, Dollar Volume, Days on Market, Success Rate, Square Feet, and Sale Price $.

Each tile compares a recent figure with an earlier one and is colored to show whether the change is good for sellers, bad for sellers, or neither. The chart beneath the tiles shows the last 13 months, month by month. Hover over it to see each figure.

Monthly Dollar Volume by Region

About this chart

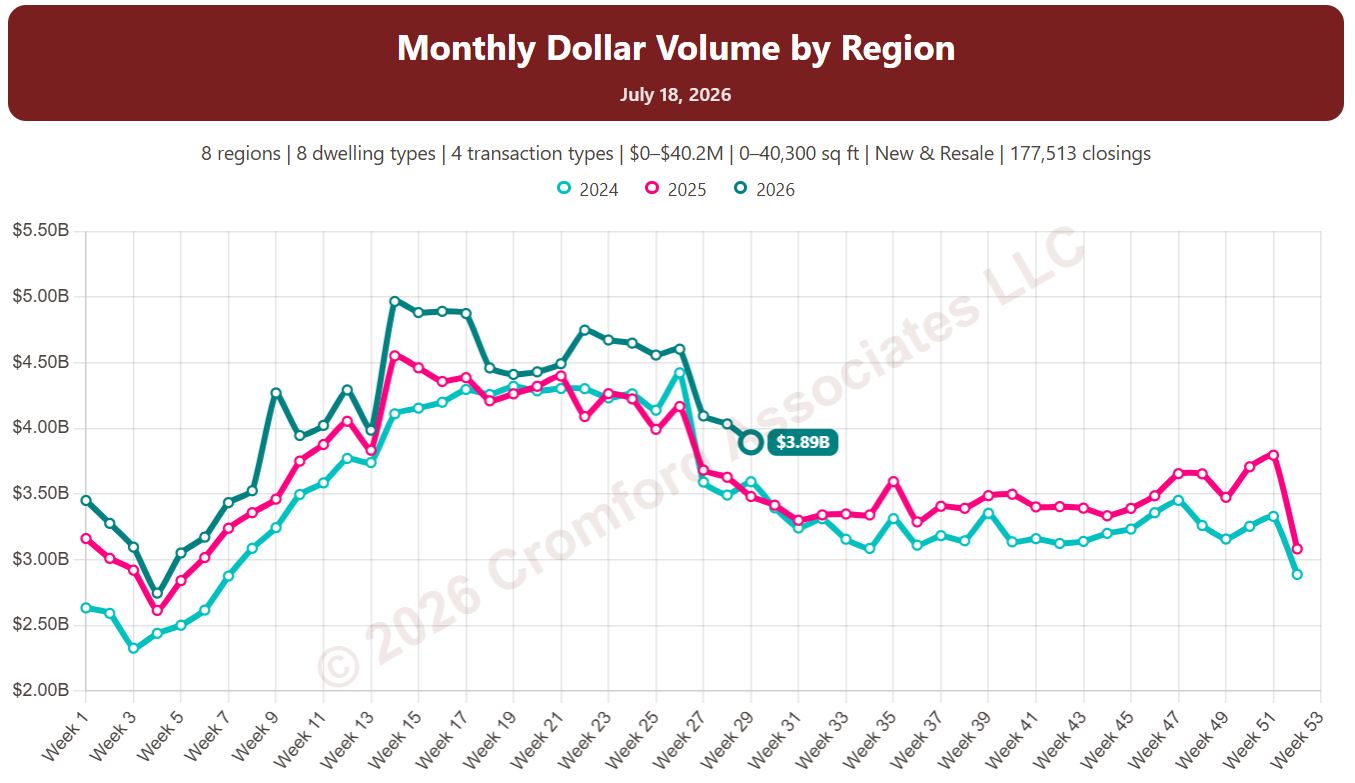
This chart shows dollar volume: the total value of the homes that closed through ARMLS in the month up to each week, measured every week. It reflects both how many homes closed and the prices they sold for.

Each year has its own line, laid out by week of the year, so you can compare this year with earlier years at the same point in the season. It opens on the last three years; tick any year back to 2001 in the Year panel.

It opens with every region included. Use the Region panel to focus on one region or compare a combination of them. Narrow it with the Dwelling Type, Transaction Type, and New / Resale boxes and the sales price and home size sliders.

Hover over a line to see the exact figure for that week.

Monthly Dollar Volume by City and ZIP Code

About this chart

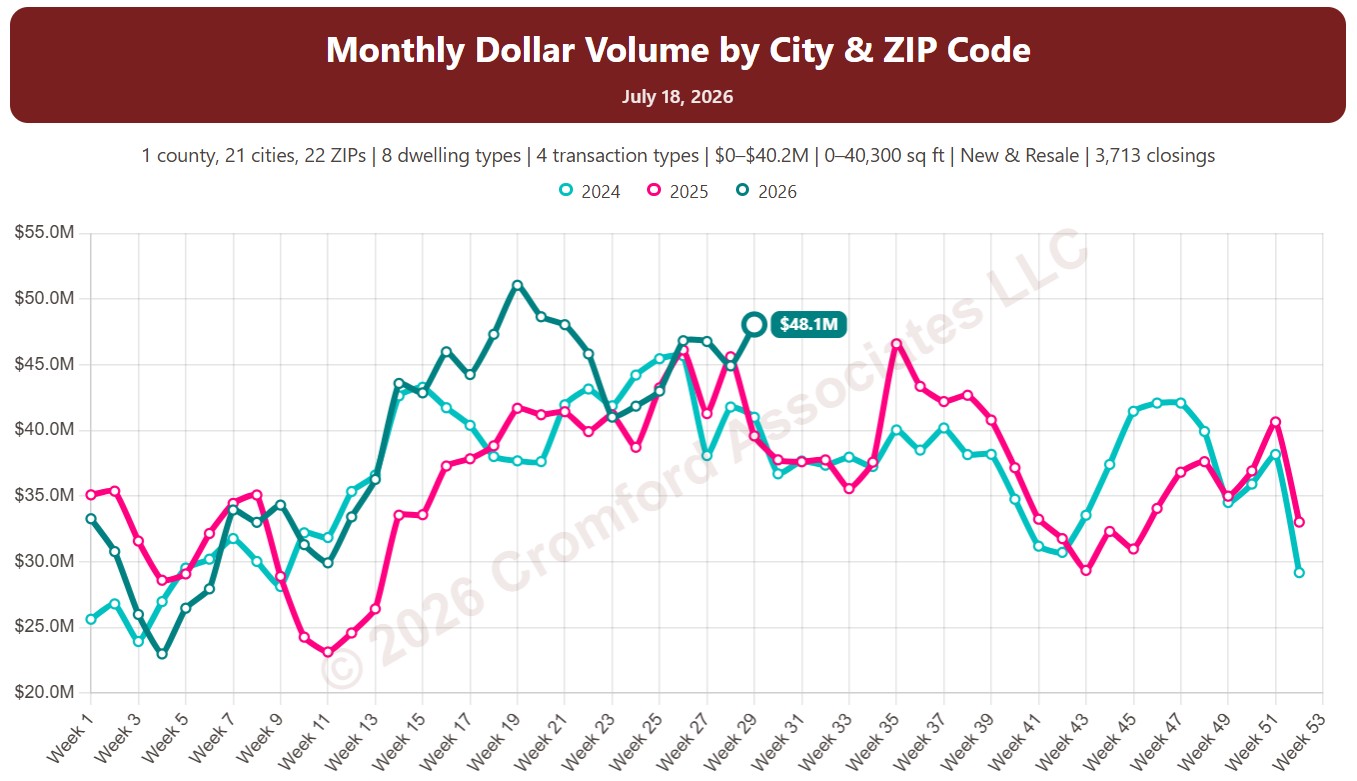
This chart shows dollar volume: the total value of the homes that closed through ARMLS in the month up to each week, measured every week. It reflects both how many homes closed and the prices they sold for.

Each year has its own line, laid out by week of the year, so you can compare this year with earlier years at the same point in the season. It opens on the last three years; tick any year back to 2001 in the Year panel.

It opens on Maricopa and Pinal Counties with every city and ZIP code included. Use the County, City, and ZIP panels to focus on any area, from a whole county down to a single ZIP code. Narrow it with the Dwelling Type, Transaction Type, and New / Resale boxes and the sales price and home size sliders.

Hover over a line to see the exact figure for that week.