About this chart
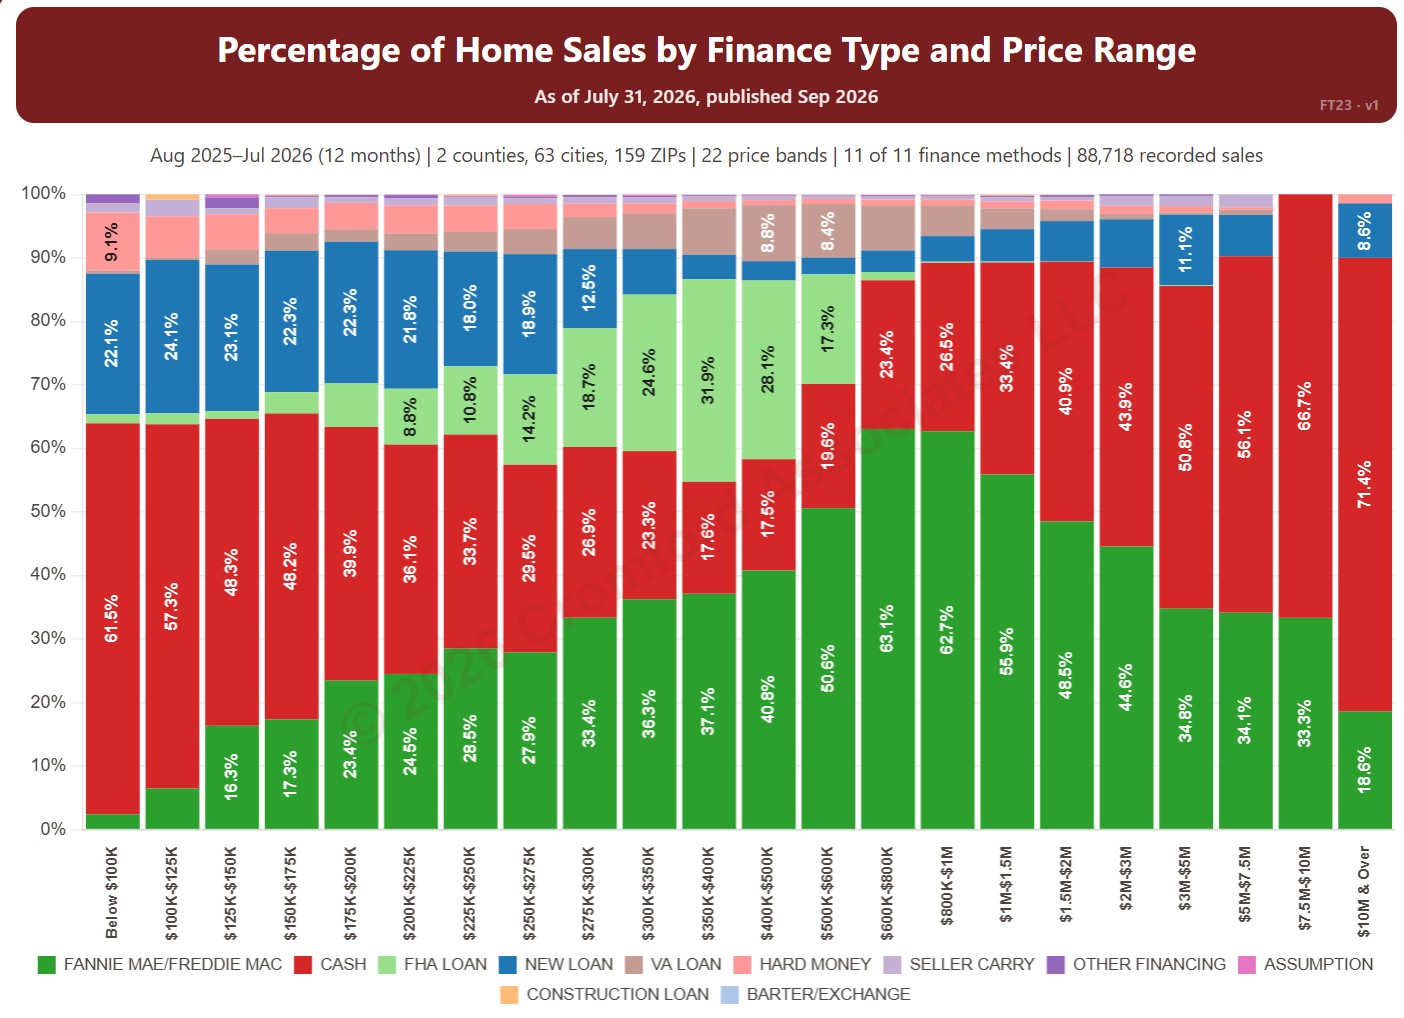
This chart shows how homes were paid for in each of 22 price bands, from below $100K to $10M and over, from residential deeds recorded by Maricopa and Pinal Counties. Each bar adds up to 100% and is split by finance method, such as cash, Fannie Mae / Freddie Mac, FHA, and VA, so you can see how the way buyers pay changes with price.
It opens on the last 12 months of records; use the Recording Month slider to choose the months covered. It opens on Maricopa and Pinal Counties with everything included; narrow it with the County, City, and ZIP panels and the Property Type, 55+ Communities, Finance Method, Transaction Type, and Price Range boxes.
Hover over a bar to see each share for that price band.