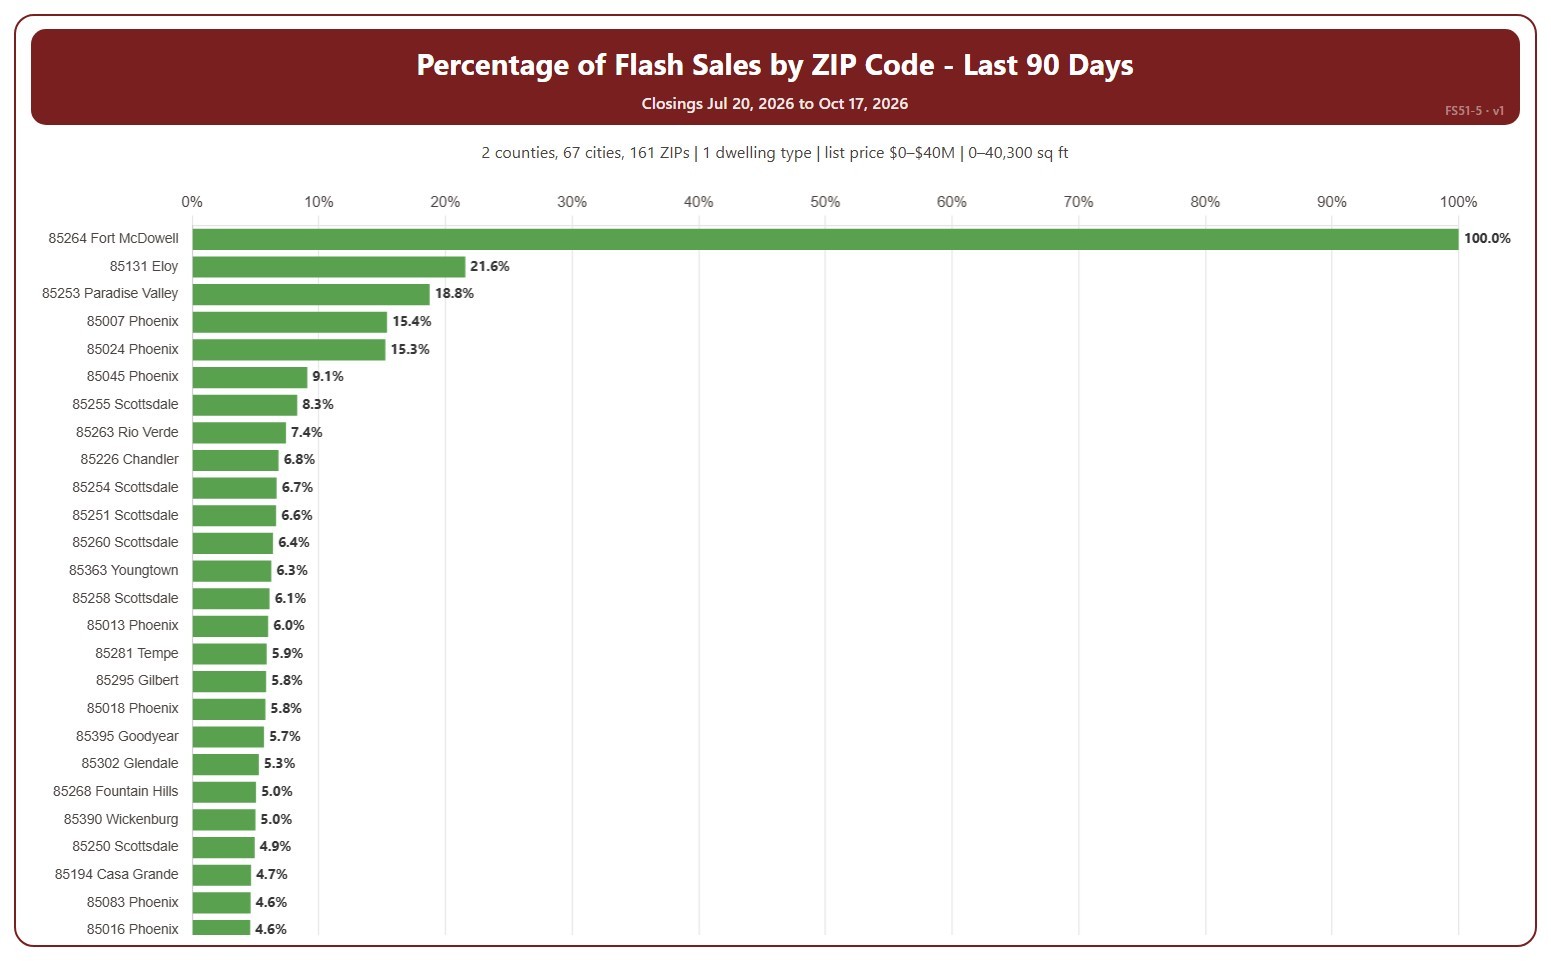
Percentage Flash Sales by ZIP Code

About this chart

This chart shows flash sales as a percentage of all closings in each ZIP code, highest first. A ZIP code with only a few closings can show 0% or 100%. A flash sale is a closing that spent 1 day or less in the MLS (0 or 1 days on market, cumulative), usually a home that sold as soon as it was listed or was listed only to record a sale already agreed.

It covers the last 90 days to today; choose the last 30 days in the Period box instead. The chart is updated every day.

It opens on Maricopa and Pinal counties and single-family detached homes, as the original chart did. Use the County, City, and ZIP Code boxes to change the area, and narrow it further with the Dwelling Type and New / Resale boxes and the list price, home size, and year built sliders.

Hover over a bar to see the flash sales and all closings in the ZIP code.
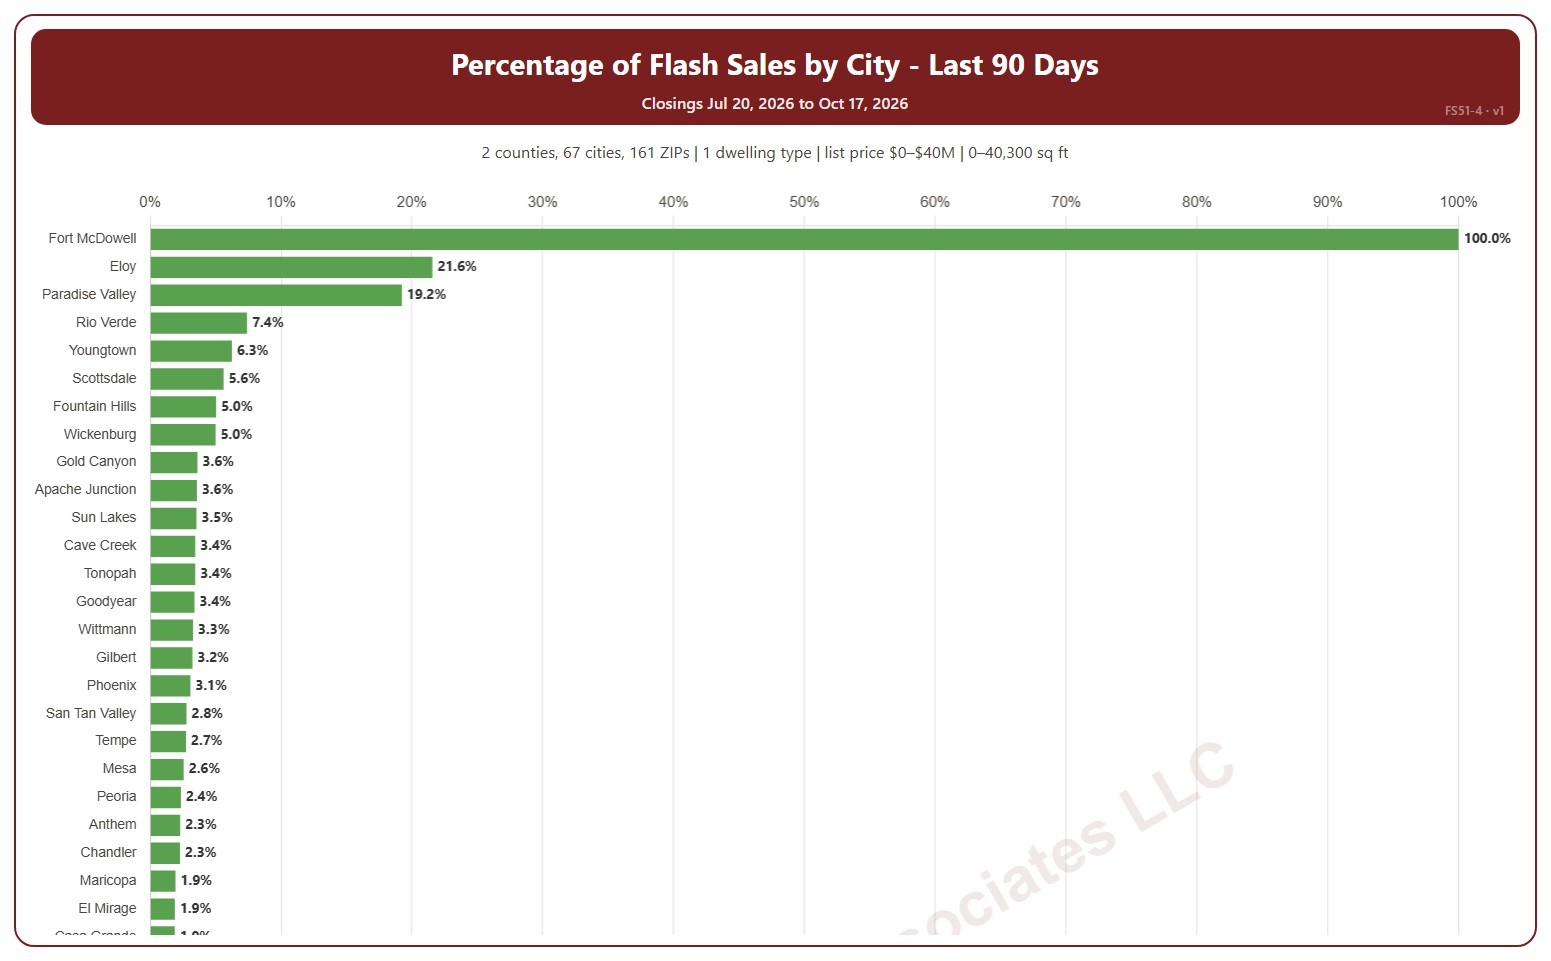
Percentage Flash Sales by City

About this chart

This chart shows flash sales as a percentage of all closings in each city, highest first. A city with only a few closings can show 0% or 100%. A flash sale is a closing that spent 1 day or less in the MLS (0 or 1 days on market, cumulative), usually a home that sold as soon as it was listed or was listed only to record a sale already agreed.

It covers the last 90 days to today; choose the last 30 days in the Period box instead. The chart is updated every day.

It opens on Maricopa and Pinal counties and single-family detached homes, as the original chart did. Use the County, City, and ZIP Code boxes to change the area, and narrow it further with the Dwelling Type and New / Resale boxes and the list price, home size, and year built sliders.

Hover over a bar to see the flash sales and all closings in the city.

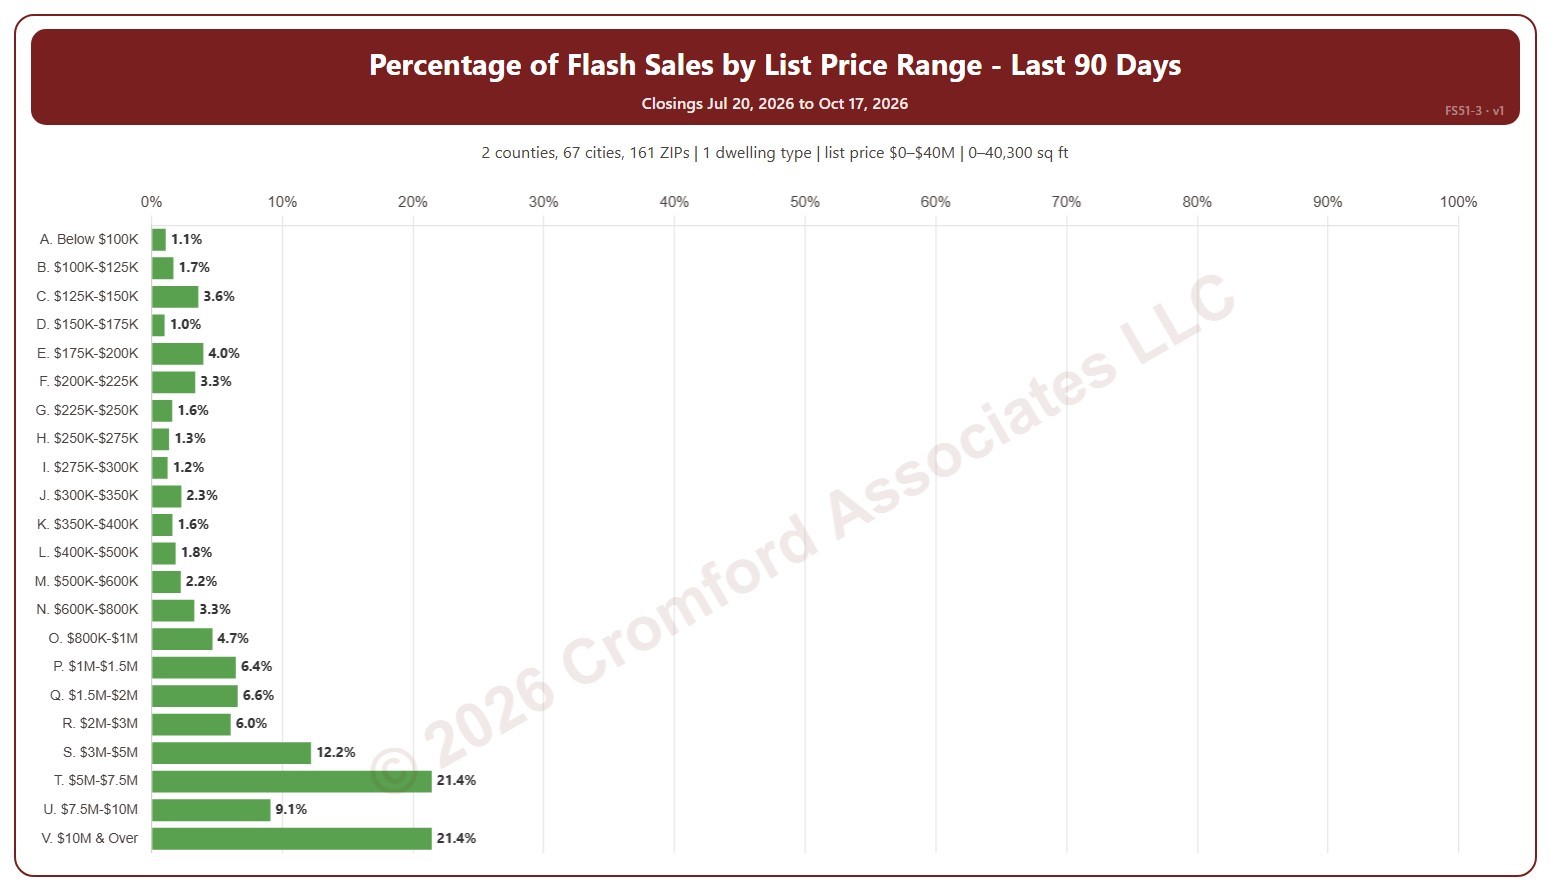
Percentage of Flash Sales by Price Range

About this chart

This chart shows flash sales as a percentage of all closings in each list price range. A flash sale is a closing that spent 1 day or less in the MLS (0 or 1 days on market, cumulative), usually a home that sold as soon as it was listed or was listed only to record a sale already agreed.

It covers the last 90 days to today; choose the last 30 days in the Period box instead. The chart is updated every day.

It opens on Maricopa and Pinal counties and single-family detached homes, as the original chart did. Use the County, City, and ZIP Code boxes to change the area, and narrow it further with the Dwelling Type and New / Resale boxes and the list price, home size, and year built sliders.

Hover over a bar to see the flash sales and all closings in the range.

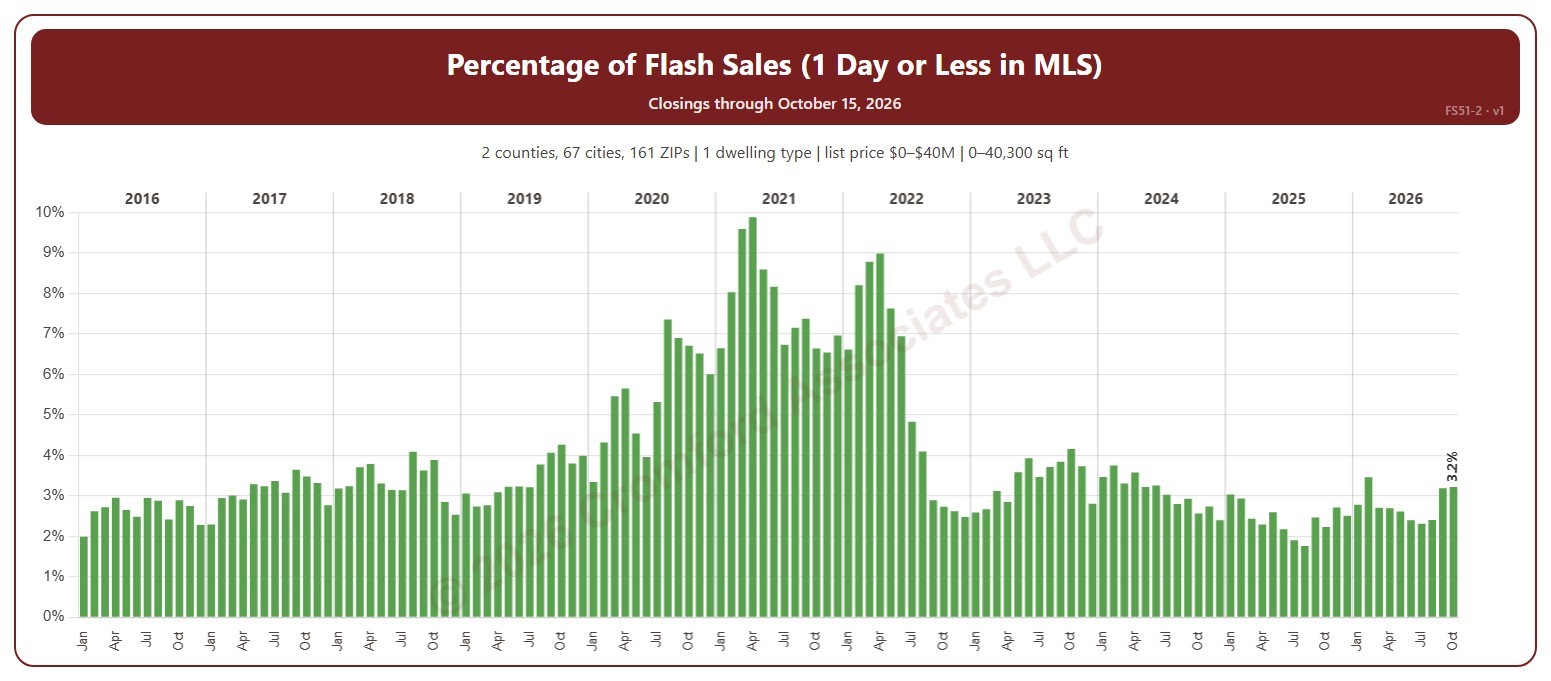
Percentage of Flash Sales

About this chart

This chart shows flash sales as a percentage of all closings each month. A flash sale is a closing that spent 1 day or less in the MLS (0 or 1 days on market, cumulative), usually a home that sold as soon as it was listed or was listed only to record a sale already agreed.

It opens on 2016 to date; tick other years in the Year box to go back as far as 2001, and use the Month box to count only some months of the year. The chart is updated every day.

It opens on Maricopa and Pinal counties and single-family detached homes, as the original chart did. Use the County, City, and ZIP Code boxes to change the area, and narrow it further with the Dwelling Type and New / Resale boxes and the list price, home size, and year built sliders.

Hover over a bar to see the flash sales, all closings, and the percentage for the month.

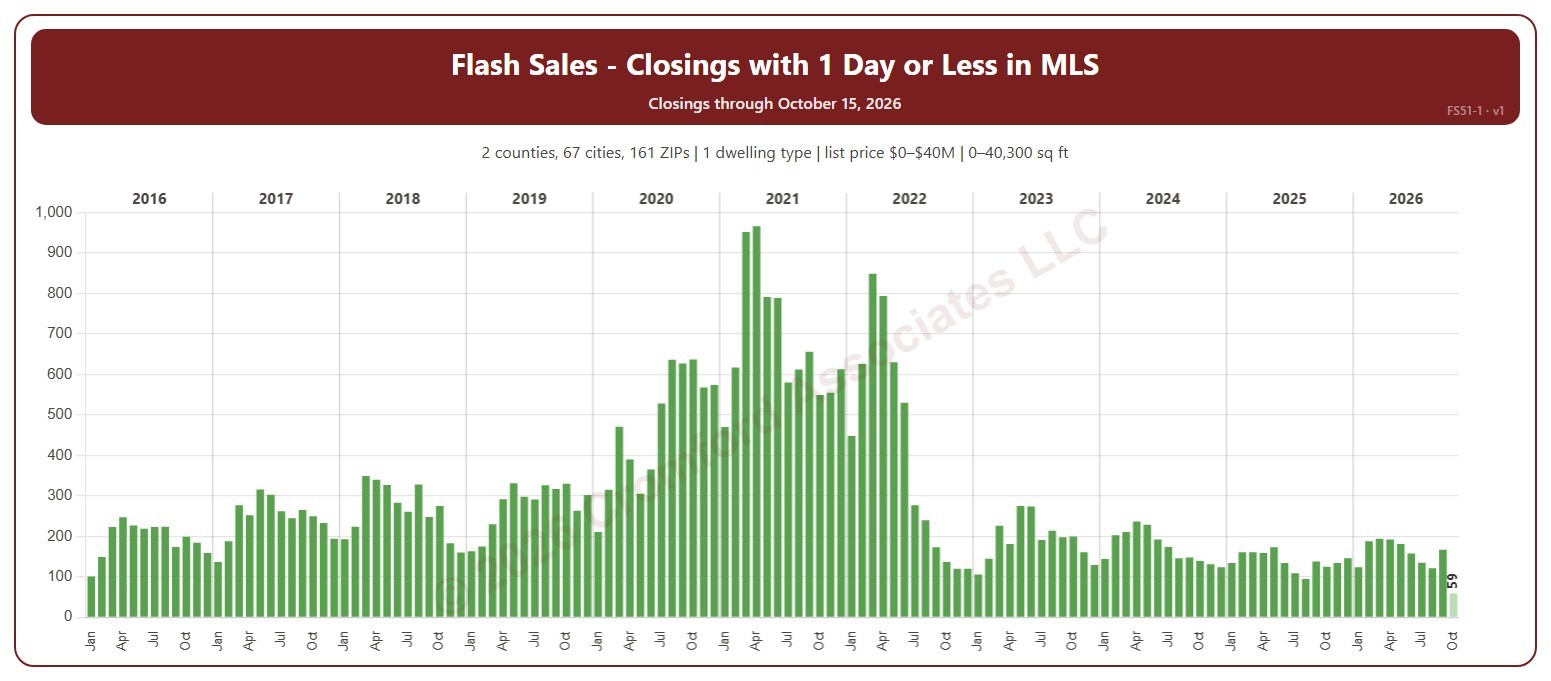
Flash Sales – Closings with 1 Day or Less in MLS

About this chart

This chart shows the number of flash sales each month. A flash sale is a closing that spent 1 day or less in the MLS (0 or 1 days on market, cumulative), usually a home that sold as soon as it was listed or was listed only to record a sale already agreed.

It opens on 2016 to date; tick other years in the Year box to go back as far as 2001, and use the Month box to count only some months of the year. The chart is updated every day. The current month is the month so far and is drawn lighter.

It opens on Maricopa and Pinal counties and single-family detached homes, as the original chart did. Use the County, City, and ZIP Code boxes to change the area, and narrow it further with the Dwelling Type and New / Resale boxes and the list price, home size, and year built sliders.

Hover over a bar to see the flash sales, all closings, and the percentage for the month.