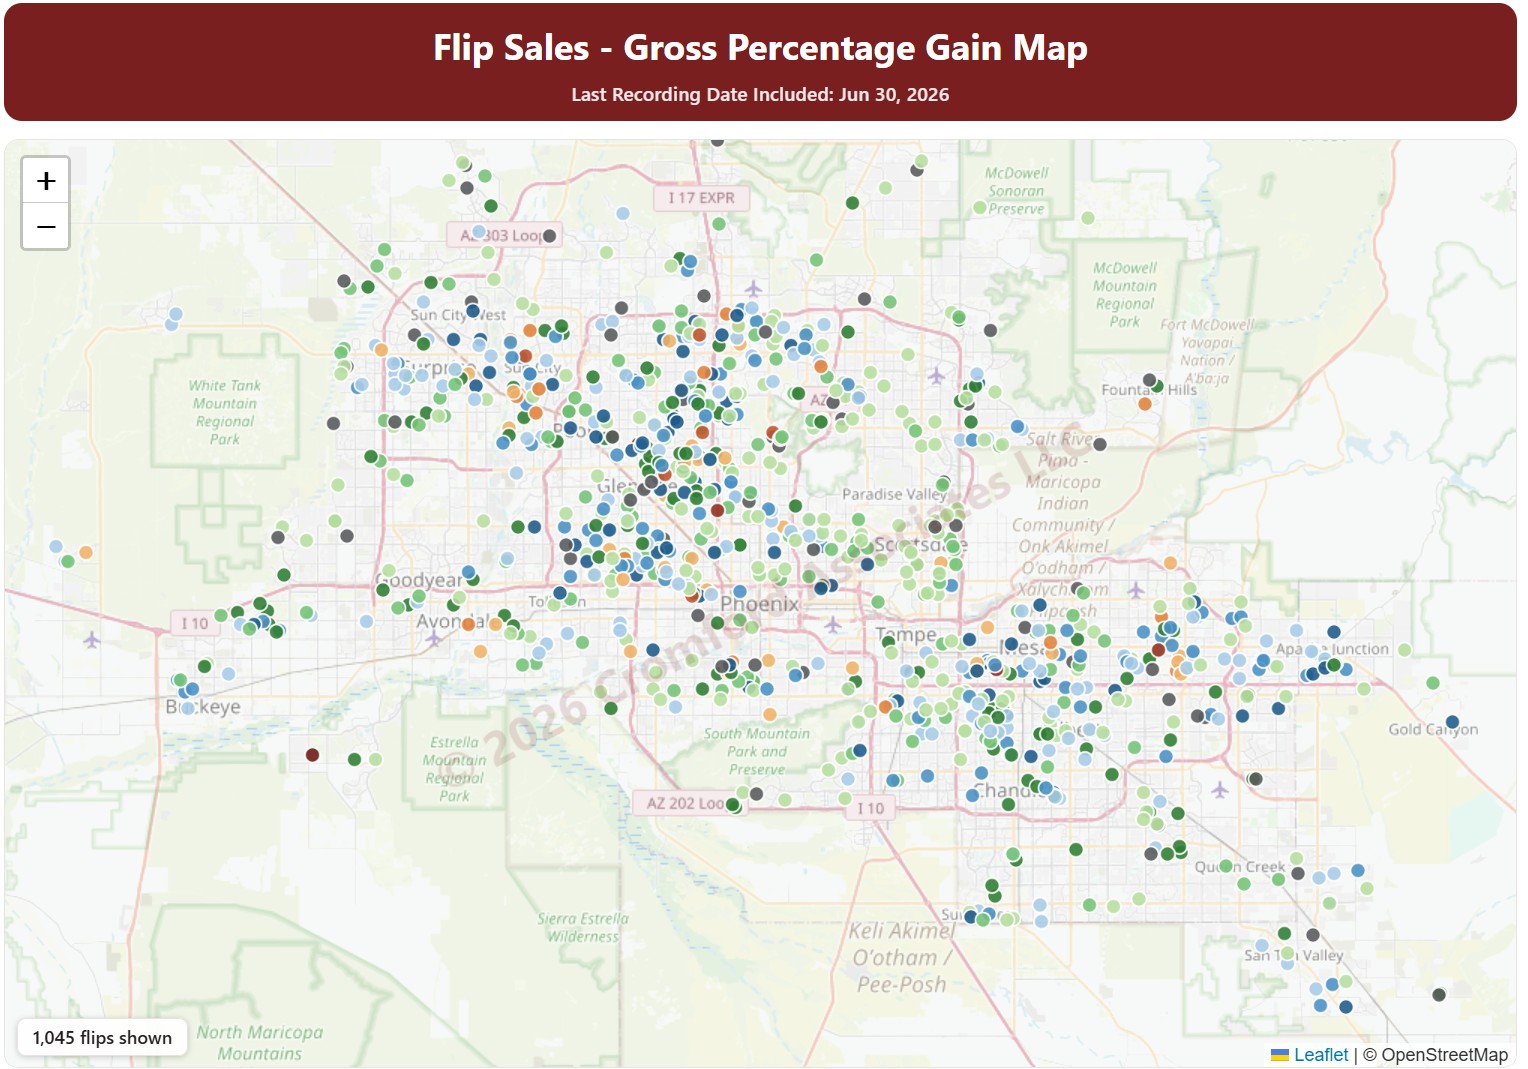
Flip Sales – Gross Percentage Gain Map

About this chart

This map shows fix-and-flip resales in Maricopa and Pinal Counties: homes bought, usually renovated, and resold by an investor. Each dot is one flip, colored by the gross percentage gain between the purchase price and the resale price.

Purchases by Opendoor and OfferPad are left out by default; tick them under Buyers to include them. Use the County, City, and ZIP Code panels and the Property Type, hold days, profit, and sales price filters to narrow the flips shown.

The Last Month, Last 3 Months, Last 6 Months, and Full range buttons, and the arrows, set the dates covered.
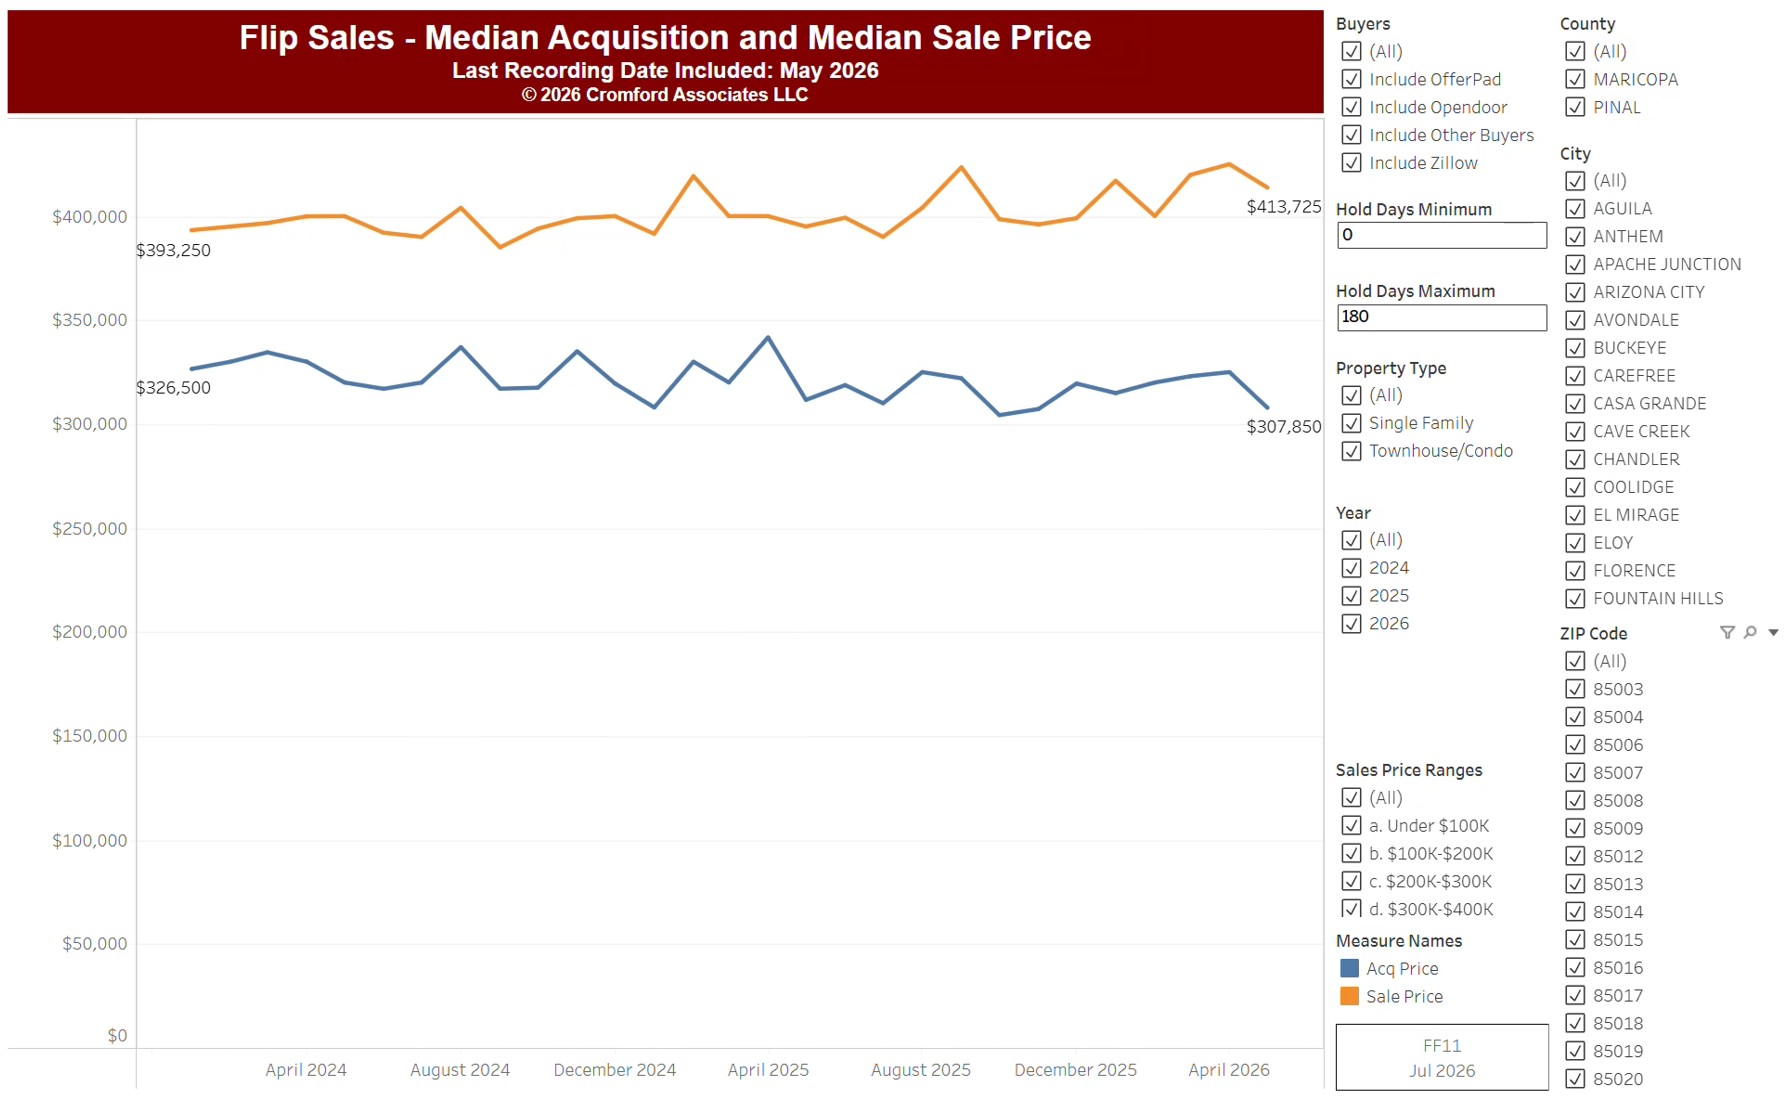
Flip Sales – Median Acquisition and Sales Prices

About this chart

This chart follows fix-and-flip sales, from residential deeds recorded by Maricopa and Pinal Counties: homes bought and resold by an investor. Its two lines show, by calendar month since January 2014, the median price flippers paid and the median price they resold for. The gap between the lines is the typical gross margin on a flip, before renovation and selling costs.

It opens on every month since January 2014, with Maricopa and Pinal Counties and all buyers included, Opendoor, OfferPad, Zillow, and Homes2X among them; untick them under Buyers to leave them out. Choose the period with the Recording Month slider, and narrow it with the County, City, and ZIP panels, the Property Type boxes, and the sale price and hold days sliders.

The records run to the end of last month and are updated monthly. Hover over the chart to see the figures for that month.