Mortgage Rates: Builder Lenders and Other Lenders

About this chart

This chart compares the median interest rate on home purchase loans from lenders affiliated with home builders against the median from all other lenders, each year since 2018, in Maricopa and Pinal Counties. The distance between the two lines is the gap, which you can read in the tooltip.

To compare like with like, it uses only 30-year fixed first mortgages on one-unit, site-built homes, and it opens on owner-occupied loans. Adjustable rates, other loan terms, and assumed loans are left out. The source is the loan records lenders file under the Home Mortgage Disclosure Act. Cash buyers are not in it, and neither are loans from small lenders that do not have to report.

The chart shows a gap in rates. It does not show who paid for it. The records have no buydown field, and they record the rate on the note, so a temporary buydown such as a 2-1 does not appear here at all. They do not separate new homes from resales either. Other lenders include some that work with builders without being owned by them, so their loans on new homes sit in the Other line.

The records give a census tract, not an address, so the City filter is approximate: each tract counts toward the city where most of its recorded home sales fall. There is no ZIP filter.

Narrow it with the County and City panels, the Occupancy, Loan Type, and Lender boxes, and the property value and loan amount sliders. Untick lenders to compare one builder lender against the rest. The records are published once a year, each spring. Hover over a year to see each line’s rate and number of loans, the gap, the builder lenders’ share of loans, and the median discount points.
Median Sales Price and Estimated Monthly Payment by Region

About this chart

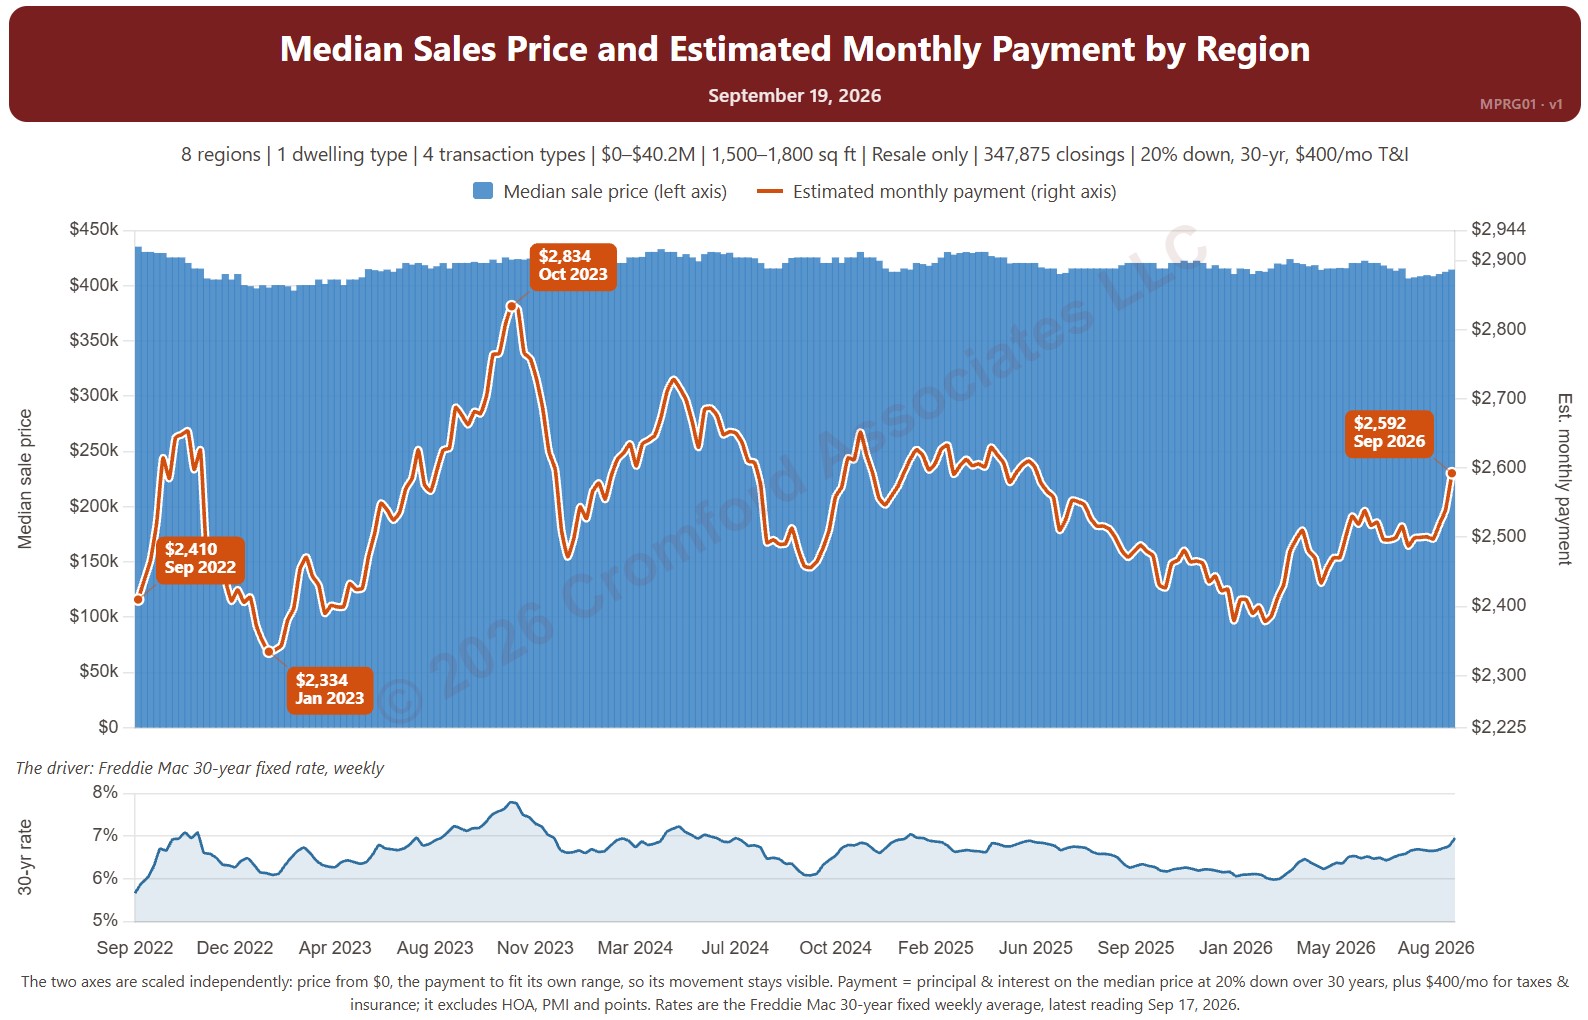
This chart sets the median sales price beside the estimated monthly payment needed to buy a home at that price, measured every week, with the 30-year fixed mortgage rate (Freddie Mac Primary Mortgage Market Survey®) in the panel below. It shows how affordability changes as both prices and rates move.

The default view is single-family resale homes of every size over the last four years. The payment assumes 20% down, a 30-year loan, and taxes and insurance of 1.2% of the sales price a year. The Payment panel changes the assumptions, and Reset assumptions puts them back.

It opens on the eight Greater Phoenix regions. Use the Region panel to focus on one region or compare a combination of them. Narrow it with the Dwelling Type, Transaction Type, and New / Resale boxes and the sales price and home size sliders. The 1 yr, 3 yr, 5 yr, 10 yr, and Full range buttons set the stretch of history shown.

Hover over the chart to see the figures for that week.

Median Sales Price and Estimated Monthly Payment by City and ZIP Code

About this chart

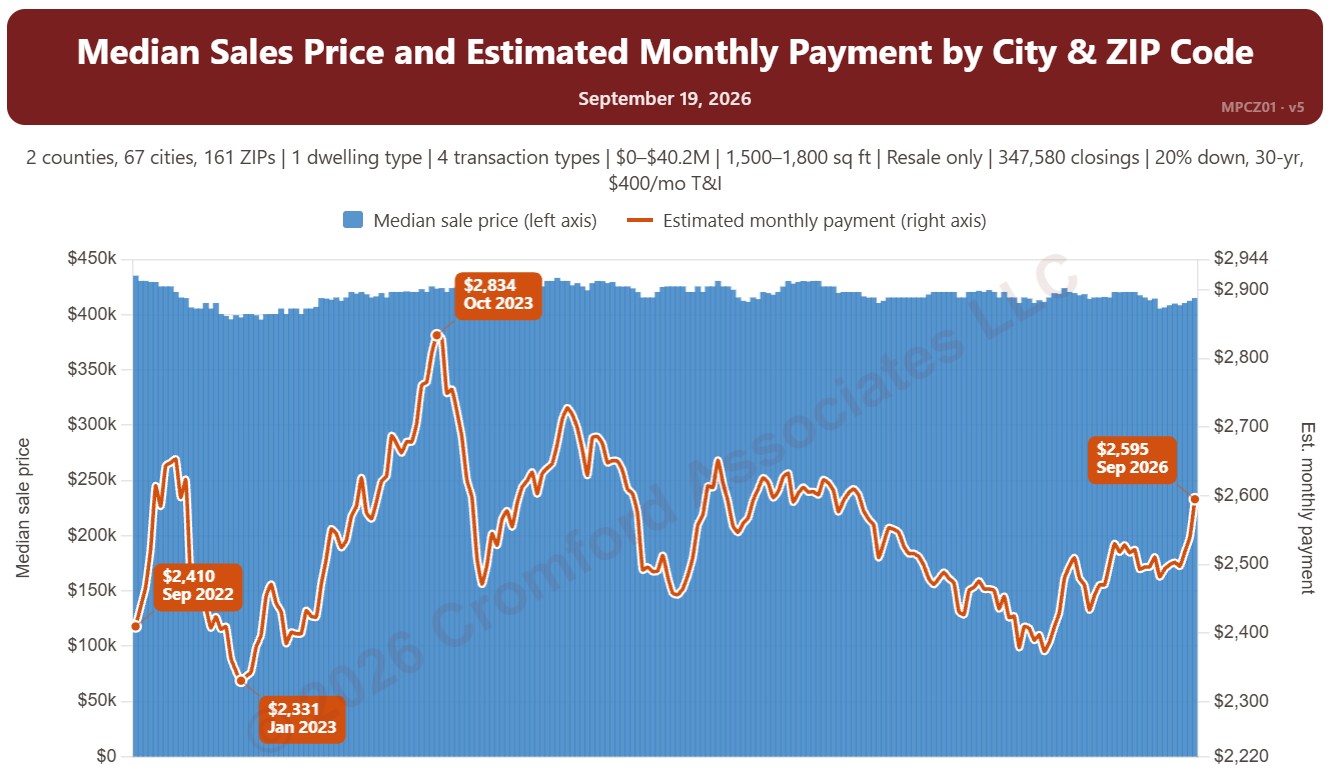
This chart sets the median sales price beside the estimated monthly payment needed to buy a home at that price, measured every week, with the 30-year fixed mortgage rate (Freddie Mac Primary Mortgage Market Survey®) in the panel below. It shows how affordability changes as both prices and rates move.

The default view is single-family resale homes of every size over the last four years. The payment assumes 20% down, a 30-year loan, and taxes and insurance of 1.2% of the sales price a year. The Payment panel changes the assumptions, and Reset assumptions puts them back.

It opens on Maricopa and Pinal Counties with every city and ZIP code included. Use the County, City, and ZIP panels to focus on any area, from a whole county down to a single ZIP code. Narrow it with the Dwelling Type, Transaction Type, and New / Resale boxes and the sales price and home size sliders. The 1 yr, 3 yr, 5 yr, 10 yr, and Full range buttons set the stretch of history shown.

Hover over the chart to see the figures for that week.

30 Year Fixed Mortgage Interest Rate

About this chart

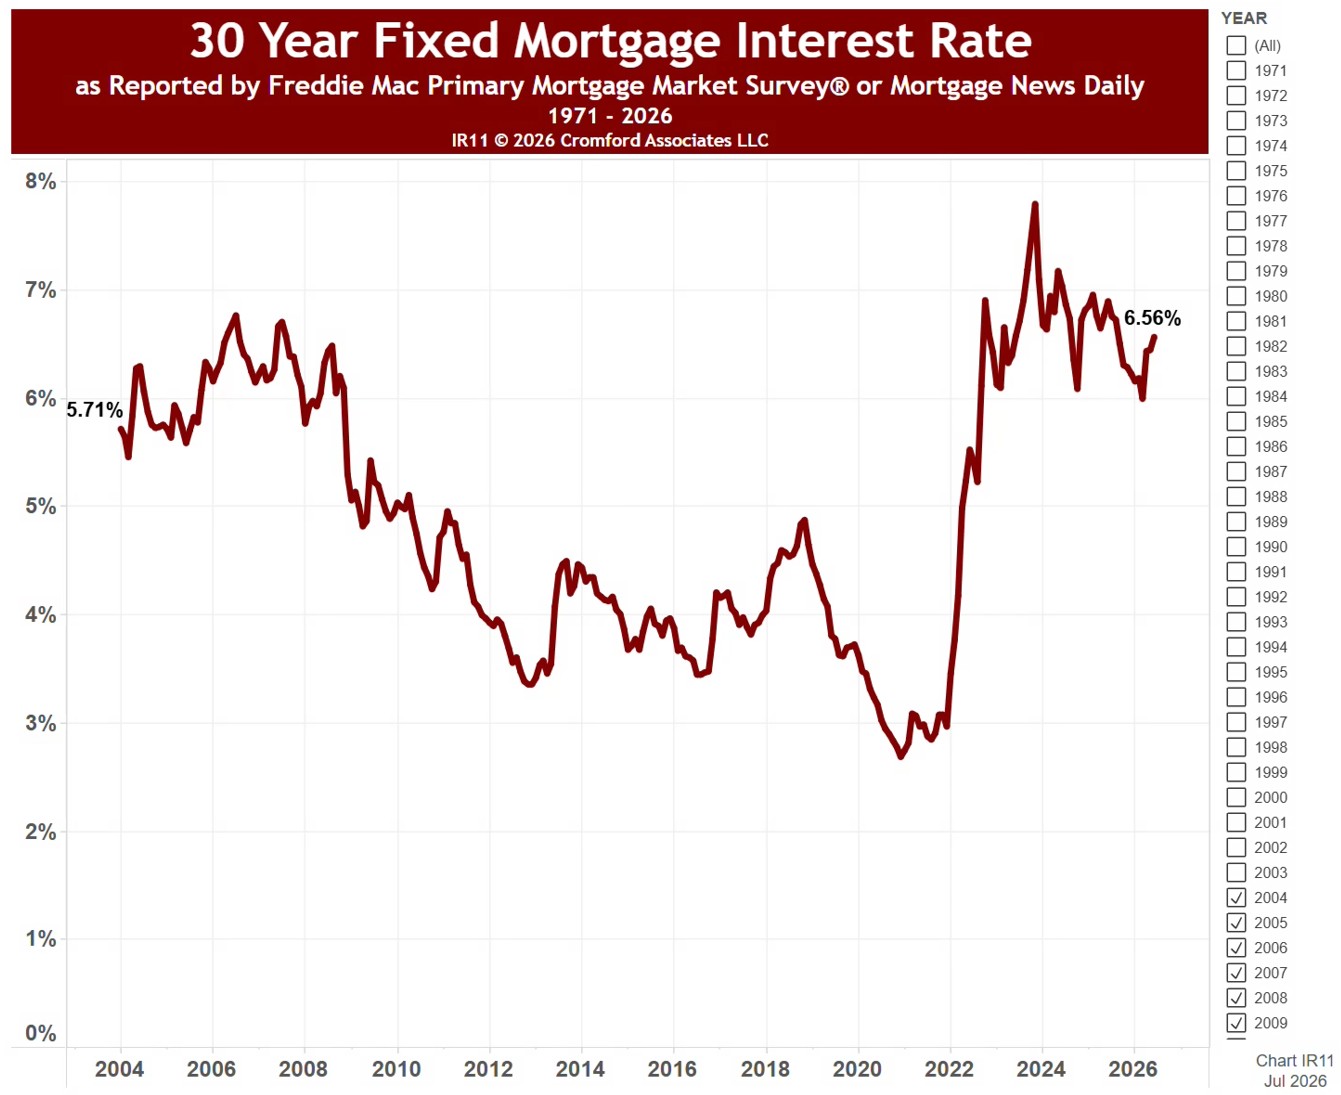
This chart shows the average 30-year fixed mortgage rate each month since April 1971, as reported by the Freddie Mac Primary Mortgage Market Survey®. The line under the title gives the latest rate and the lowest and highest for the months shown.

It opens on the whole history; use the Recording Month range to zoom in on any stretch of months, and the line under the title updates to match.

Rates feed straight into what buyers can afford: on the same budget, a higher rate means a smaller loan. Hover over the line to see the rate for any month.