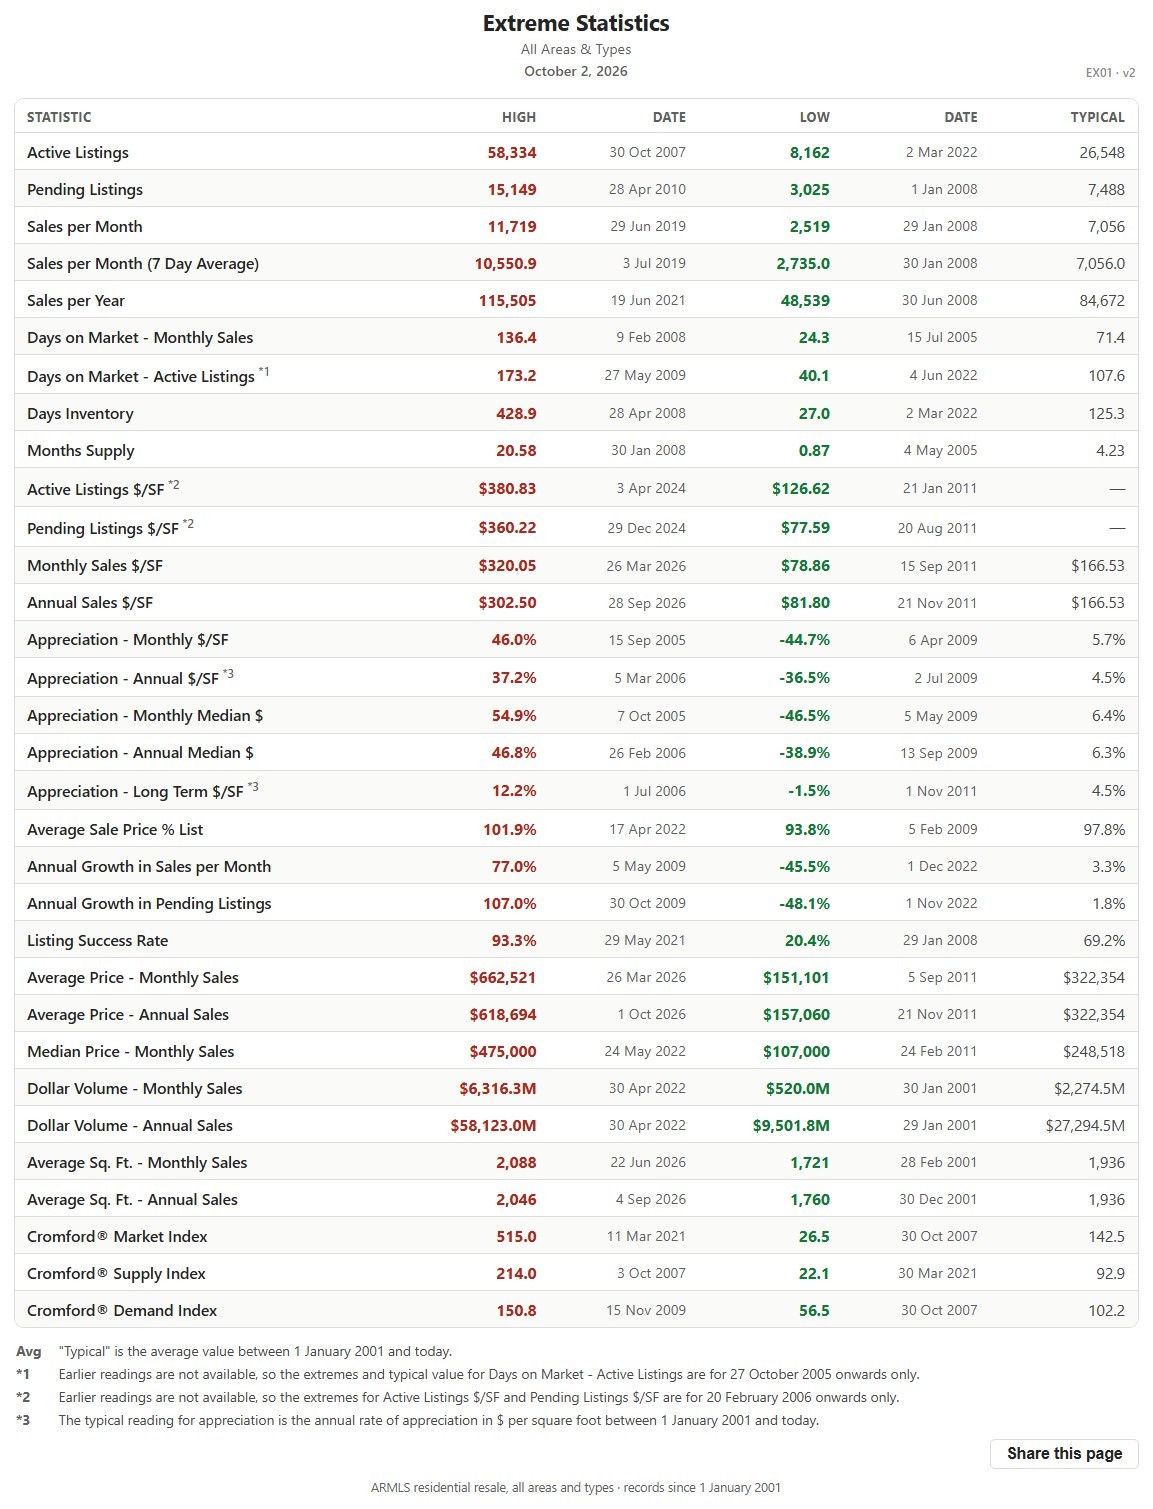
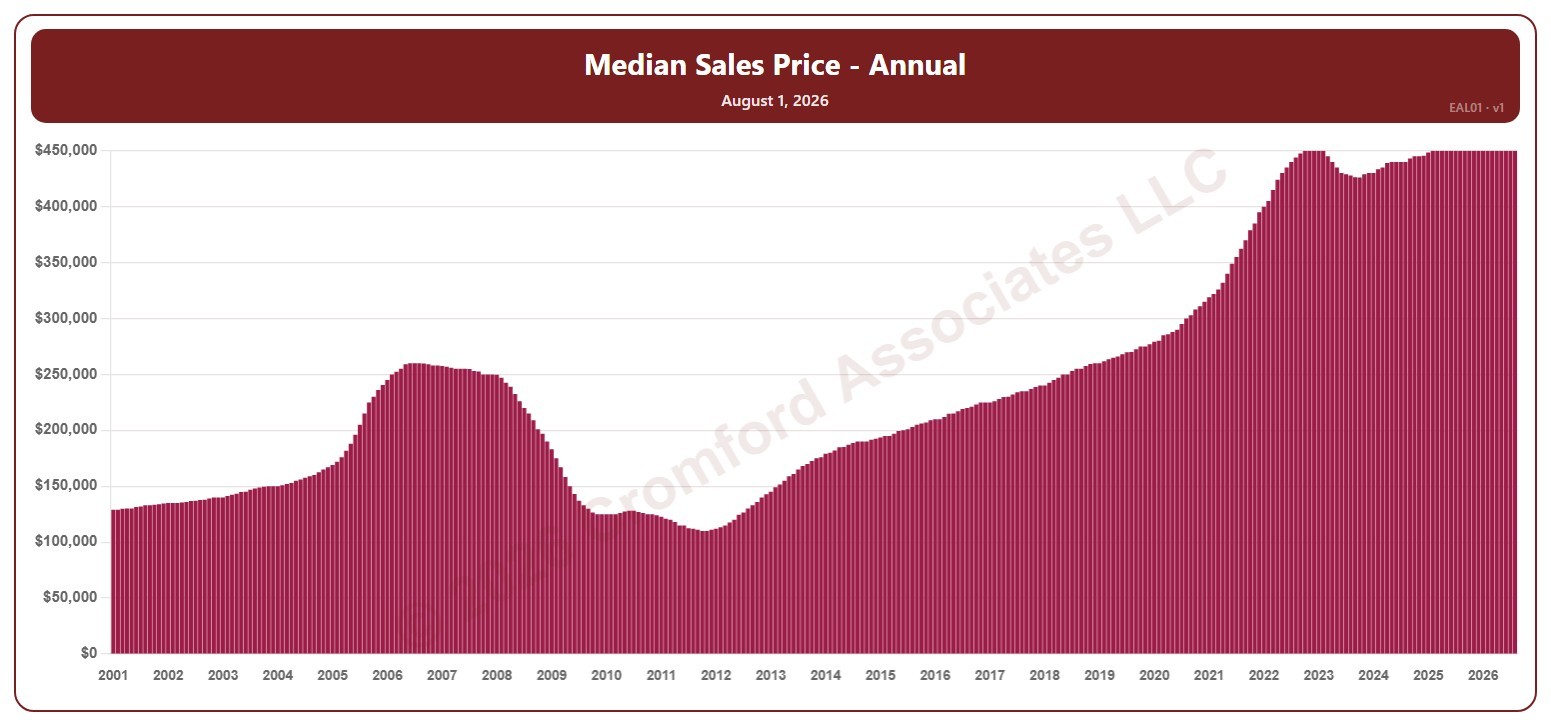
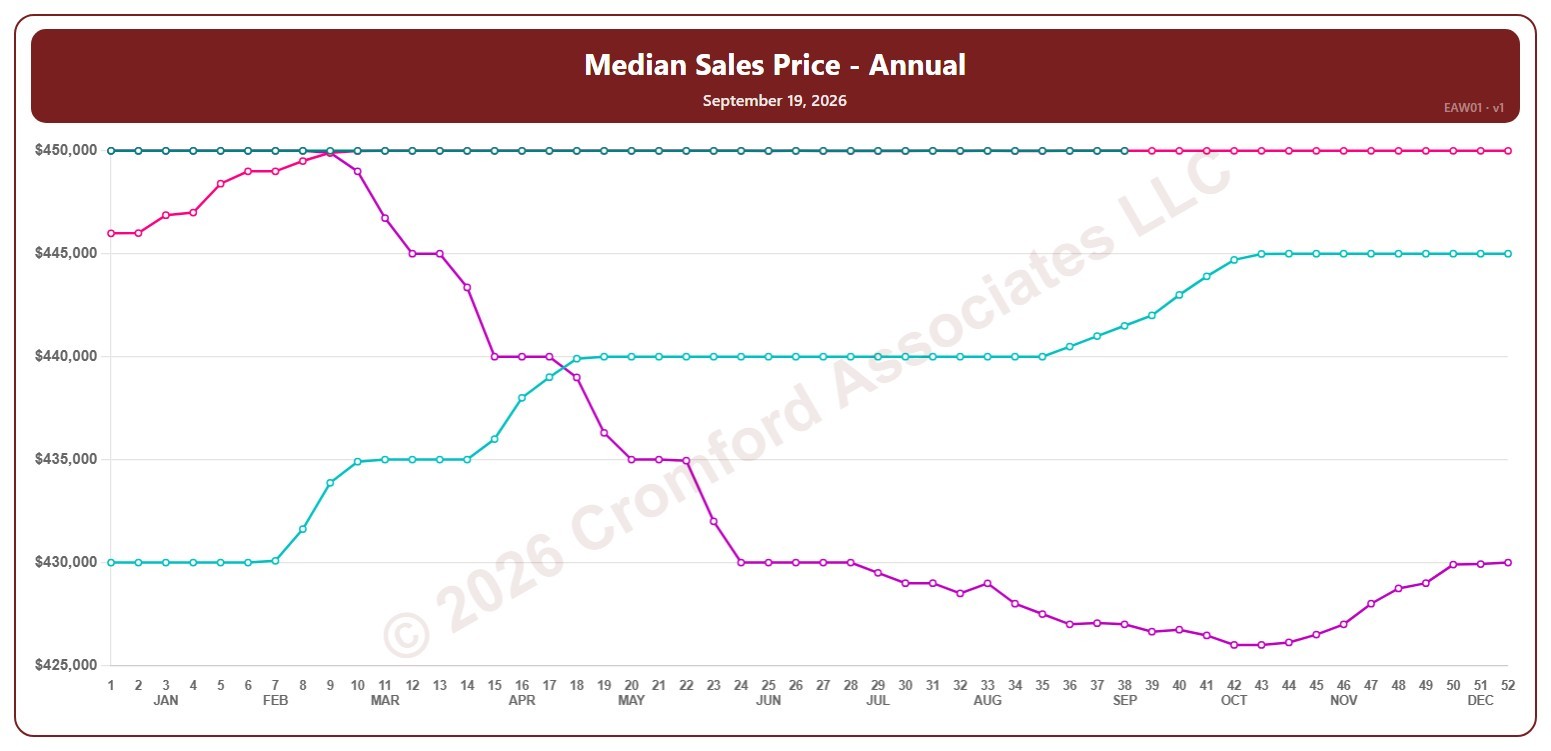
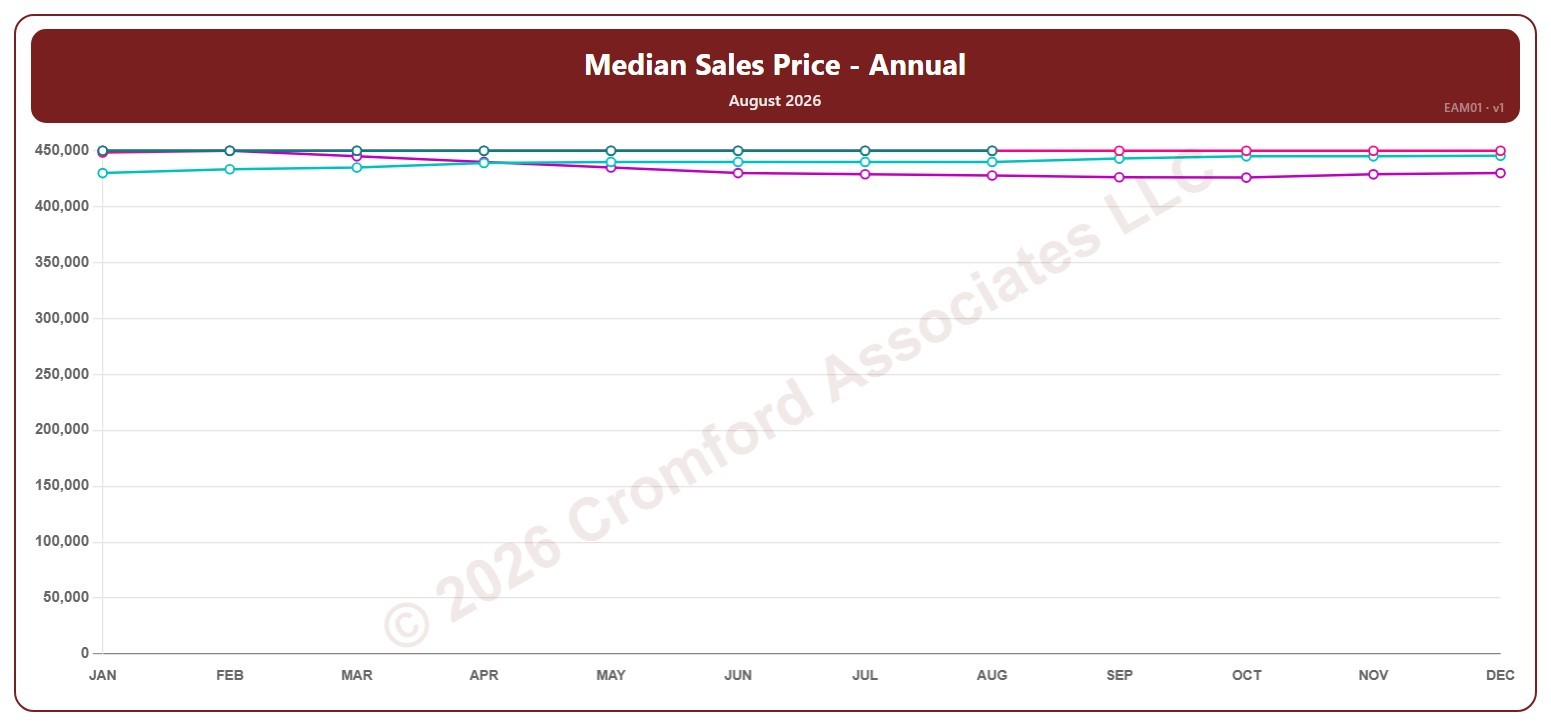
About this chart
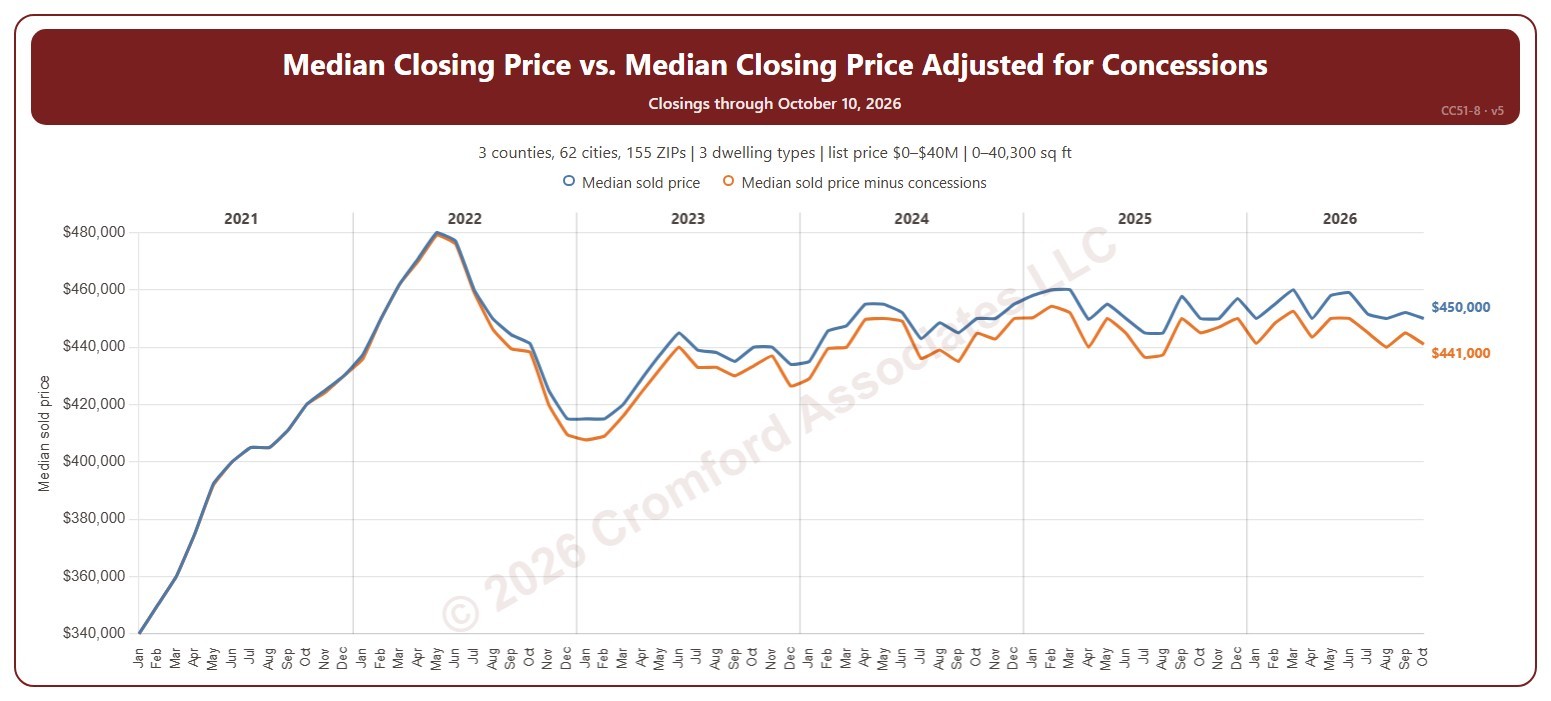
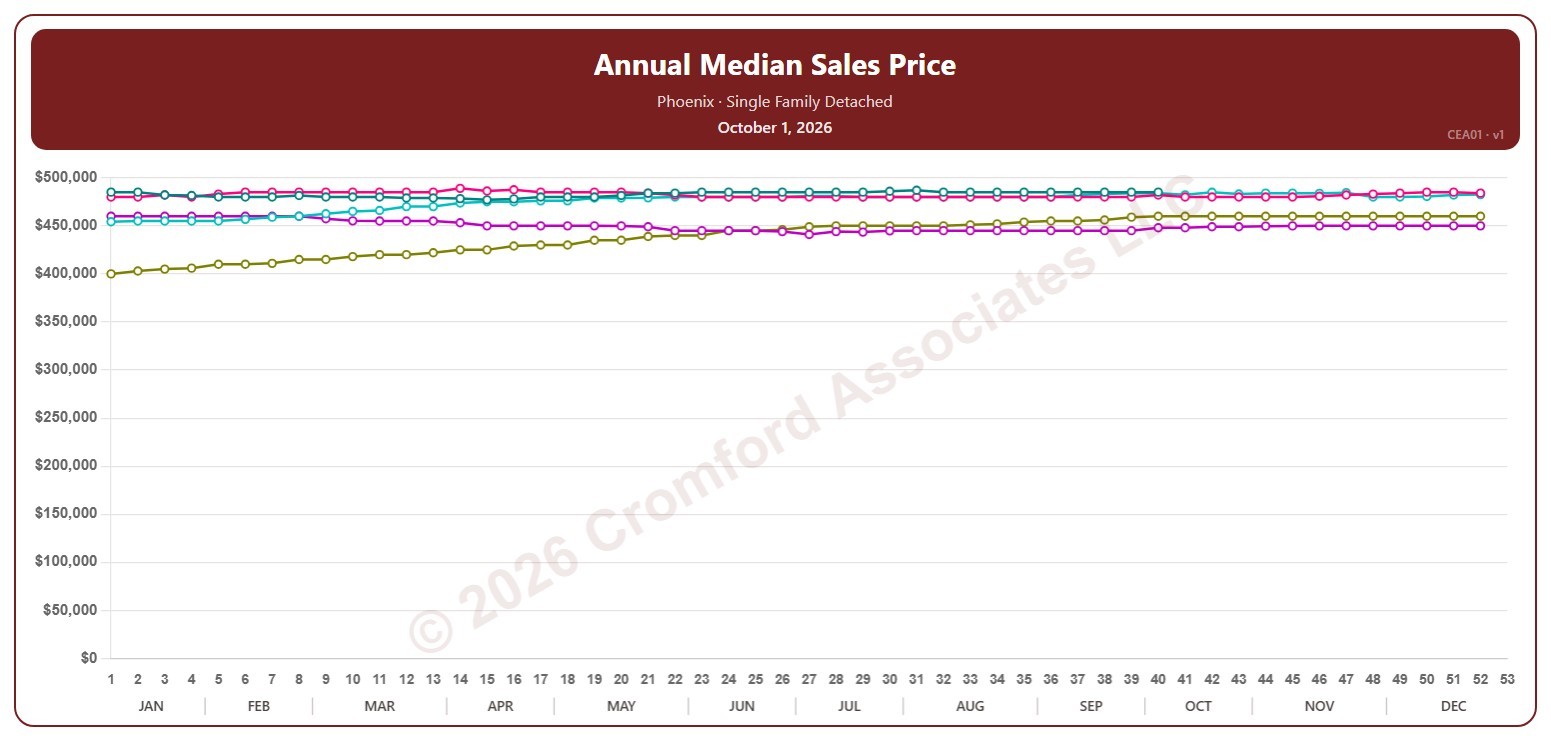
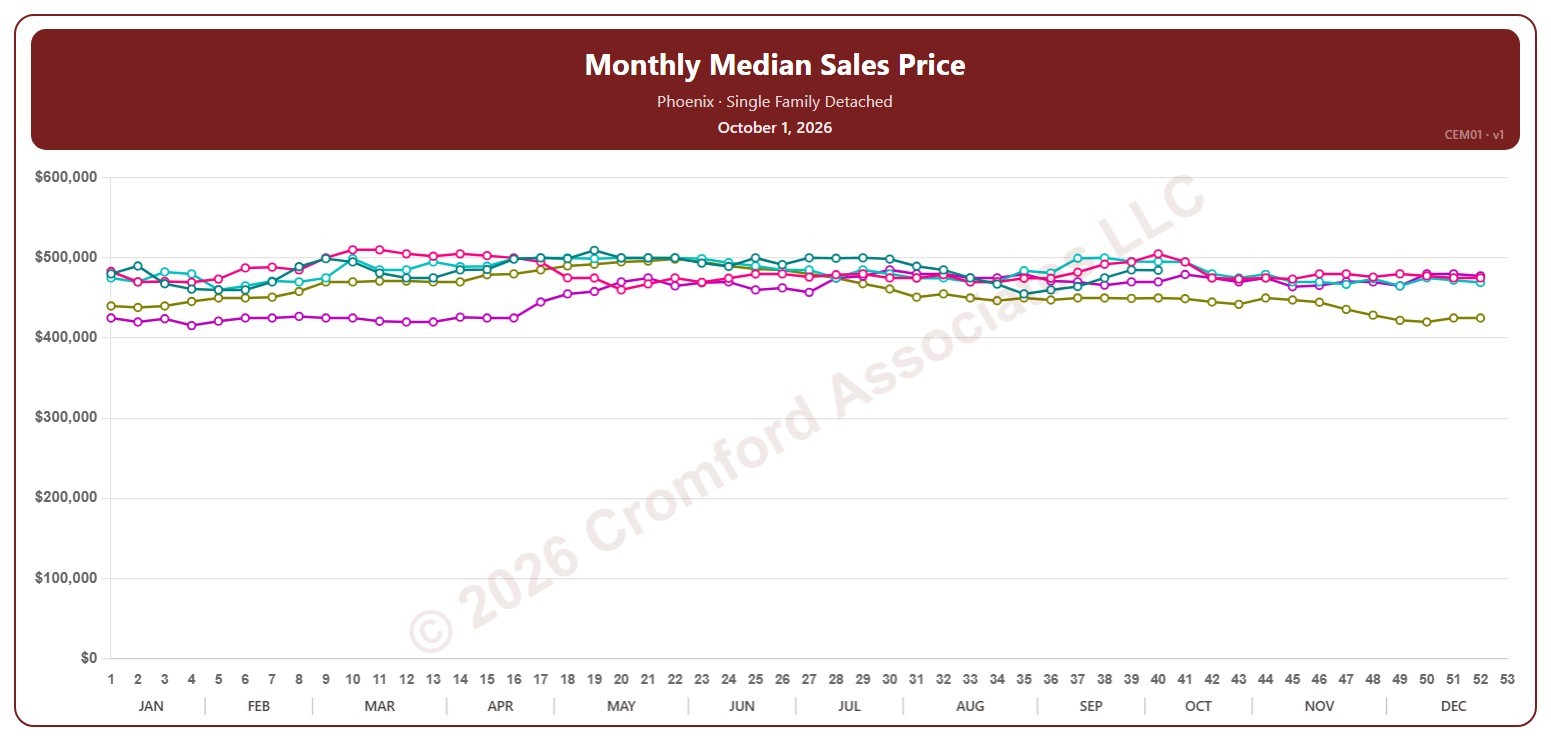
This chart shows the median sales price over six months, month by month: each point is the median of every closing in that month and the five months before it. The median sales price is the middle sale price of the homes that closed on ARMLS in the period: half sold for more and half for less. New homes are included. EM52-1 shows the median for each single month.
It opens on January 2021 to date; drag the handles of the date slider under the chart to choose the months shown, as far back as June 2000. The newest month counts its closings so far. The chart is updated every day.
It opens on the Greater Phoenix area: the counties, cities, and ZIP codes that make it up are ticked to start with. Tick or untick any of them to change the area, including counties beyond Greater Phoenix. Narrow it further with the Dwelling Type, Transaction Type, and New / Resale boxes and the list price, home size, and year built sliders.
Hover over the line to see the six months counted, the median, the lowest and highest sale, and the number of closings. Press Ctrl and point at the line to mark the same month in every year; press Ctrl again to clear.