About this chart
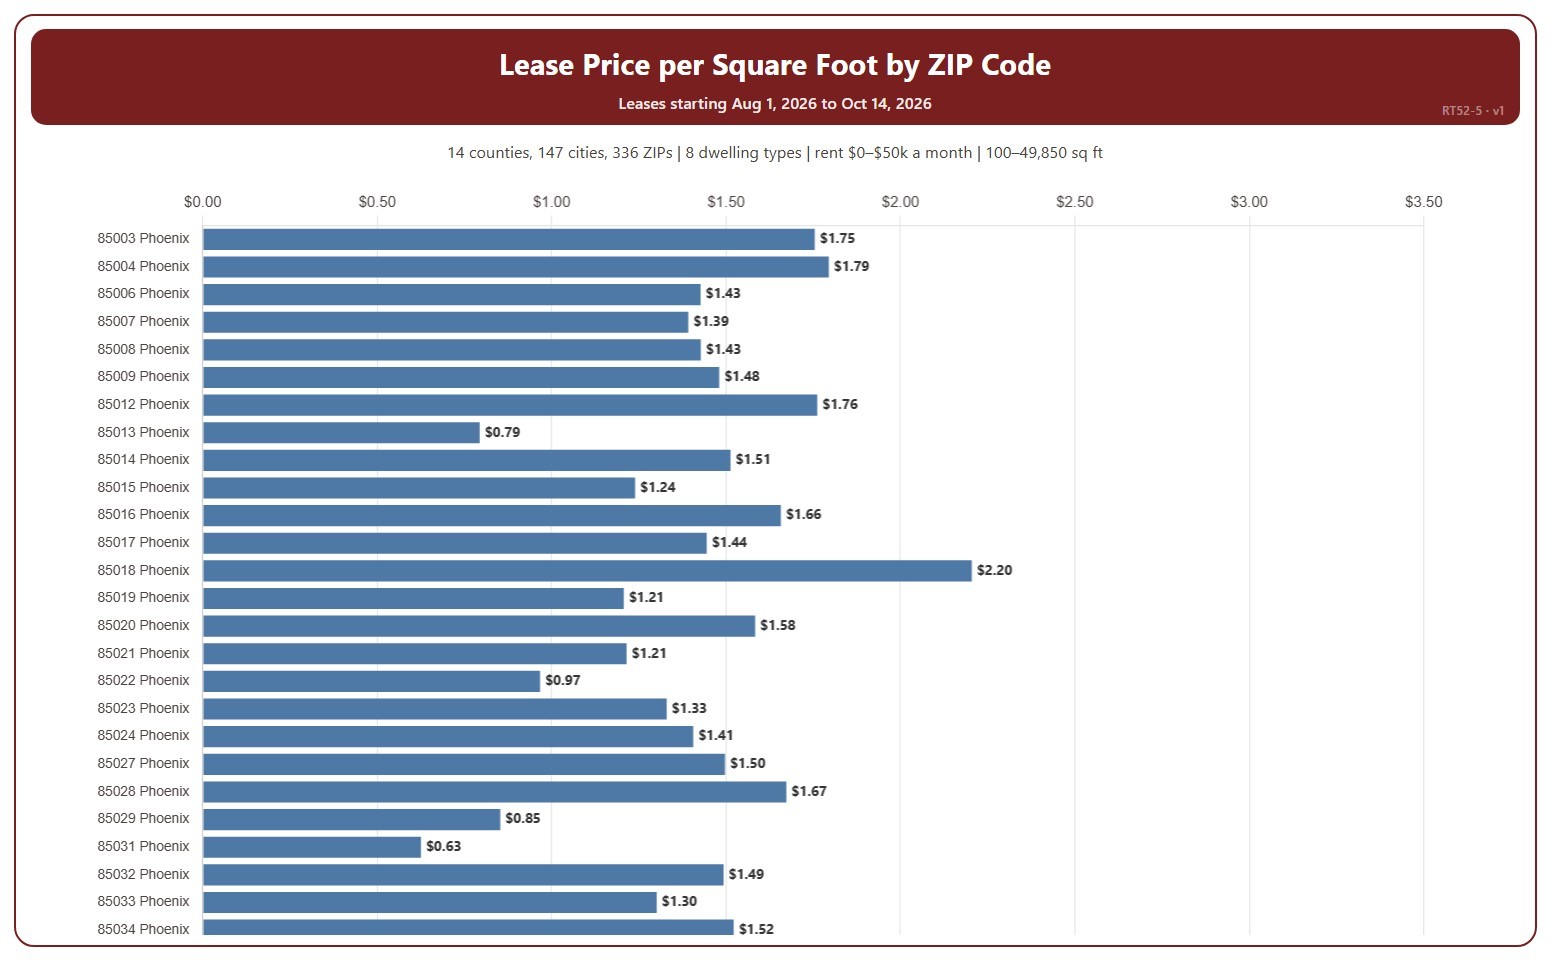
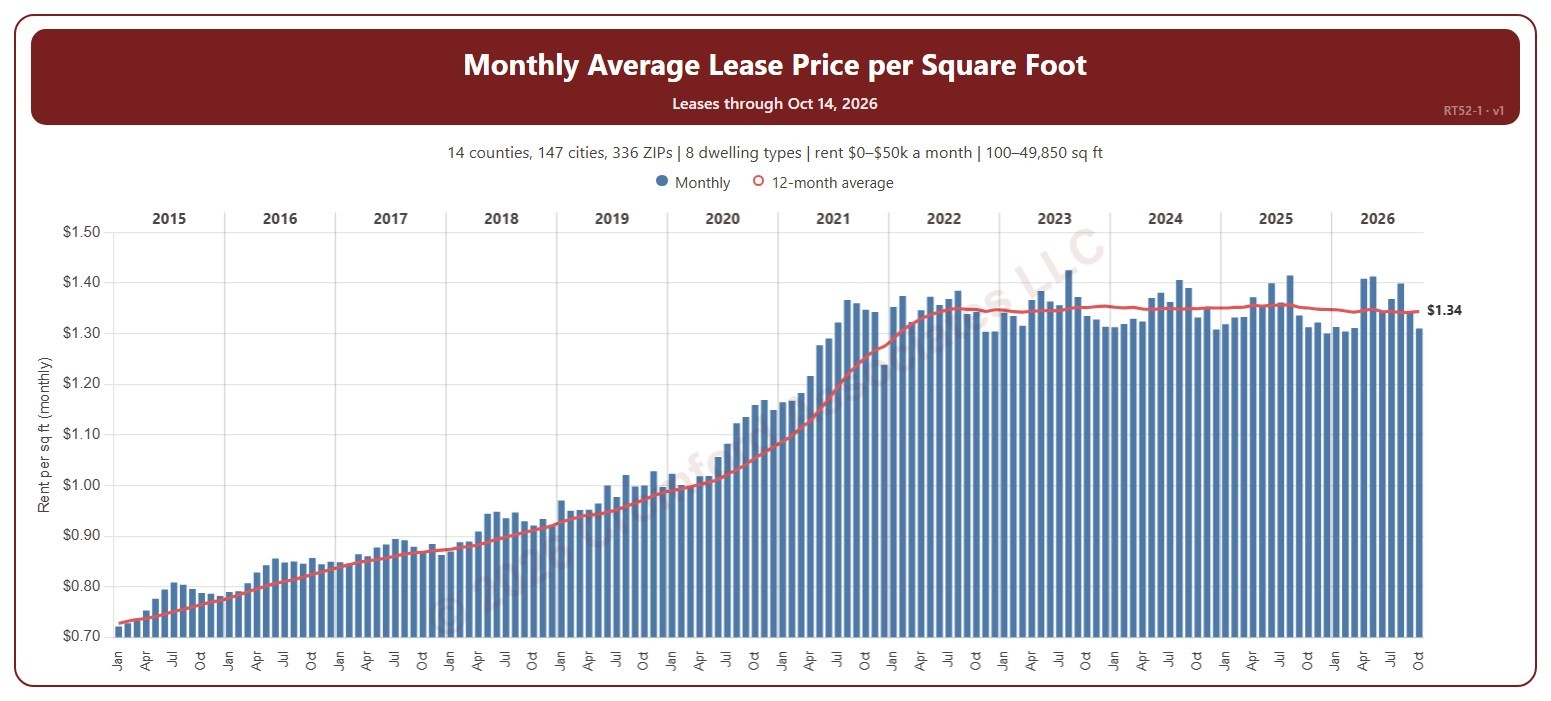
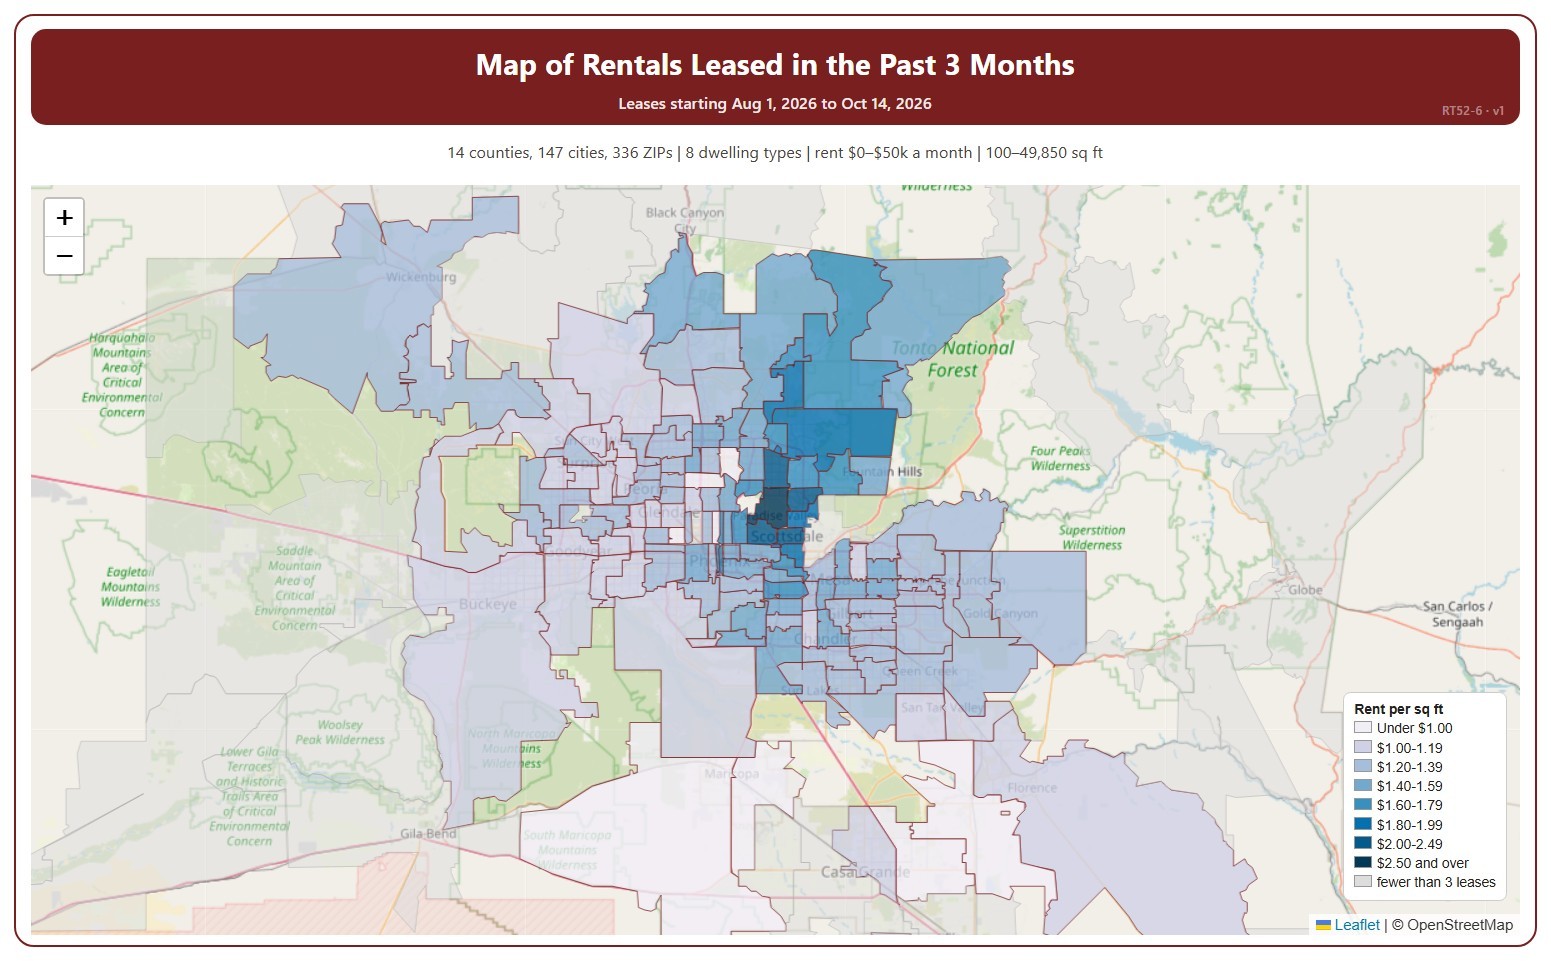
This map shades each ZIP code by the average monthly rent per square foot of recent leases, darker for a higher rent. It covers residential rentals leased through ARMLS, using the monthly rent each lease closed at, and places each lease in the month its tenancy starts.
It covers the last three calendar months up to the latest data; the heading shows the exact dates. The chart is updated every day. ZIP codes with fewer than 3 leases in the period are shown in grey.
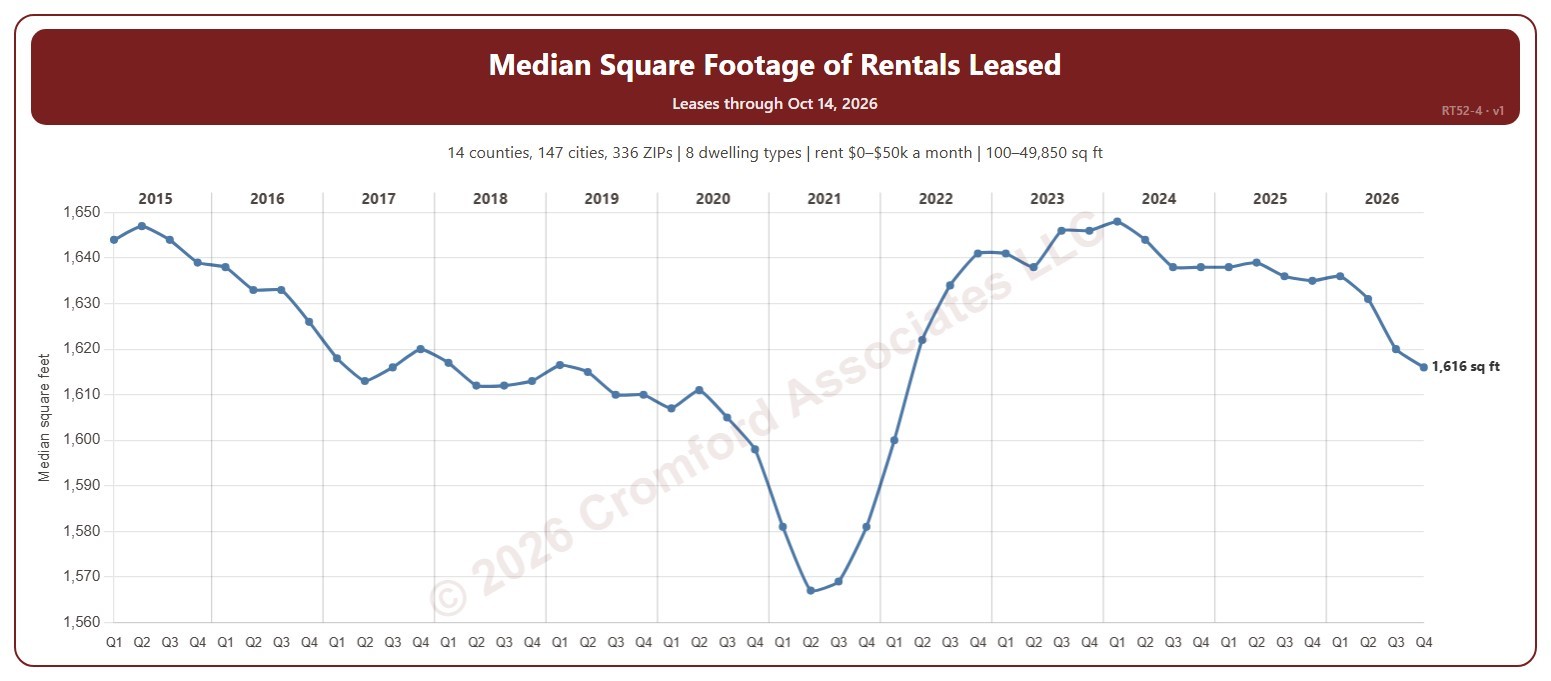
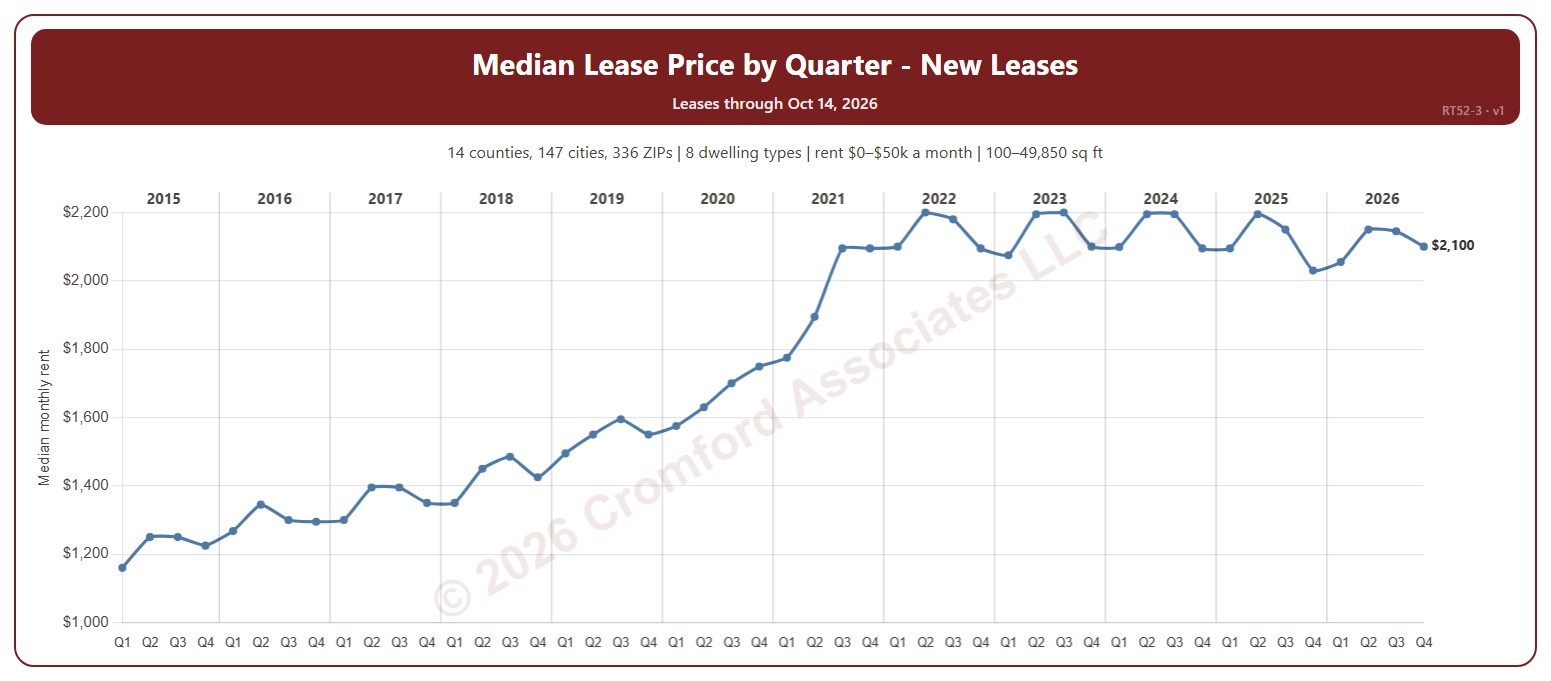
It opens on every area in ARMLS; tick or untick counties, cities, and ZIP codes to narrow it. Narrow it further with the Dwelling Type and Furnished boxes and the monthly rent, home size, and year built sliders.
Hover over a ZIP code to see its rent per square foot, average rent, and number of leases.