
About this chart
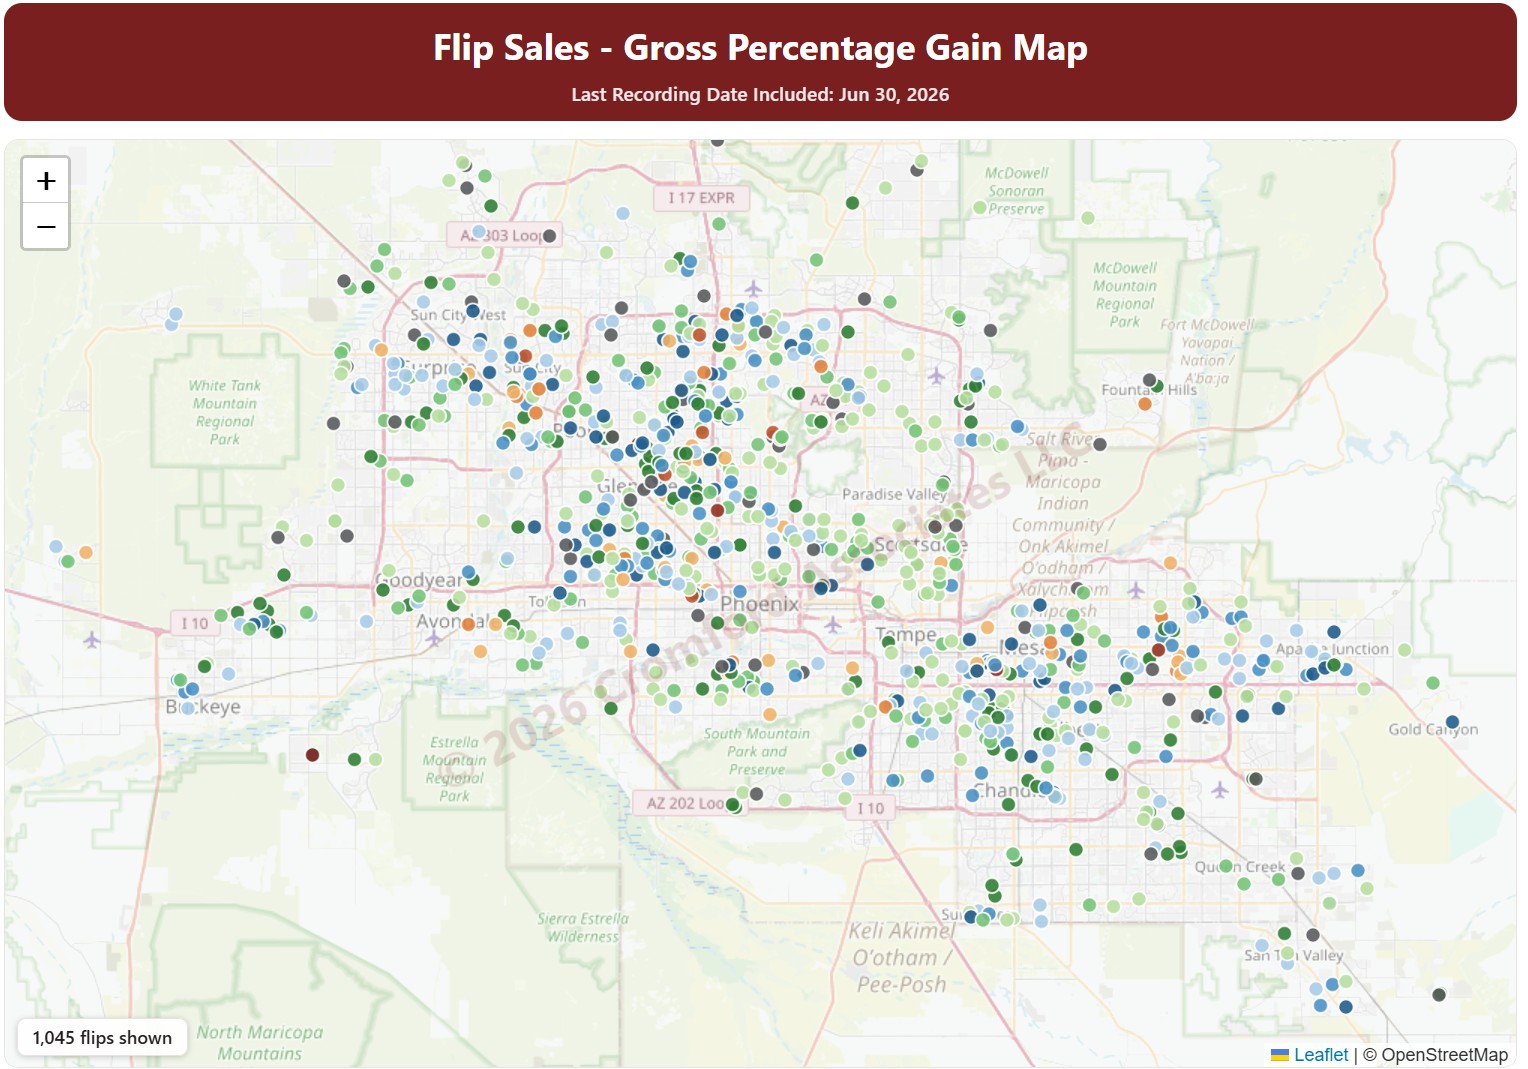
This map shows fix-and-flip resales in Maricopa and Pinal Counties: homes bought, usually renovated, and resold by an investor. Each dot is one flip, colored by the gross percentage gain between the purchase price and the resale price.
Purchases by Opendoor and OfferPad are left out by default; tick them under Buyers to include them. Use the County, City, and ZIP Code panels and the Property Type, hold days, profit, and sales price filters to narrow the flips shown.
The Last Month, Last 3 Months, Last 6 Months, and Full range buttons, and the arrows, set the dates covered.