The Cromford® Market Index as a Predictor of Future Annual Price Appreciation – Based on Annual Median $/SF

About this chart

This chart sets the Cromford® Market Index beside annual appreciation for the whole ARMLS market, all areas and all dwelling types, one reading on the 1st of each month since January 2002, with the rate of inflation (Consumer Price Index) alongside. It shows how a shift in the balance between buyers and sellers has been followed by a change in prices.

A reading below 90 indicates a buyer’s market, above 110 a seller’s market, and between 90 and 110 a balanced market. Appreciation is the change in the median sales price per square foot over the last 12 months compared with a year earlier. CMAP01 shows the same comparison using the average sales price per square foot.

The options label the minimum, maximum, and latest values and switch the Market Index to a logarithmic axis. Use the date slider, or Full range, to choose the stretch of history shown. Hover over the chart to see the figures for that month.

Seller Gains and Losses at Resale

About this chart

This chart splits the Maricopa and Pinal County home resales of each quarter since 2015 by the sale price against what the seller paid: sold at a loss, up 0% to 24.9%, up 25% to 49.9%, up 50% to 99.9%, and up 100% or more.

This compares two recorded prices and is not profit. It takes no account of improvements, selling costs, or inflation, so more sellers lose money after costs than the loss band shows, and a gain on a remodeled home is overstated.

What the seller paid is the last earlier recorded sale of the same parcel. New homes are not included. Neither are resales with no earlier recorded sale, deeds that cover several parcels, or prices under $10,000.

Use the Time Owned boxes to compare recent buyers with long-term owners. Narrow it with the County, City, and ZIP panels, Intended Use, the Transaction Type, Property Type, and 55+ Communities boxes, and the sale price and home size sliders.

The records run to the end of last month and are updated monthly. Hover over a bar to see each band’s share and number of sales, the median gain in percent and dollars, and the median time owned.

Title Company Market Share

About this chart

This chart ranks title companies by their share of the home closings recorded in Maricopa and Pinal Counties. Period chooses the last 12 complete months or any calendar year since 2011.

Type a ZIP code or city to see who leads there. All, Resales, and New homes choose the closings counted; several builders close most of their new homes through their own title companies, so Resales gives the clearer view of the open market. All, Homes, and Condos choose the property type.

The title company is the one named in the county deed records. Different spellings of one name are combined, but separately branded companies are shown separately even when they share a parent. Deeds with no title company recorded are counted on the page and left out of the shares.

Show switches between the top 25, the top 50, and all companies. Chart and Table switch between the ranked bars and the same figures as a table. The records run to the end of last month and are updated monthly.

New Home Share of Closings by ZIP Code

About this chart

This chart ranks the ZIP codes of Maricopa and Pinal Counties by the share of their recorded home closings that were new homes. Period chooses the last 12 complete months or any calendar year since 2011. It shows where builders make up most of the market, and where they are absent.

A new home is one the county recorder codes as a new home sale, the same count as NS11, NS12, and NS13. The share can also rise when resales fall, as they did after 2022, even if new home closings hold steady.

It opens on the top 25 ZIP codes. Show switches to the top 50 or all ZIP codes, Sort ranks them by share, new home closings, all closings, or ZIP code, and All, Homes, and Condos choose the property type. ZIP codes with fewer than 50 closings in the chosen slice are in the table and the totals but not the bars.

Chart and Table switch between the ranked bars and the same figures as a table. The records run to the end of last month and are updated monthly.

How Long Sellers Owned Their Homes

About this chart

This chart splits the Maricopa and Pinal County home resales of each quarter since 2015 by how long the seller had owned the home: under 1 year, 1 to 4.9 years, 5 to 9.9 years, 10 to 19.9 years, and 20 years or more. New homes are not included.

Time owned is measured from the last earlier sale recorded for the same parcel. Resales with no earlier recorded sale (about 4.5%) are left out. A purchase with no recorded price, such as a gift or a transfer between companies, does not restart the clock.

Pinal County’s records start in 2000, so its share owned 20 years or more is understated, and it cannot show any until about 2020. The records for Maricopa County thin out before the mid-1980s, which may understate that band in the earliest years.

Flips make up most of the under 1 year band. Untick Investor Flip in the Transaction Type panel to see other sales. Narrow it with the County, City, and ZIP panels, Intended Use, the Property Type and 55+ Communities boxes, and the sale price and home size sliders.

The records run to the end of last month and are updated monthly. Hover over a bar to see each band’s share and number of sales, and the median time owned.

Down Payments on Financed Home Purchases

About this chart

This chart splits the Maricopa and Pinal County homes bought with a loan each quarter since 2014 by the size of the down payment as a share of the sale price: under 5%, 5% to 9.9%, 10% to 19.9%, 20% to 29.9%, and 30% or more. Cash purchases are not included. FT21 and FT23 show how many buyers pay cash.

The figure is the sale price less the loan as recorded, which is not always the cash the buyer brought. An FHA buyer putting 3.5% down usually shows about 1.8%, because the upfront insurance premium is added to the loan. That is why the lowest band runs up to 5%. A VA loan with no down payment recorded counts as zero down.

Use the Loan Type boxes to see Fannie Mae/Freddie Mac, FHA, VA, or other loans on their own. Narrow it with the County, City, and ZIP panels, Intended Use, the Transaction Type, Property Type, and 55+ Communities boxes, and the sale price and home size sliders.

The records run to the end of last month and are updated monthly. Hover over a bar to see each band’s share and number of sales, and the median down payment in percent and dollars.

Institutional Landlord Purchases and Sales

About this chart

This chart counts the Maricopa and Pinal County homes bought and sold each quarter since 2012 by the large single-family rental companies: Invitation Homes, Progress Residential, FirstKey Homes, American Homes 4 Rent, Amherst, STAR, Home Partners of America, Tricon, and a group of smaller operators. Purchases stack above the line and sales below it, in the same colors as the investor homes maps. The black line is purchases minus sales.

A company is identified from the buyer or seller name on the deed and the address on the Affidavit of Property Value. These companies hold homes through many separately named entities, and a few sales by entities we cannot tie to a company may be missing.

It counts sales on the open market only. Homes that change hands between companies in a portfolio deal are mostly not recorded as sales, so purchases minus sales is not the change in how many homes a company owns. Narrow it with the County, City, and ZIP panels, the Transaction Type, Property Type, and 55+ Communities boxes, and the sale price and home size sliders. Click a company in the legend to hide it.

The records run to the end of last month and are updated monthly. Hover over a bar to see each company’s purchases and sales and the share of all home sales they made up.

Monthly Home Sales to Out-of-State Buyers

About this chart

This chart counts the Maricopa and Pinal County home sales bought each month by someone whose address was outside Arizona, since January 2015. The address is the one the buyer gave on the Affidavit of Property Value filed with the deed. Each bar is split by where that address is: California, Washington, Colorado, Illinois, Minnesota, Texas, Canada, other US states, and other countries. OS11 shows the same buyers as a share of all sales, by quarter.

Tick only Owner Occupier in the Intended Use panel to see buyers who said they would live in the home, a good guide to people moving to the area. Narrow it with the County, City, and ZIP panels, the Transaction Type, Property Type, and 55+ Communities boxes, and the sale price and home size sliders.

Sales with no matching affidavit (about 2% since 2015) are left out. The records run to the end of last month and are updated monthly. Hover over a bar to see each band’s count, the month’s total sales, and the out-of-state share.

Percentage of Home Sales to Out-of-State Buyers

About this chart

This chart shows the share of Maricopa and Pinal County home sales bought by someone whose address was outside Arizona, one bar per calendar quarter since 2015. The address is the one the buyer gave on the Affidavit of Property Value filed with the deed. Each bar is split by where that address is: California, Washington, Colorado, Illinois, Minnesota, Texas, Canada, other US states, and other countries. The height of the bar is the total out-of-state share.

Tick only Owner Occupier in the Intended Use panel to see buyers who said they would live in the home, a good guide to people moving to the area. Narrow it with the County, City, and ZIP panels, the Transaction Type, Property Type, and 55+ Communities boxes, and the sale price and home size sliders.

Sales with no matching affidavit (about 2% since 2015) are left out. The records run to the end of last month and are updated monthly. Hover over a bar to see each state’s share and the number of sales.

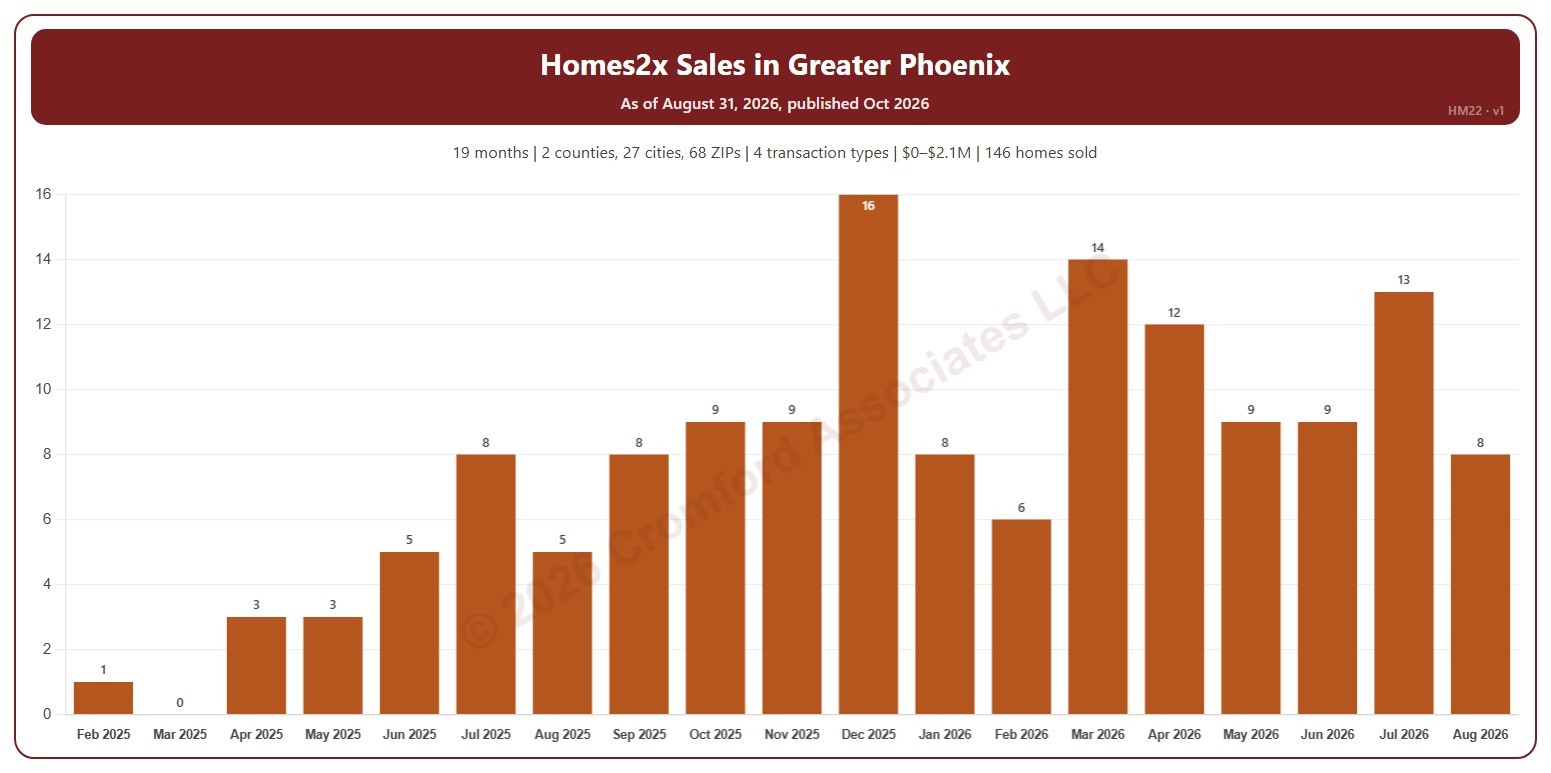
Homes2x Sales in Greater Phoenix

About this chart

This chart counts the homes Homes2x sold each calendar month since February 2025, from residential deeds recorded by Maricopa and Pinal Counties. Homes2x is an iBuyer: it buys homes directly from owners and resells them. HM21 shows the homes it bought, so the two together show whether it is building up or running down its inventory.

It opens on Maricopa and Pinal Counties with everything included. Narrow it with the County, City, and ZIP panels, the Transaction Type, Property Type, and 55+ Communities boxes, and the sale price slider. Untick years in the Year panel to drop them from the chart.

The records run to the end of last month and are updated monthly. Hover over a bar to see the exact figure for that month.