Listings Under Contract by Price Range

About this chart

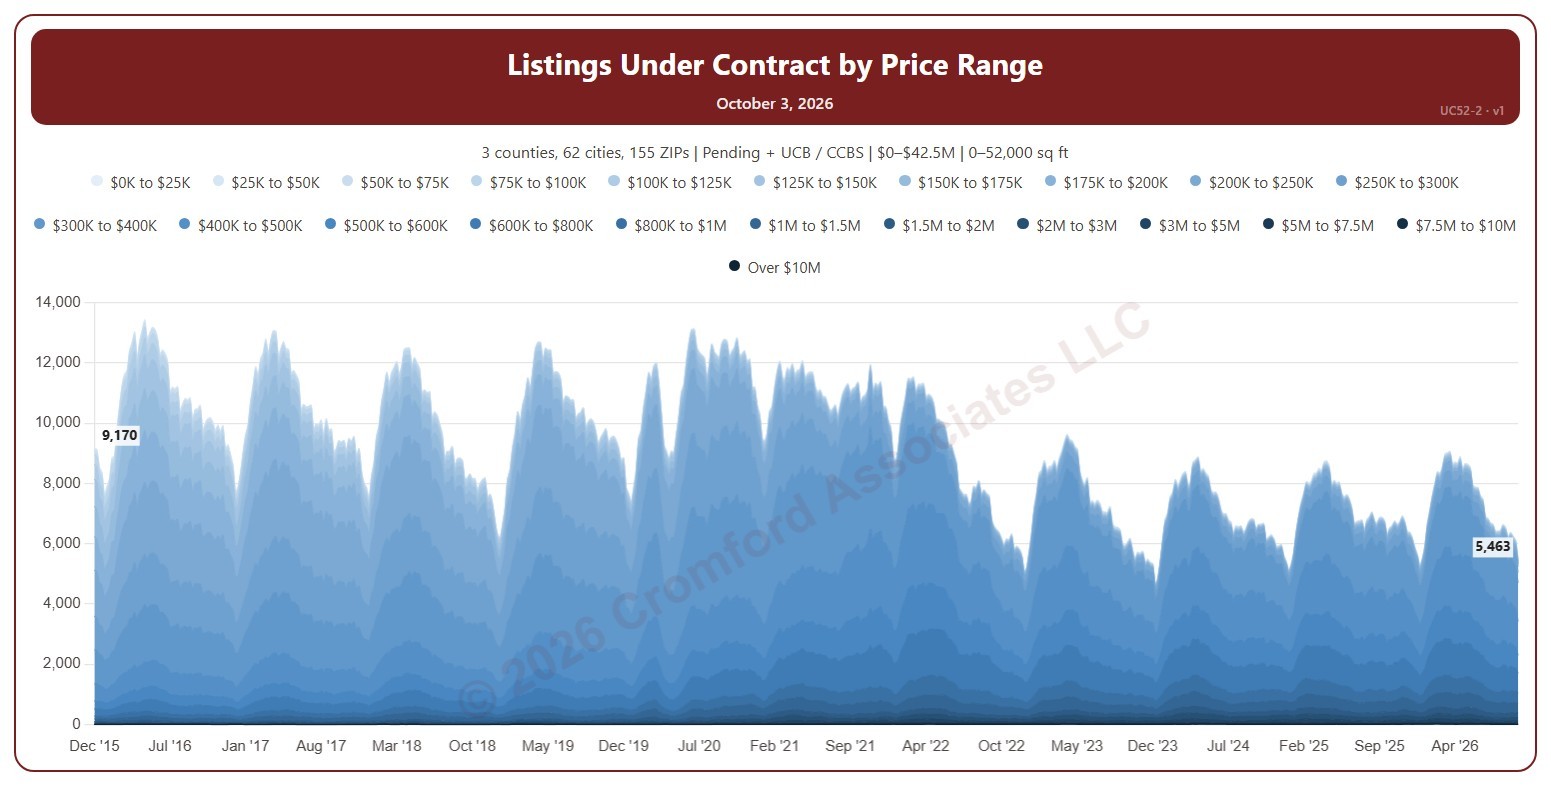
This chart counts the listings under contract on ARMLS each week (on Saturdays), stacked by list price in 22 bands up to over $10M. It shows which price ranges buyers are committing to and how that is changing.

Both Pending and UCB / CCBS listings are counted to start with; untick either under Listing Status to leave it out. It opens on the weeks since December 2015; use the Period panel to choose a different span or particular years.

It opens on the Greater Phoenix area: the counties, cities, and ZIP codes that make it up are ticked to start with. Tick or untick any of them to change the area, including counties beyond Greater Phoenix. Narrow it further with the Dwelling Type, Transaction Type, and New / Resale boxes and the list price, home size, and year built sliders.

Hover over the chart to see the figures for that week.
Listings Under Contract

About this chart

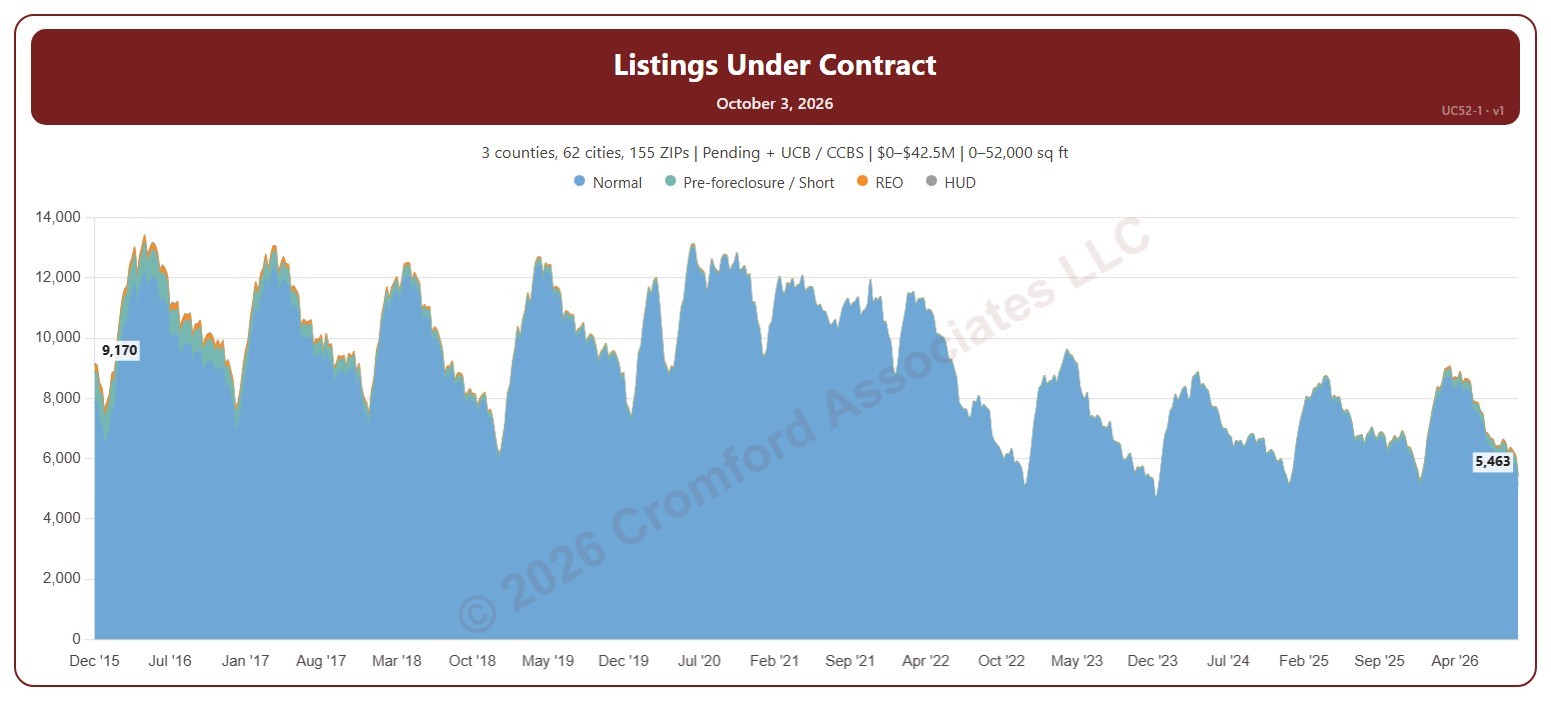
This chart counts the listings under contract on ARMLS each week (on Saturdays), stacked by transaction type: normal sales, pre-foreclosure / short sales, REOs, and HUD homes. Listings under contract are Pending listings plus UCB / CCBS listings, and show how much buying activity is under way.

Both Pending and UCB / CCBS listings are counted to start with; untick either under Listing Status to leave it out. It opens on the weeks since December 2015; use the Period panel to choose a different span or particular years.

It opens on the Greater Phoenix area: the counties, cities, and ZIP codes that make it up are ticked to start with. Tick or untick any of them to change the area, including counties beyond Greater Phoenix. Narrow it further with the Dwelling Type, Transaction Type, and New / Resale boxes and the list price, home size, and year built sliders.

Hover over the chart to see the figures for that week.