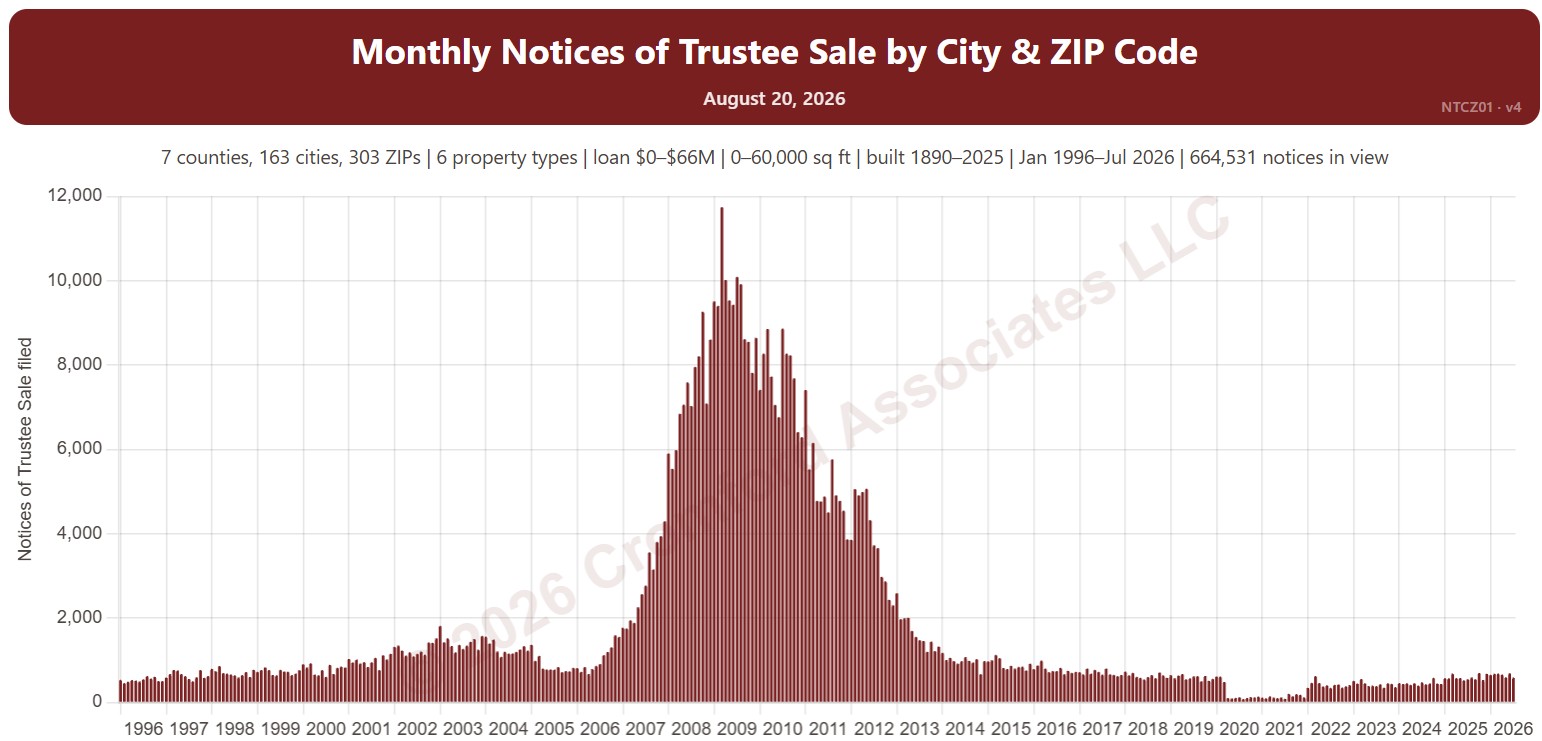
Monthly Notices of Trustee Sale – City Comparison

About this chart

This chart compares Notices of Trustee Sale between cities, one line per city, recorded each month. A notice is the document a lender records when it starts to foreclose on a home; many are later canceled, so it is an early sign of distress rather than a count of foreclosures. The lines show a 12-month average to smooth out month-to-month swings.

It opens on Phoenix, Mesa, Glendale, Scottsdale, Chandler, and Gilbert in Maricopa and Pinal Counties. Tick other cities under Cities to Compare, or add Cochise, Coconino, Mohave, Santa Cruz, or Yavapai Counties. Vacant land and commercial property are left out by default.

Narrow it with the Property Type box and the loan amount, home size, and year built sliders. Use the date slider, or Full range, to choose the stretch of history shown.

Hover over a line to see the figure for that month.
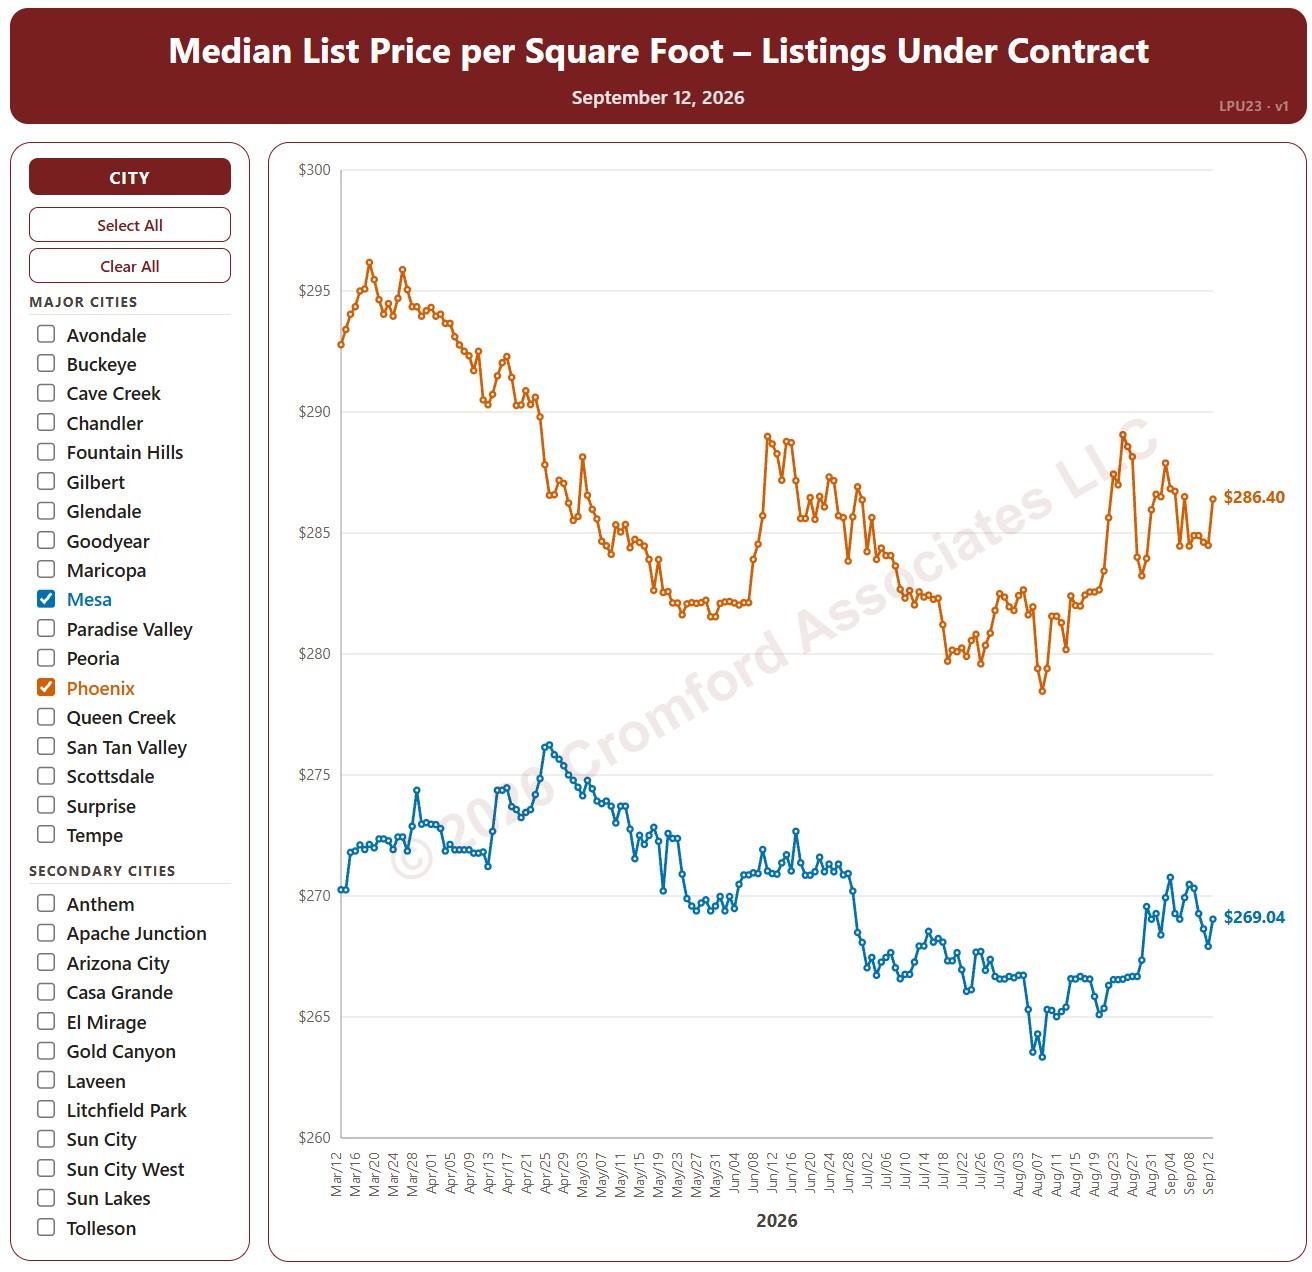
Median List Price per Square Foot by City – Listings Under Contract

About this chart

This chart compares the median list price per square foot of listings under contract (Pending plus UCB / CCBS) across 34 cities in and around Greater Phoenix, every day over the last six months, for single-family detached homes on ARMLS. It shows the asking prices of the homes buyers have agreed to buy.

The 18 major cities are drawn as solid lines and the 16 secondary cities as dashed lines. It opens on Mesa and Phoenix; use the city check boxes, or Select All and Clear All, to choose which cities are shown.

Hover over a line to see the exact figure for that day.

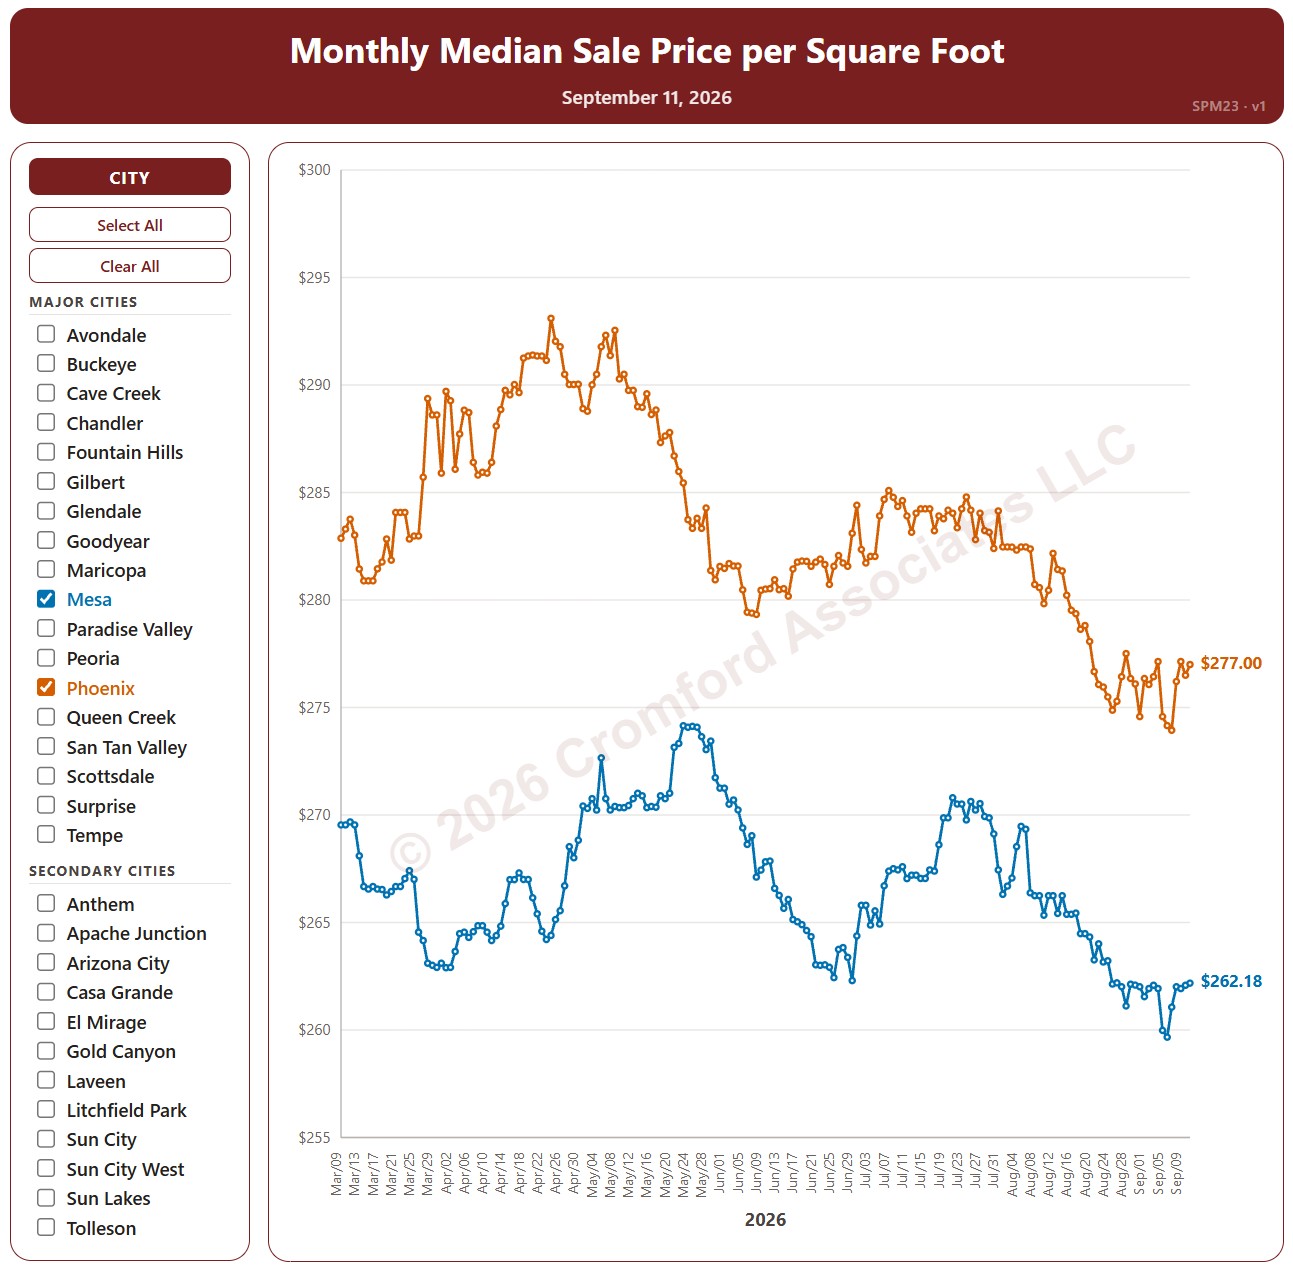
Monthly Median Sale Price per Square Foot by City

About this chart

This chart compares the median sales price per square foot across 34 cities in and around Greater Phoenix, every day over the last six months, for single-family detached homes that closed through ARMLS. Each point covers the closings in the month up to that day.

The 18 major cities are drawn as solid lines and the 16 secondary cities as dashed lines. It opens on Mesa and Phoenix; use the city check boxes, or Select All and Clear All, to choose which cities are shown.

Hover over a line to see the exact figure for that day.

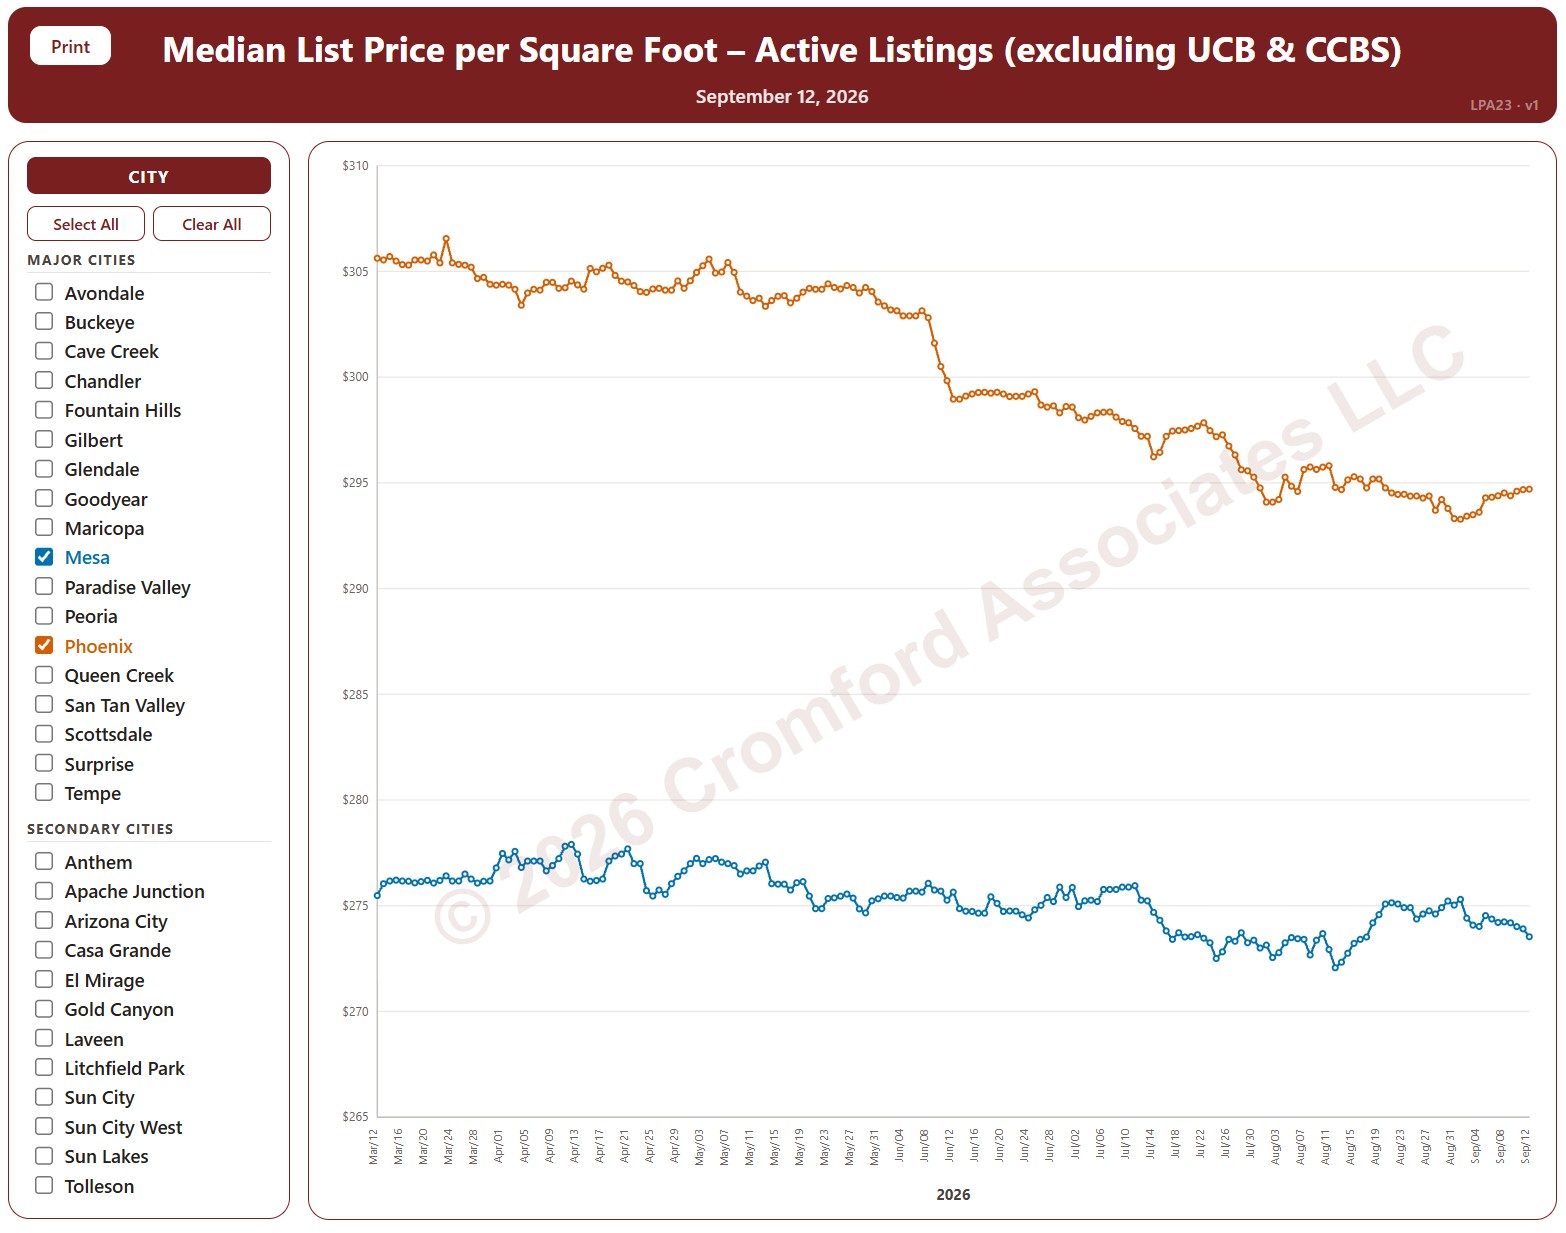
Median List Price per Square Foot by City – Active Listings

About this chart

This chart compares the median list price per square foot of active listings (not counting UCB / CCBS) across 34 cities in and around Greater Phoenix, every day over the last six months, for single-family detached homes on ARMLS. It shows what sellers are asking.

The 18 major cities are drawn as solid lines and the 16 secondary cities as dashed lines. It opens on Mesa and Phoenix; use the city check boxes, or Select All and Clear All, to choose which cities are shown.

Hover over a line to see the exact figure for that day.

Annual Appreciation by City – Based on Annual Median $/SF

About this chart

This chart compares annual appreciation across 34 cities in and around Greater Phoenix over the last 24 months, measured every week, for single-family detached resale homes on ARMLS. Appreciation here is the change in the median sales price per square foot over the last 12 months compared with a year earlier. Above zero, prices are higher than a year ago; below zero, they are lower.

The 18 major cities are drawn as solid lines and the 16 secondary cities as dashed lines. It opens on Mesa and Phoenix; use the city check boxes, or Select All and Clear All, to choose which cities are shown.

Hover over a line to see the exact figure for that week.

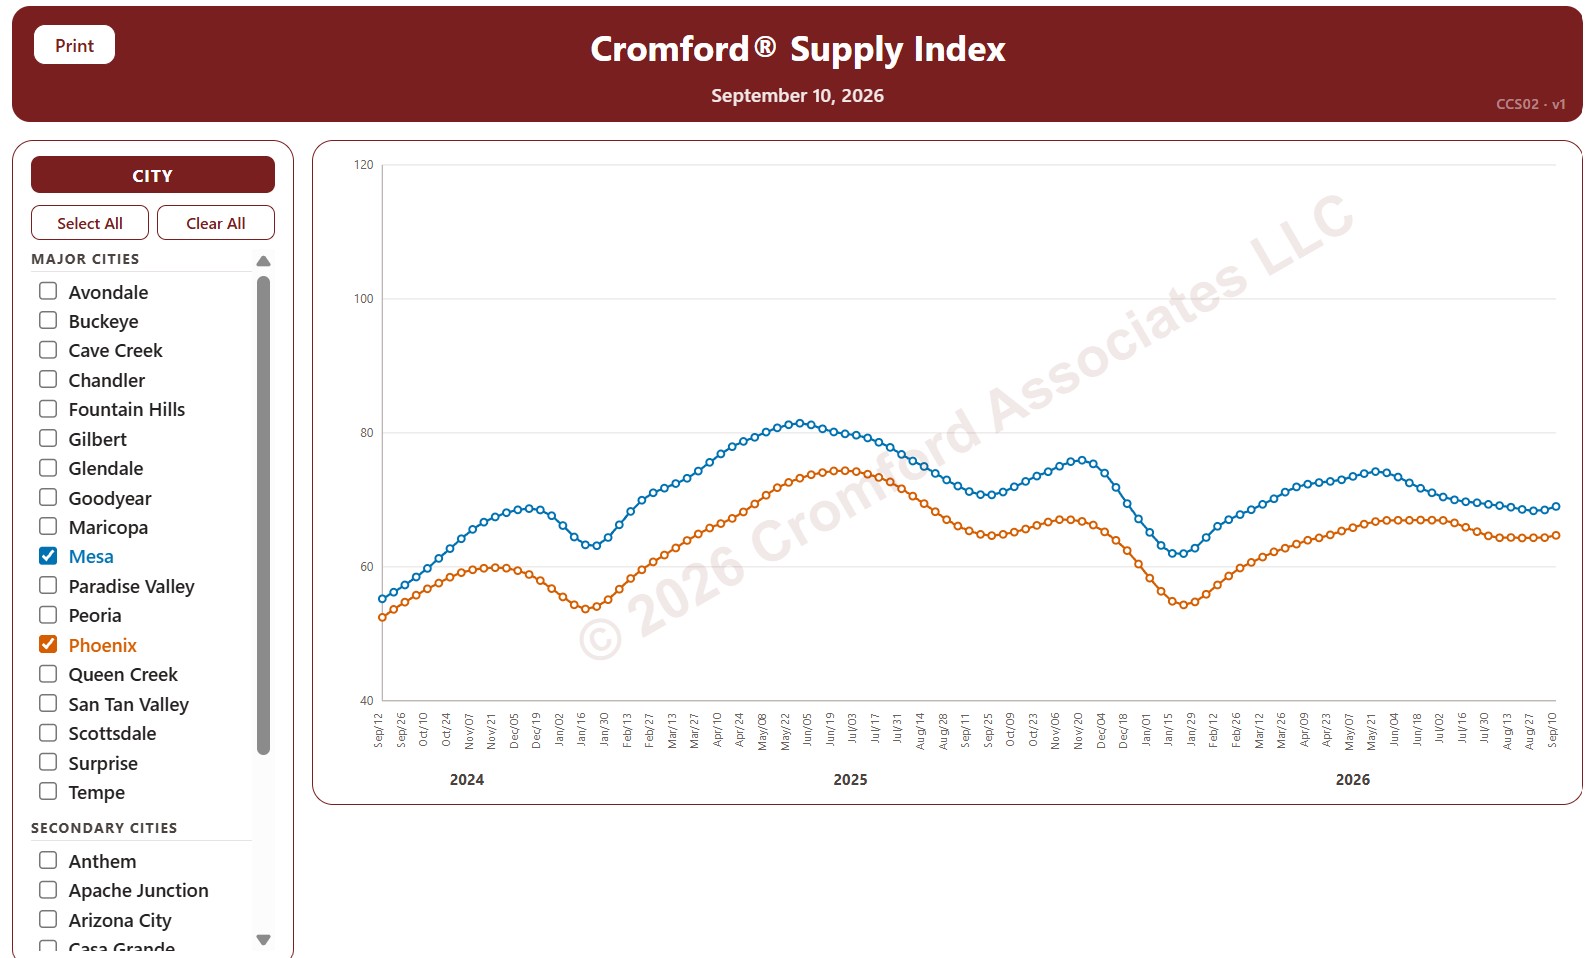
Cromford® Supply Index by City

About this chart

This chart tracks the Cromford® Supply Index for 34 cities in and around Greater Phoenix over the last 24 months, one point per week (each Thursday), for single-family detached resale homes listed on ARMLS. Above 100 means more supply than usual, below 100 less supply than usual, and 100 means supply is close to normal. Low supply favors sellers; high supply favors buyers.

The 18 major cities are drawn as solid lines and the 16 secondary cities as dashed lines. It opens on Mesa and Phoenix; use the city check boxes, or Select All and Clear All, to choose which cities are shown.

Hover over a line to see the exact figure for that week.

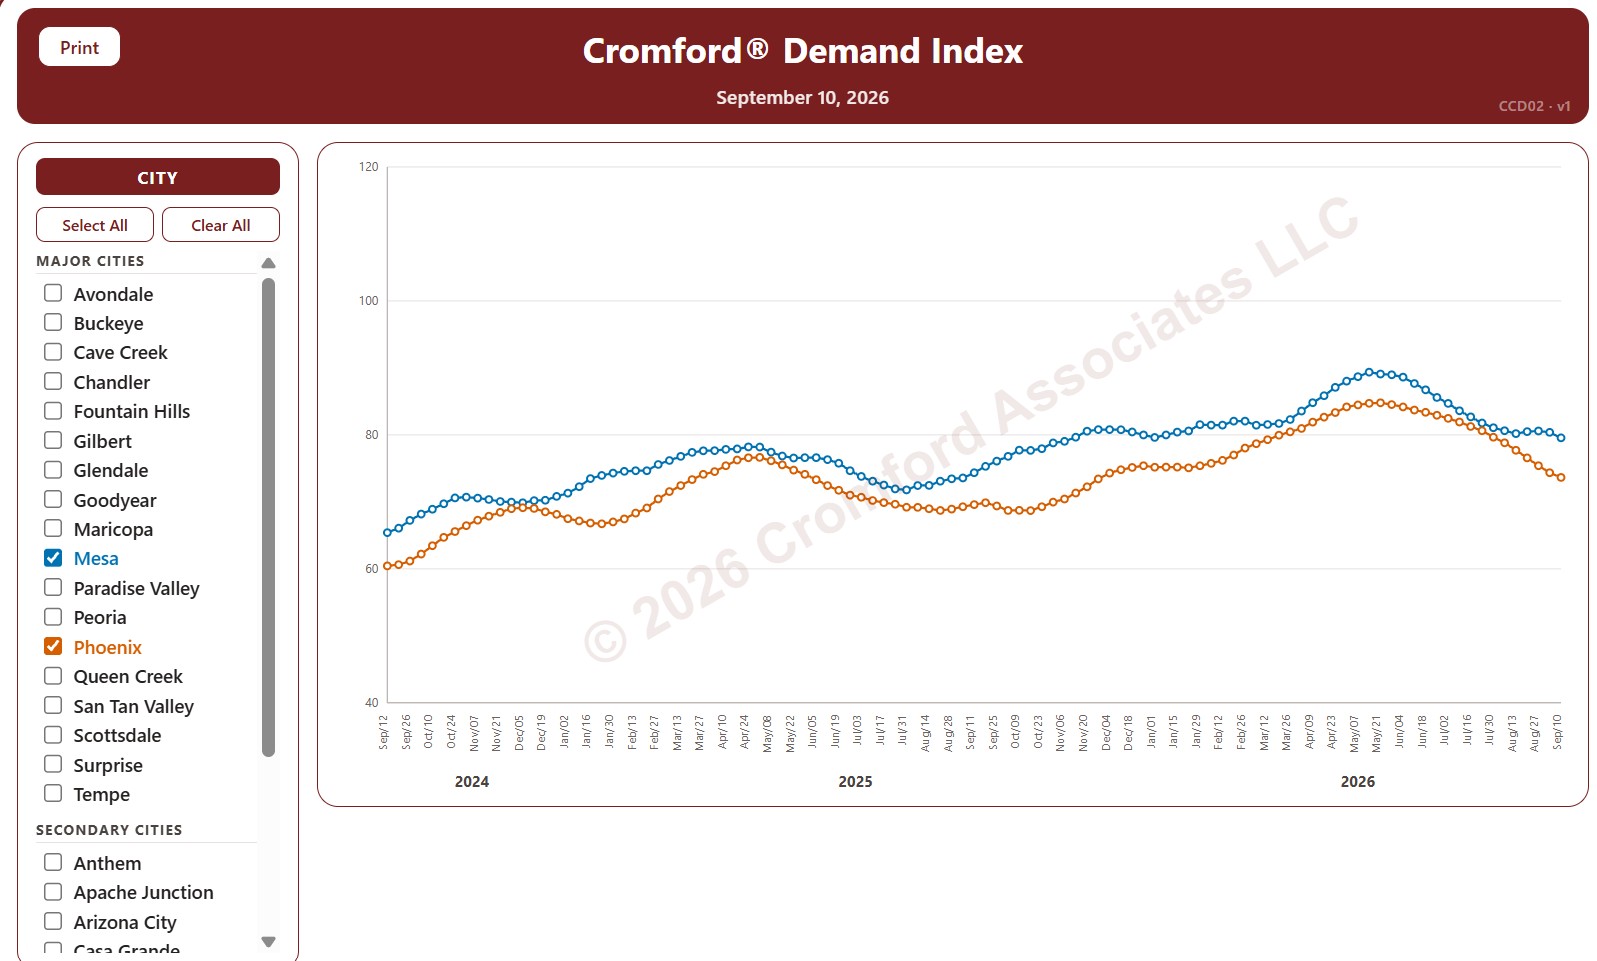
Cromford® Demand Index by City

About this chart

This chart tracks the Cromford® Demand Index for 34 cities in and around Greater Phoenix over the last 24 months, one point per week (each Thursday), for single-family detached resale homes listed on ARMLS. Above 100 means more demand than usual, below 100 less demand than usual, and 100 means demand is close to normal.

The 18 major cities are drawn as solid lines and the 16 secondary cities as dashed lines. It opens on Mesa and Phoenix; use the city check boxes, or Select All and Clear All, to choose which cities are shown.

Hover over a line to see the exact figure for that week.

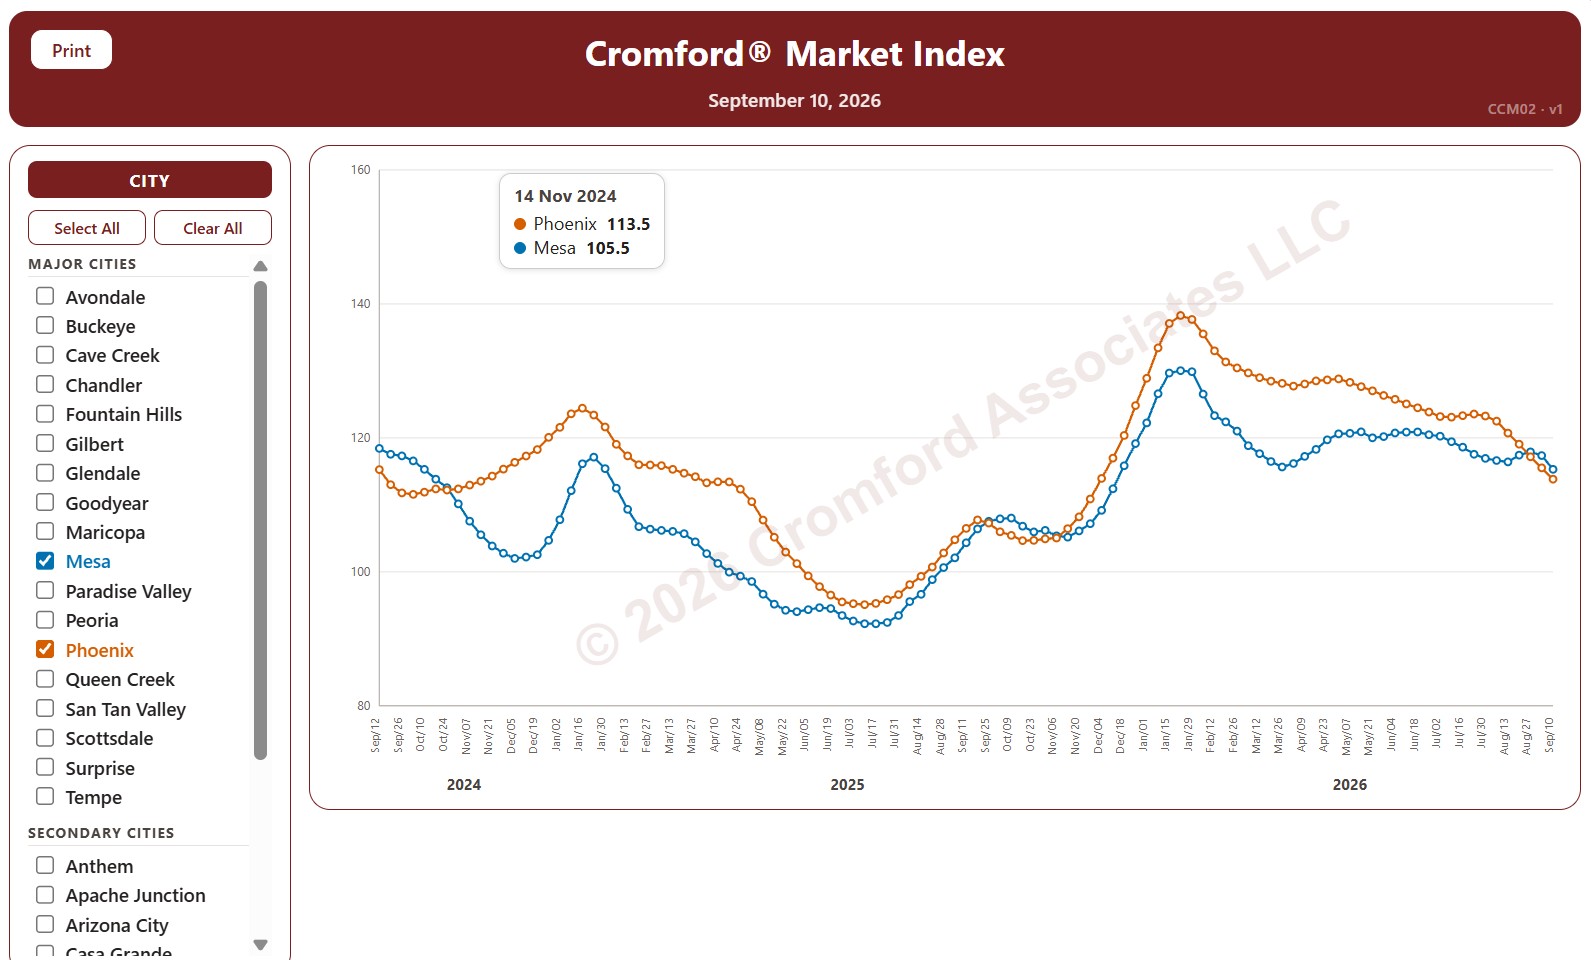
Cromford® Market Index by City

About this chart

This chart tracks the Cromford® Market Index for 34 cities in and around Greater Phoenix over the last 24 months, one point per week (each Thursday). It covers single-family detached resale homes listed on ARMLS. The 18 major cities are drawn as solid lines and the 16 secondary cities as dashed lines.

A reading above 110 means the city’s market favors sellers, below 90 it favors buyers, and between 90 and 110 the market is balanced. The index looks ahead, so the direction of a line shows which way the balance between buyers and sellers is moving.

Use the city check boxes, or Select All and Clear All, to choose which cities are shown. Hover over a line to see the exact reading for that week.

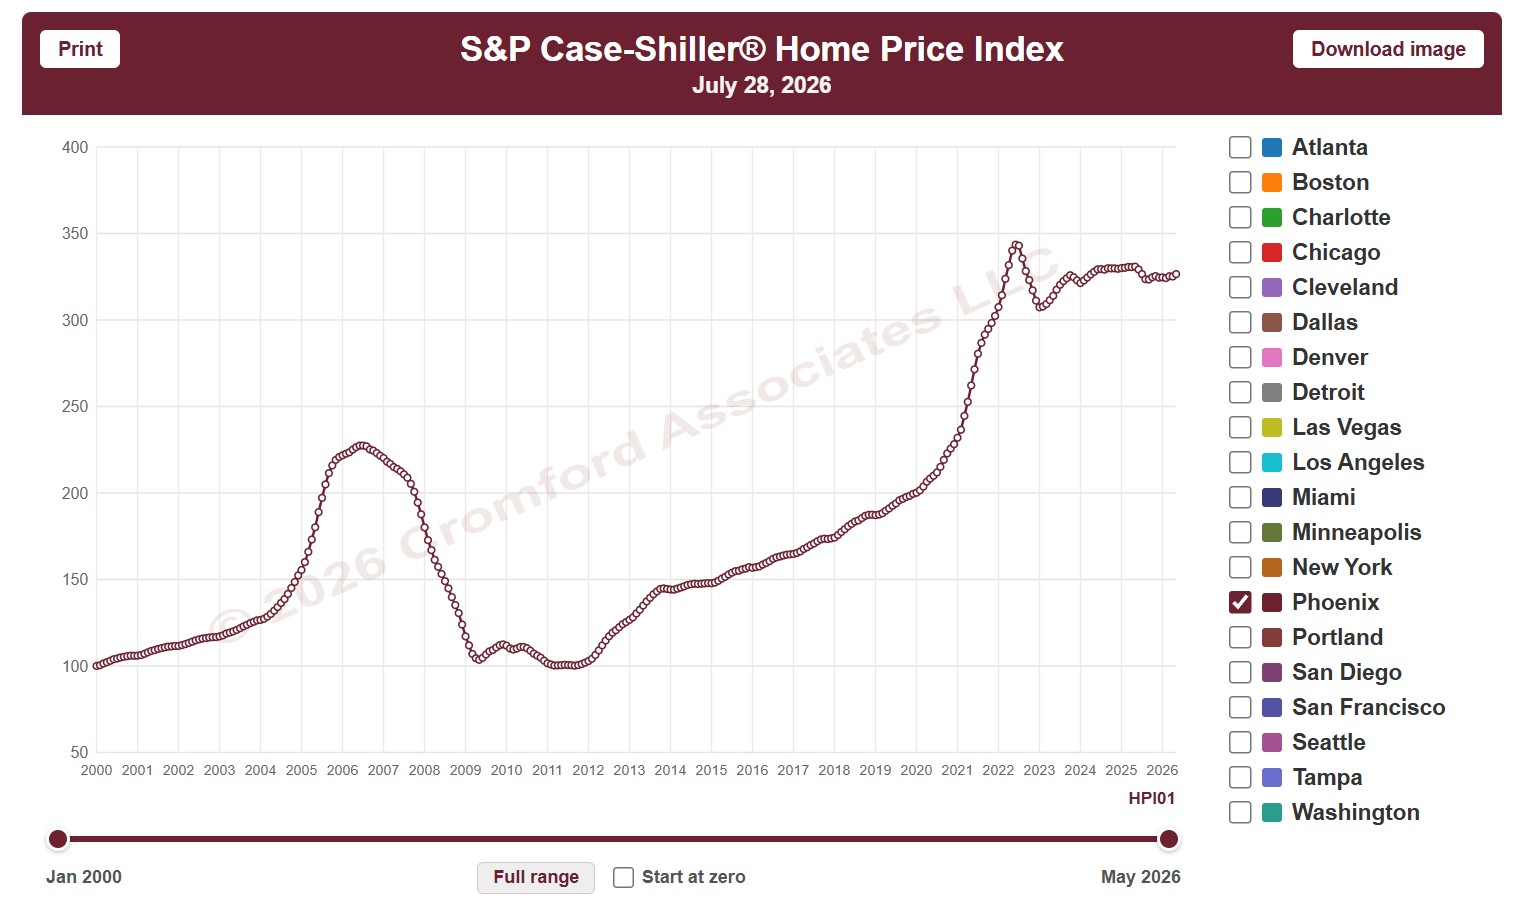
Case-Shiller® Home Price Index®

About this chart

This chart shows the S&P Cotality Case-Shiller Home Price Index, which tracks the prices of the same homes as they resell, so it measures price change without being skewed by the mix of homes that sold. It opens on Phoenix; tick any of the other 19 metro areas to compare them.

The CPI option switches between nominal prices and real prices adjusted for US or Phoenix inflation, and Start at zero sets the axis to begin at zero. Use the date slider, or Full range, to choose the stretch of history shown.

The index is published monthly, about two months in arrears. Hover over the chart to see the figures for that month.

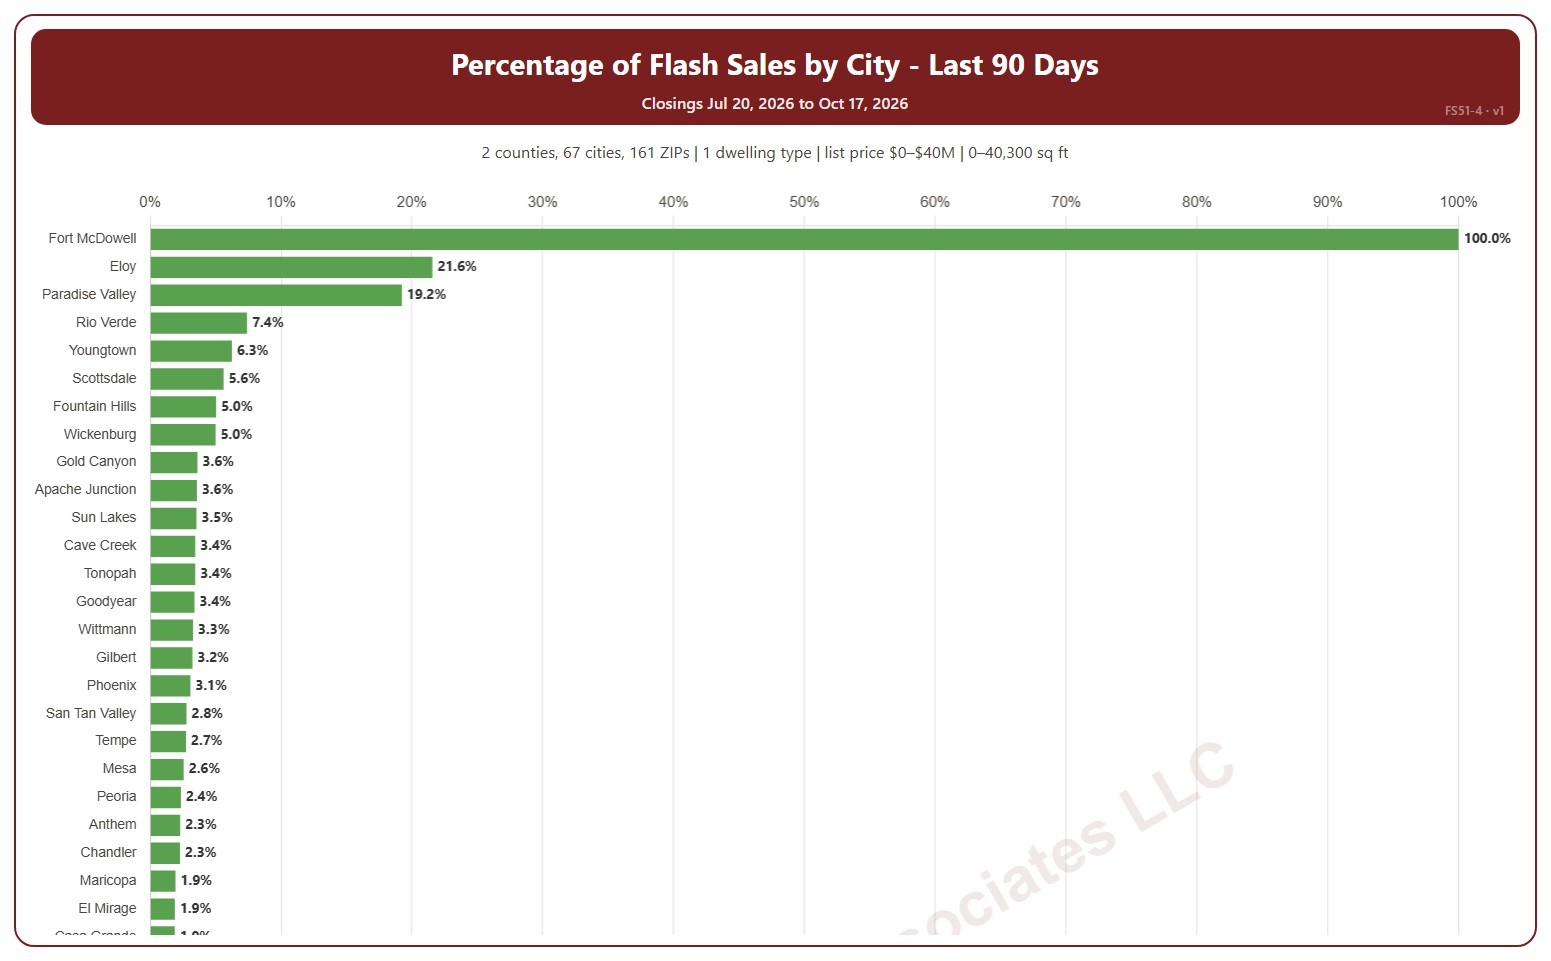
Percentage Flash Sales by City

About this chart

This chart shows flash sales as a percentage of all closings in each city, highest first. A city with only a few closings can show 0% or 100%. A flash sale is a closing that spent 1 day or less in the MLS (0 or 1 days on market, cumulative), usually a home that sold as soon as it was listed or was listed only to record a sale already agreed.

It covers the last 90 days to today; choose the last 30 days in the Period box instead. The chart is updated every day.

It opens on Maricopa and Pinal counties and single-family detached homes, as the original chart did. Use the County, City, and ZIP Code boxes to change the area, and narrow it further with the Dwelling Type and New / Resale boxes and the list price, home size, and year built sliders.

Hover over a bar to see the flash sales and all closings in the city.