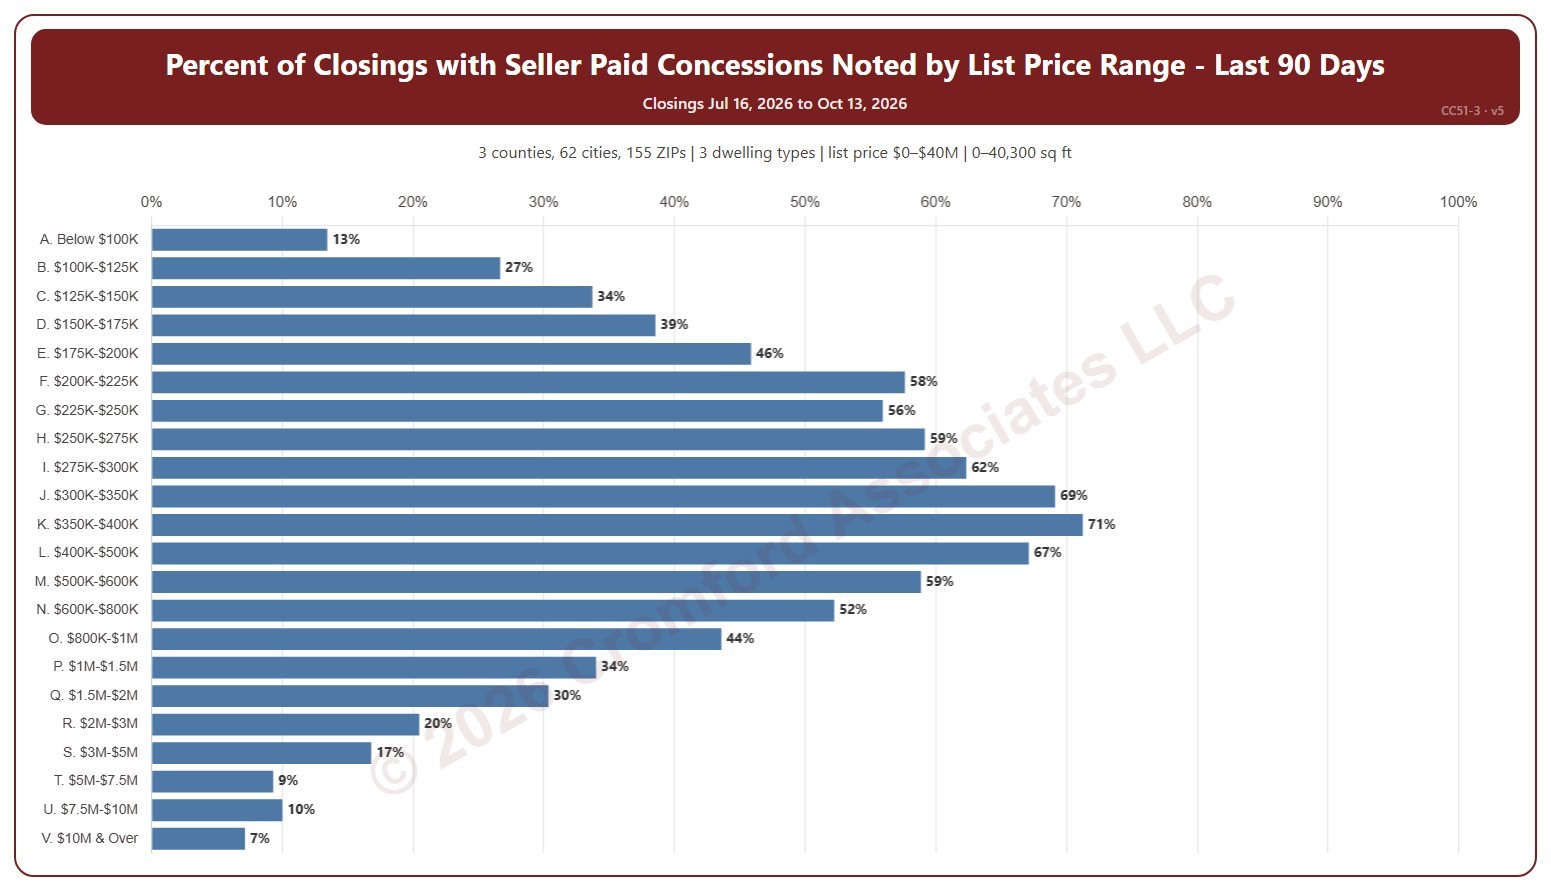
Percent of Closings with Seller Paid Concessions Noted by List Price Range

About this chart

This chart shows the percentage of recent closings that had a seller-paid concession noted, for each of 22 list price ranges from below $100K to $10M and over. A seller-paid concession is money the seller agrees to pay toward the buyer’s closing costs or other expenses, as noted on the ARMLS listing when it closes.

It opens on the last 90 days. Use the Period panel to switch between the last 30 and the last 90 days. The heading shows the exact dates covered. The chart is updated every day.

It opens on the Greater Phoenix area: the counties, cities, and ZIP codes that make it up are ticked to start with. Tick or untick any of them to change the area, including counties beyond Greater Phoenix. Narrow it further with the Dwelling Type, Transaction Type, and New / Resale boxes and the list price, home size, and year built sliders.

Hover over a bar to see the closings with a concession, the total, and the median concession.
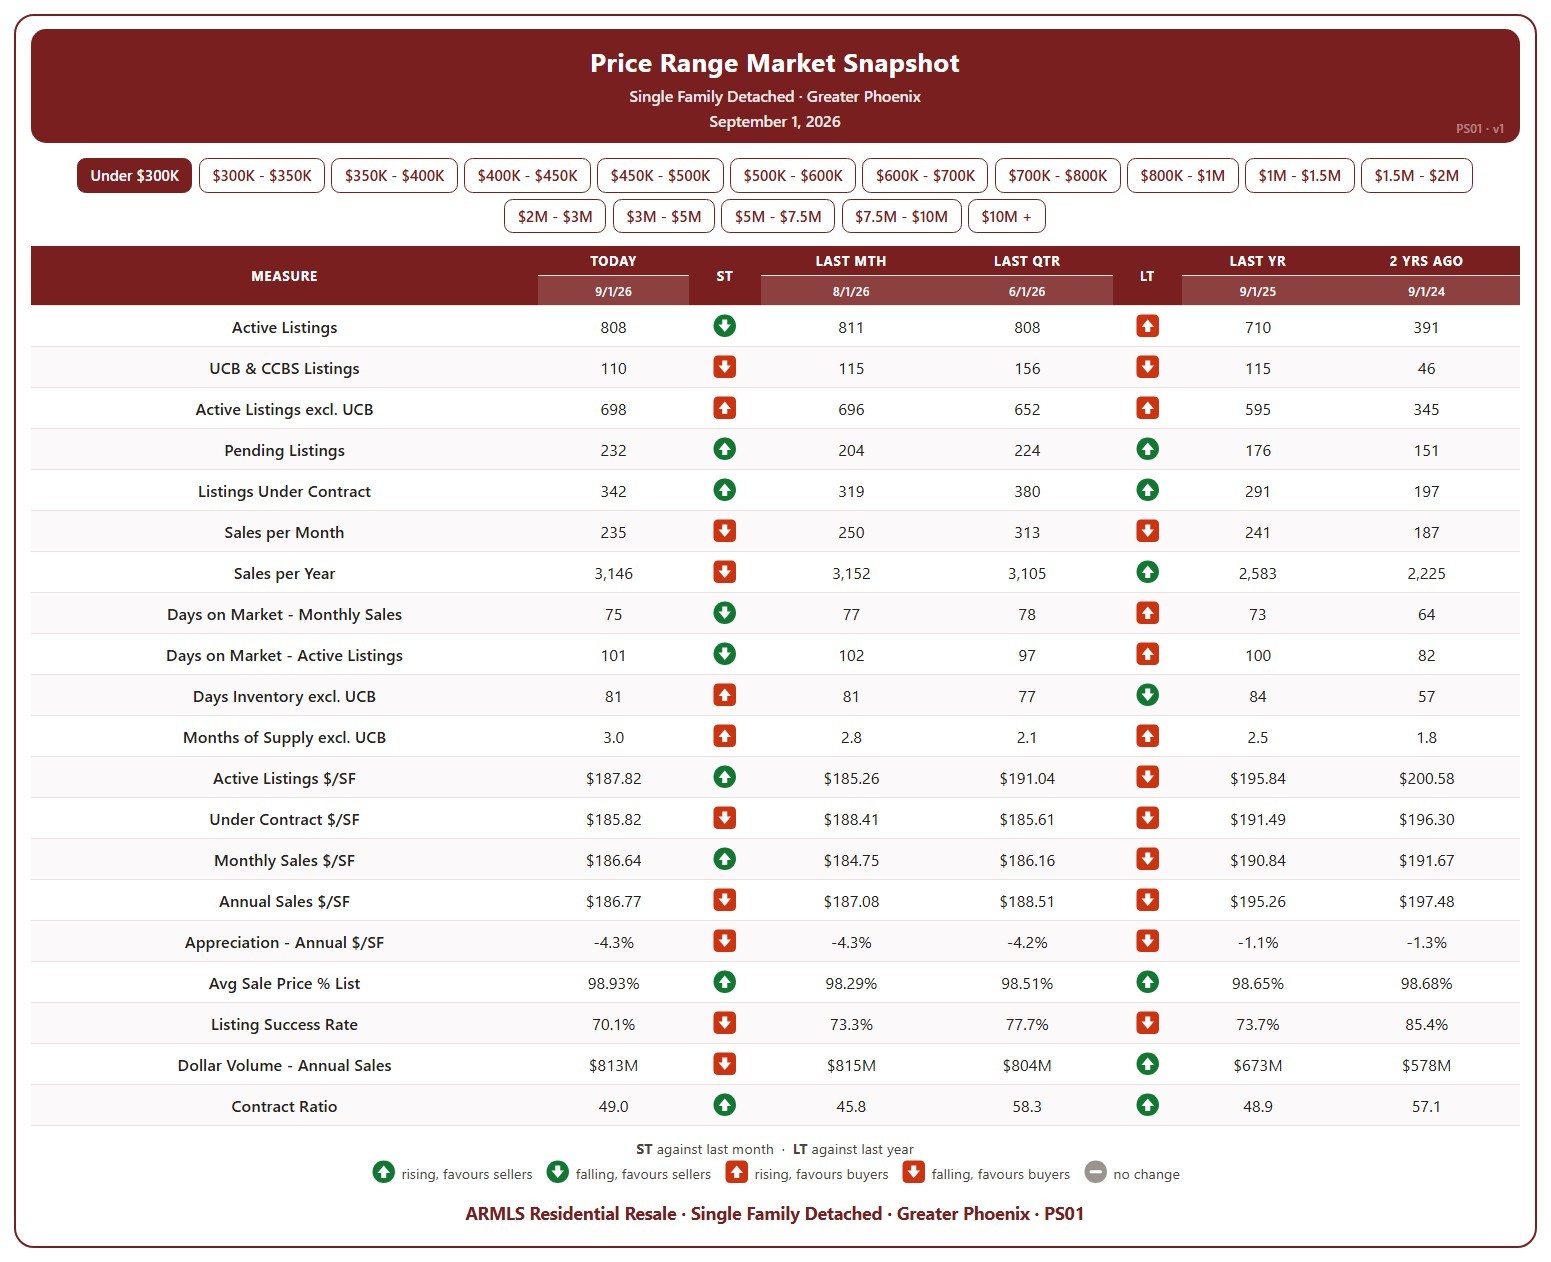
Price Range Market Snapshot

About this chart

This table shows 20 measures of the market for single-family detached homes in Greater Phoenix, for one list price band at a time, from under $300K up to $10M and over. Pick the band with the buttons at the top.

Each measure is shown today (the 1st of the month), a month ago, a quarter ago, a year ago, and two years ago, so you can see how that part of the market has moved. The ST and LT marks compare today with last month and with last year, colored by whether the change favors sellers or buyers.

It covers supply (active listings, UCB / CCBS, pending, days inventory, months of supply), demand (sales per month and per year, days on market, listing success rate, contract ratio), and pricing ($/SF of active, under contract, and sold homes, appreciation, sale price as a percentage of list, and dollar volume).

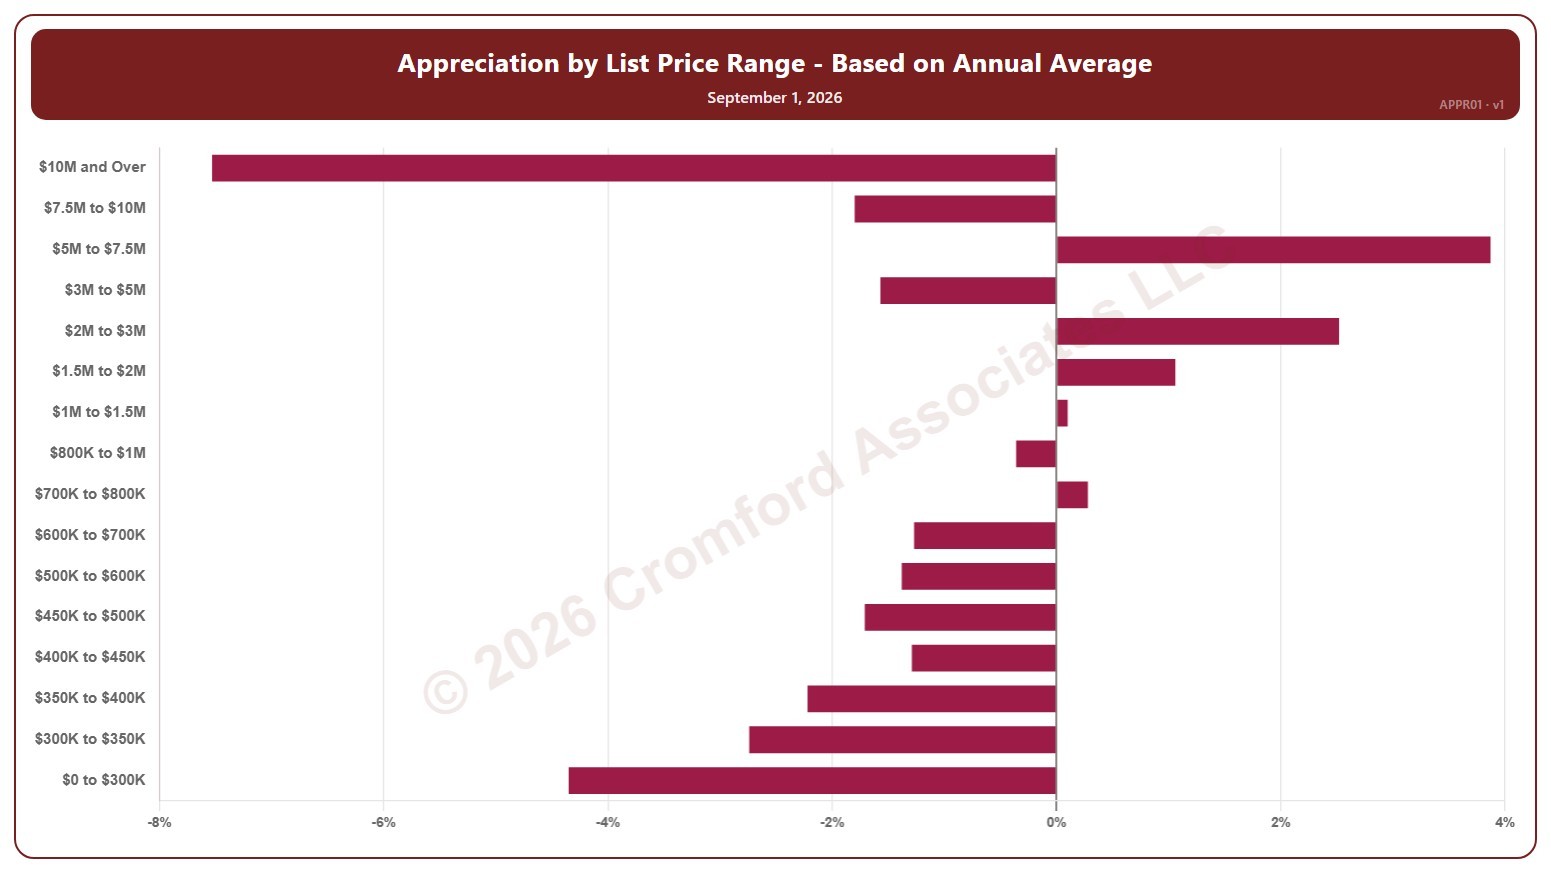
Appreciation by List Price Range – Based on Annual Average – Monthly

About this chart

This chart shows annual appreciation for single-family detached homes in Greater Phoenix, one bar for each of 16 list price bands from $0 to $300K up to $10M and over. Each bar is the change in the average sales price per square foot over the last 12 months, compared with the same period a year earlier, measured at the start of each month.

It shows which parts of the market are gaining or losing ground. A band with no closings in the period keeps its label but shows no bar.

Hover over a bar to see the exact figure for that band.

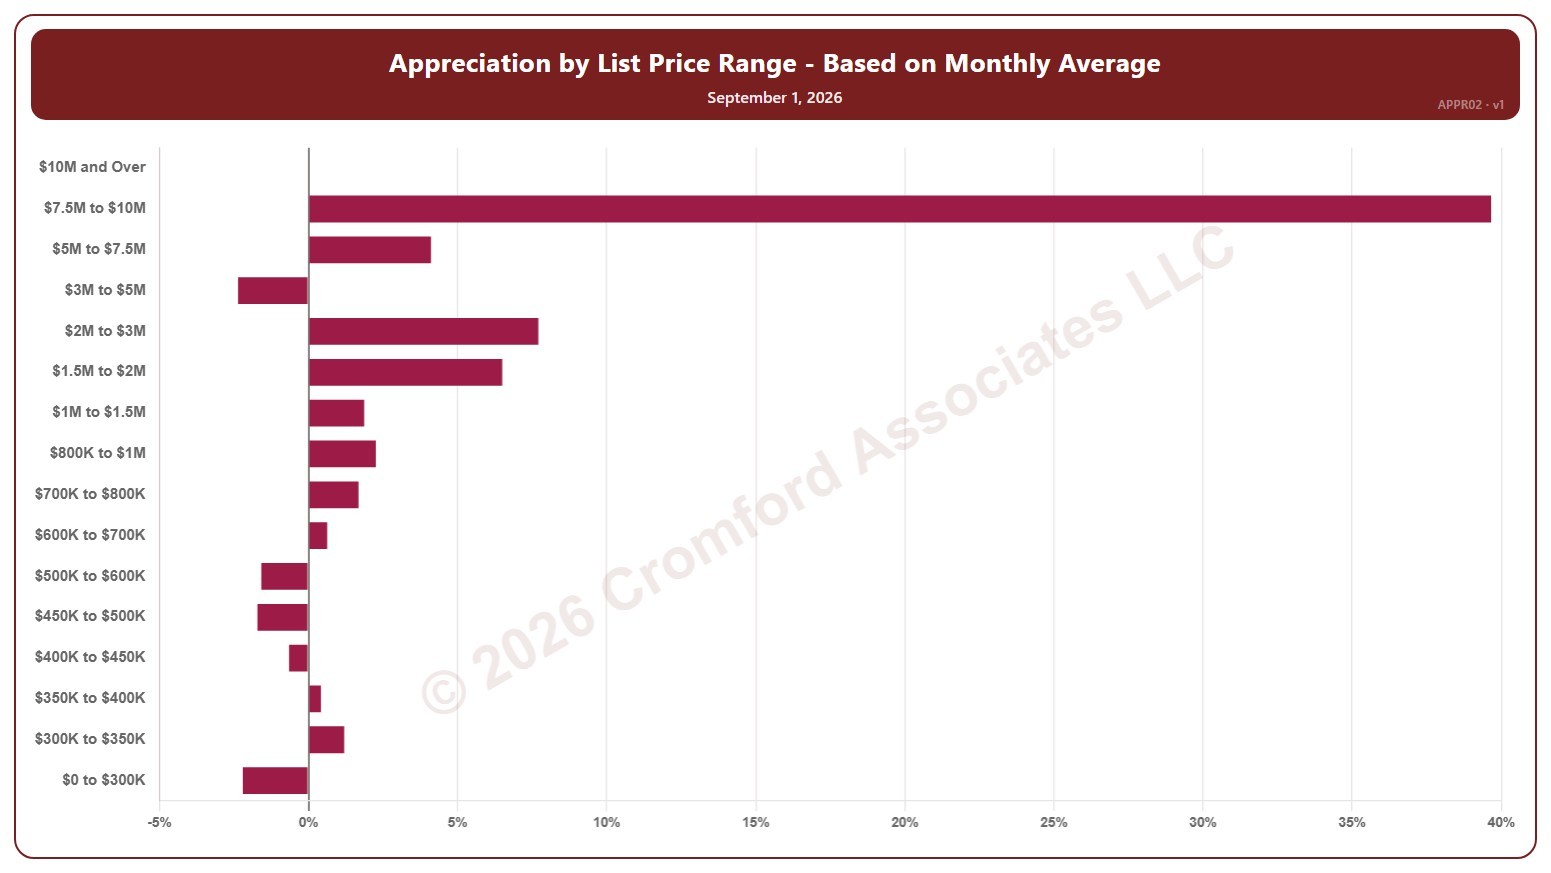
Appreciation by List Price Range – Based on Monthly Average – Monthly

About this chart

This chart shows annual appreciation for single-family detached homes in Greater Phoenix, one bar for each of 16 list price bands from $0 to $300K up to $10M and over. Each bar is the change in the average sales price per square foot over the last month, compared with the same period a year earlier, measured at the start of each month.

It shows which parts of the market are gaining or losing ground. A band with no closings in the period keeps its label but shows no bar.

Hover over a bar to see the exact figure for that band.

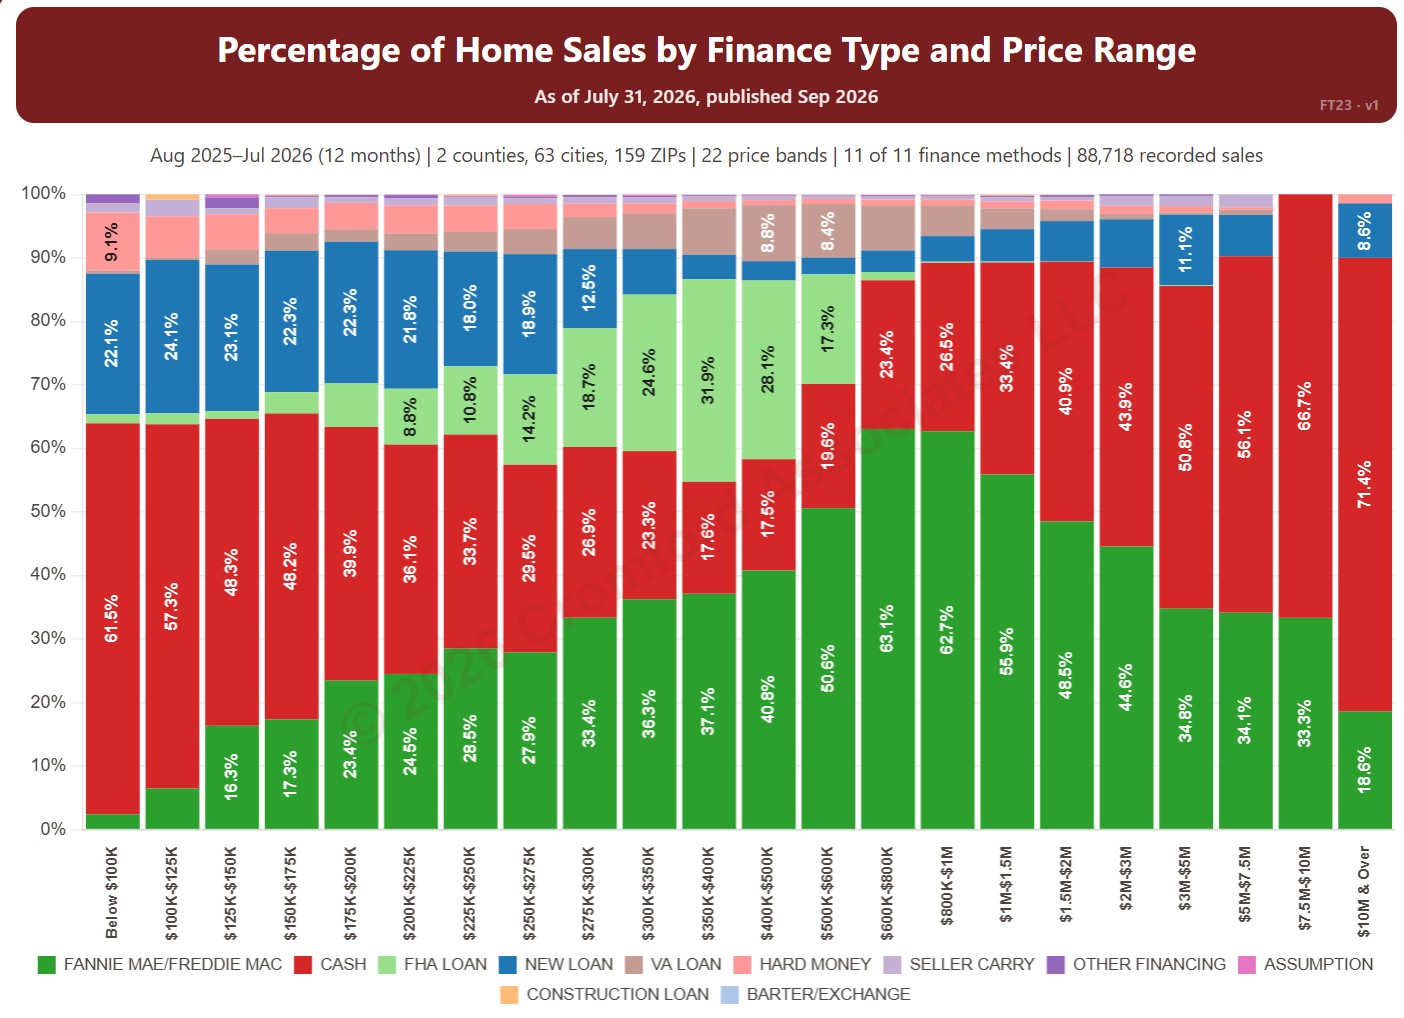
Percentage of Home Sales by Finance Type and Price Range

About this chart

This chart shows how homes were paid for in each of 22 price bands, from below $100K to $10M and over, from residential deeds recorded by Maricopa and Pinal Counties. Each bar adds up to 100% and is split by finance method, such as cash, Fannie Mae / Freddie Mac, FHA, and VA, so you can see how the way buyers pay changes with price.

It opens on the last 12 months of records; use the Recording Month slider to choose the months covered. It opens on Maricopa and Pinal Counties with everything included; narrow it with the County, City, and ZIP panels and the Property Type, 55+ Communities, Finance Method, Transaction Type, and Price Range boxes.

Hover over a bar to see each share for that price band.

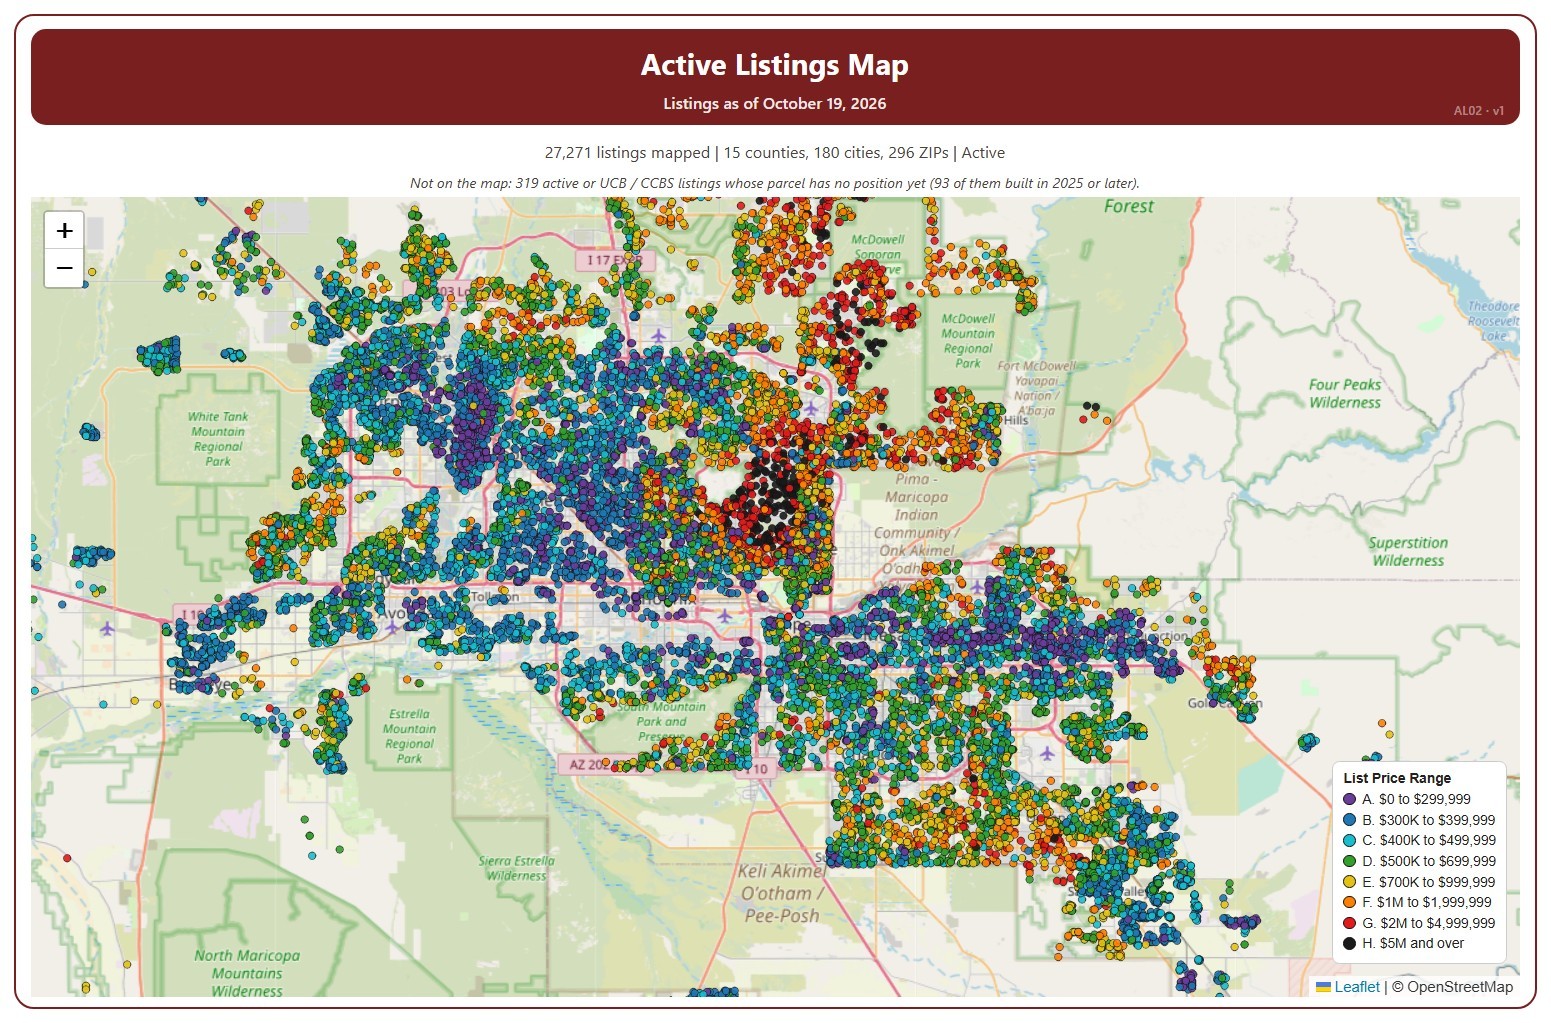
Active Listings Map

About this chart

This map shows every home listed for sale or coming soon on ARMLS across Arizona today, one dot per listing, coloured by its list price range, from A (under $300,000) to H ($5 million and over).

It opens on Active and Coming Soon listings in every county; tick UCB / CCBS in the Status box to add listings under contract with a contingency. Tick or untick counties, cities, and ZIP codes to change the area, and use the Price Range boxes to show or hide a range. The map is updated every day.

Narrow it further with the Dwelling Type, Transaction Type, and New / Resale boxes and the list price, home size, year built, and days on market sliders. A listing whose parcel has no map position yet is not shown; the note above the map says how many.

Hover over a dot to see the address, list price, status, dwelling and transaction type, size, year built, days on market, and listing office.

Median Sales Price Map

About this chart

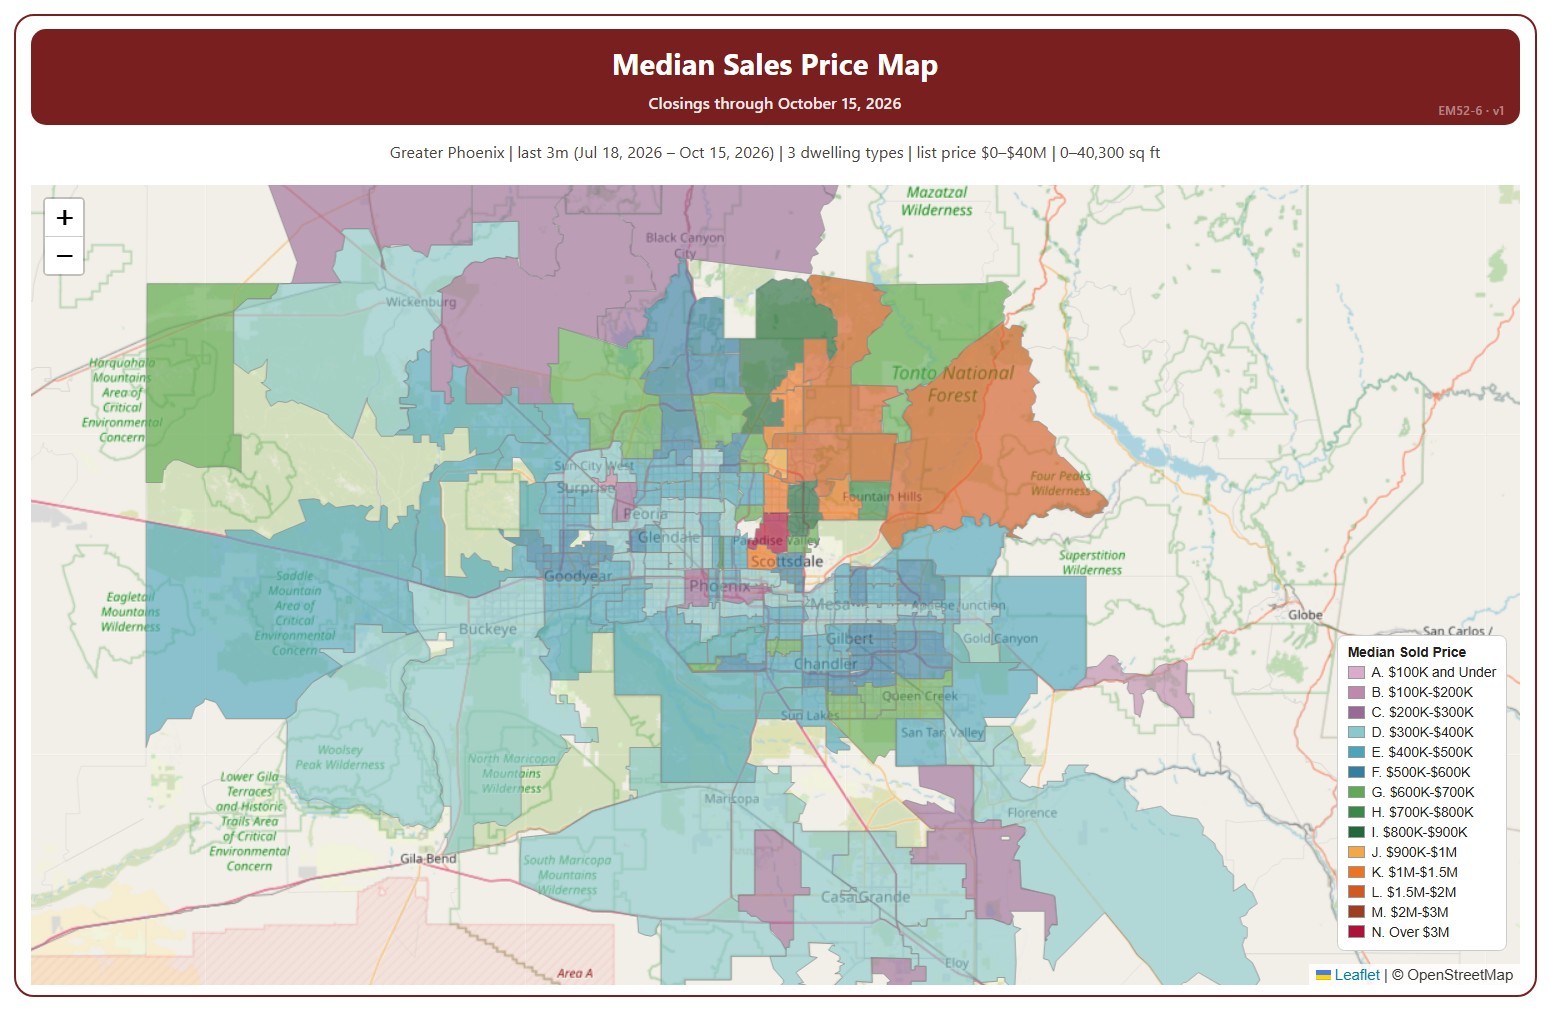
This map colors each ZIP code by the median sales price of its closings over the time frame chosen, in 14 price ranges. The median sales price is the middle sale price of the homes that closed on ARMLS in the period: half sold for more and half for less. New homes are included.

It opens on the last 3 months to the newest closing; use the Time Frame buttons over the map for the last day, week, month, 3 months, year, or 5 years. Click a price range in the legend to hide or show it. Every ZIP code with a closing is colored, so a ZIP code with only one or two closings can show an unusual median; the number of closings is in its tooltip. The map is updated every day.

It opens on the Greater Phoenix area: the counties, cities, and ZIP codes that make it up are ticked to start with. Tick or untick any of them to change the area, including counties beyond Greater Phoenix. Narrow it further with the Dwelling Type, Transaction Type, and New / Resale boxes and the list price, home size, and year built sliders.

Hover over a ZIP code to see its median, its number of closings, and its price range.

Percentage of Flash Sales by Price Range

About this chart

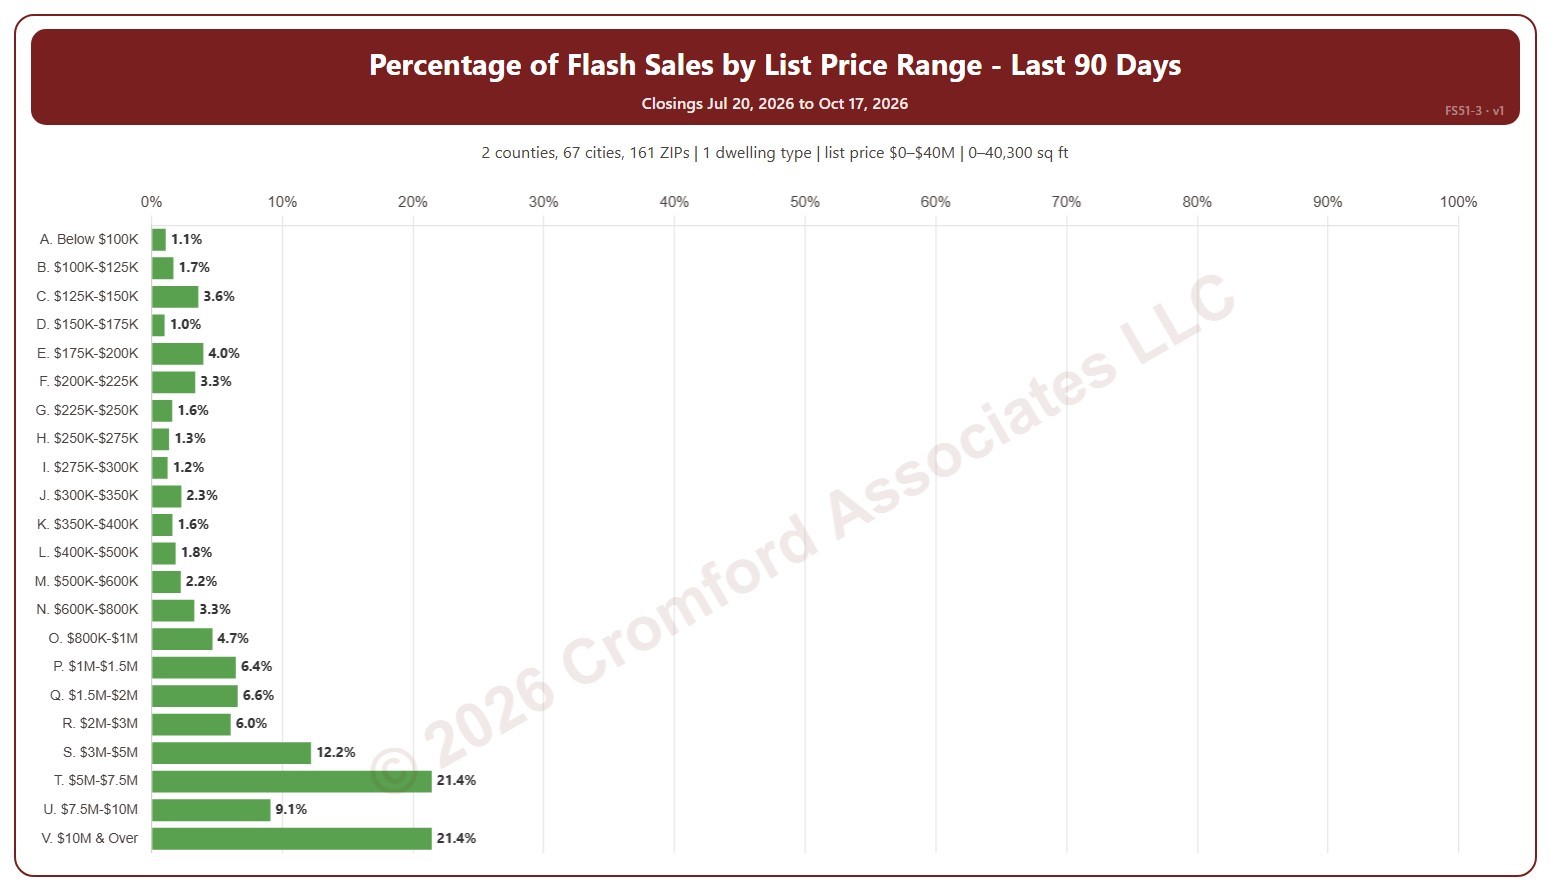
This chart shows flash sales as a percentage of all closings in each list price range. A flash sale is a closing that spent 1 day or less in the MLS (0 or 1 days on market, cumulative), usually a home that sold as soon as it was listed or was listed only to record a sale already agreed.

It covers the last 90 days to today; choose the last 30 days in the Period box instead. The chart is updated every day.

It opens on Maricopa and Pinal counties and single-family detached homes, as the original chart did. Use the County, City, and ZIP Code boxes to change the area, and narrow it further with the Dwelling Type and New / Resale boxes and the list price, home size, and year built sliders.

Hover over a bar to see the flash sales and all closings in the range.

Listing Success Rate by Price Range

About this chart

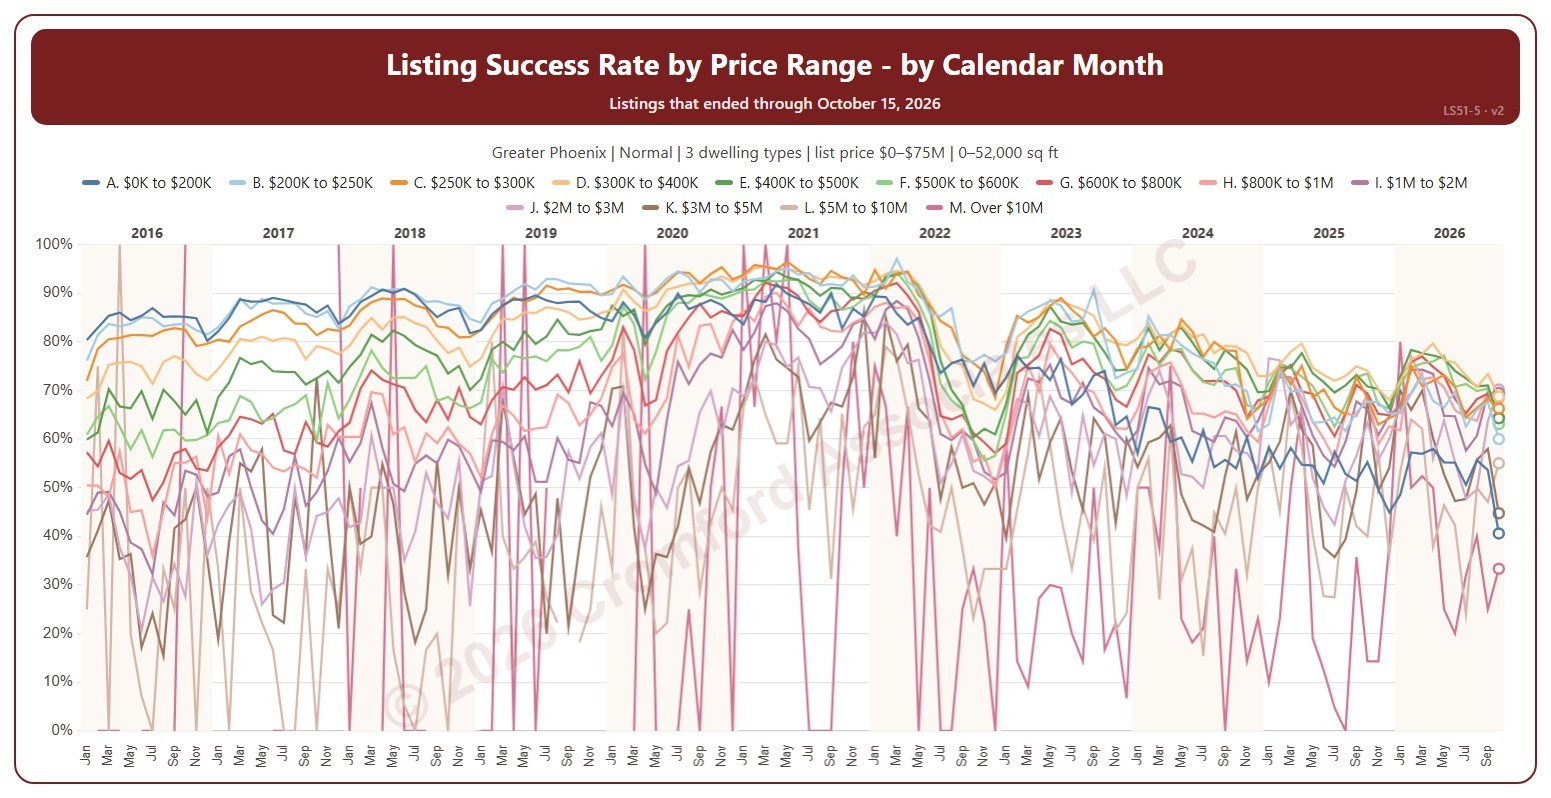
This chart shows the listing success rate each month for each list price range, a line per range. The listing success rate is the share of listings that closed, out of all the listings that ended: closed, expired, or cancelled. Each listing counts once, in the month (or window) its listing ended: the closing date for a closing, the expiration for an expired listing, the cancellation for a cancelled one. The highest price ranges have few listings, so their lines swing widely.

It opens on January 2016 to date; drag the handles of the date slider under the chart to choose the months shown, as far back as January 2004. The newest month is the month so far, shown as a hollow point. The chart is updated every day. Click a price range in the legend to hide or show its line.

It opens on the Greater Phoenix area: the counties, cities, and ZIP codes that make it up are ticked to start with. Tick or untick any of them to change the area, including counties beyond Greater Phoenix. It opens on normal sales; tick other transaction types to add them. Narrow it further with the Dwelling Type and New / Resale boxes and the list price, home size, and year built sliders.

Hover over the chart to see each range’s rate that month and how many listings closed out of all that ended.

Listing Success by Price Range

About this chart

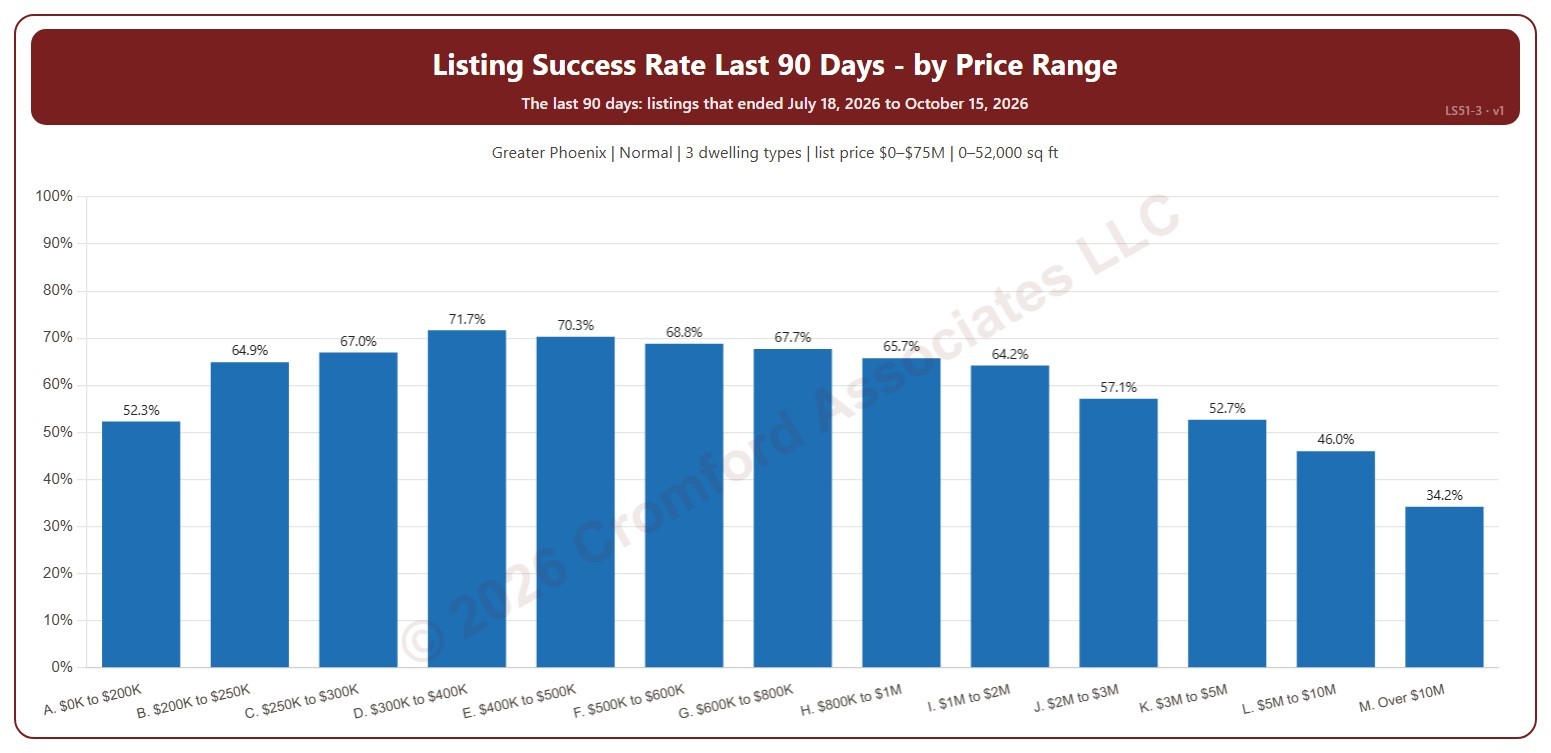
This chart shows the listing success rate over the last 90 days in each list price range, from $200K and under to over $10M. The listing success rate is the share of listings that closed, out of all the listings that ended: closed, expired, or cancelled. Each listing counts once, in the month (or window) its listing ended: the closing date for a closing, the expiration for an expired listing, the cancellation for a cancelled one.

It covers the 90 days of listings that ended up to the newest one; the heading shows the exact dates. The chart is updated every day.

It opens on the Greater Phoenix area: the counties, cities, and ZIP codes that make it up are ticked to start with. Tick or untick any of them to change the area, including counties beyond Greater Phoenix. It opens on normal sales; tick other transaction types to add them. Narrow it further with the Dwelling Type and New / Resale boxes and the list price, home size, and year built sliders.

Hover over a bar to see the rate, the listings that closed, and those that expired or were cancelled.