Annual Average Sale Price per Square Foot by ZIP Code

About this chart

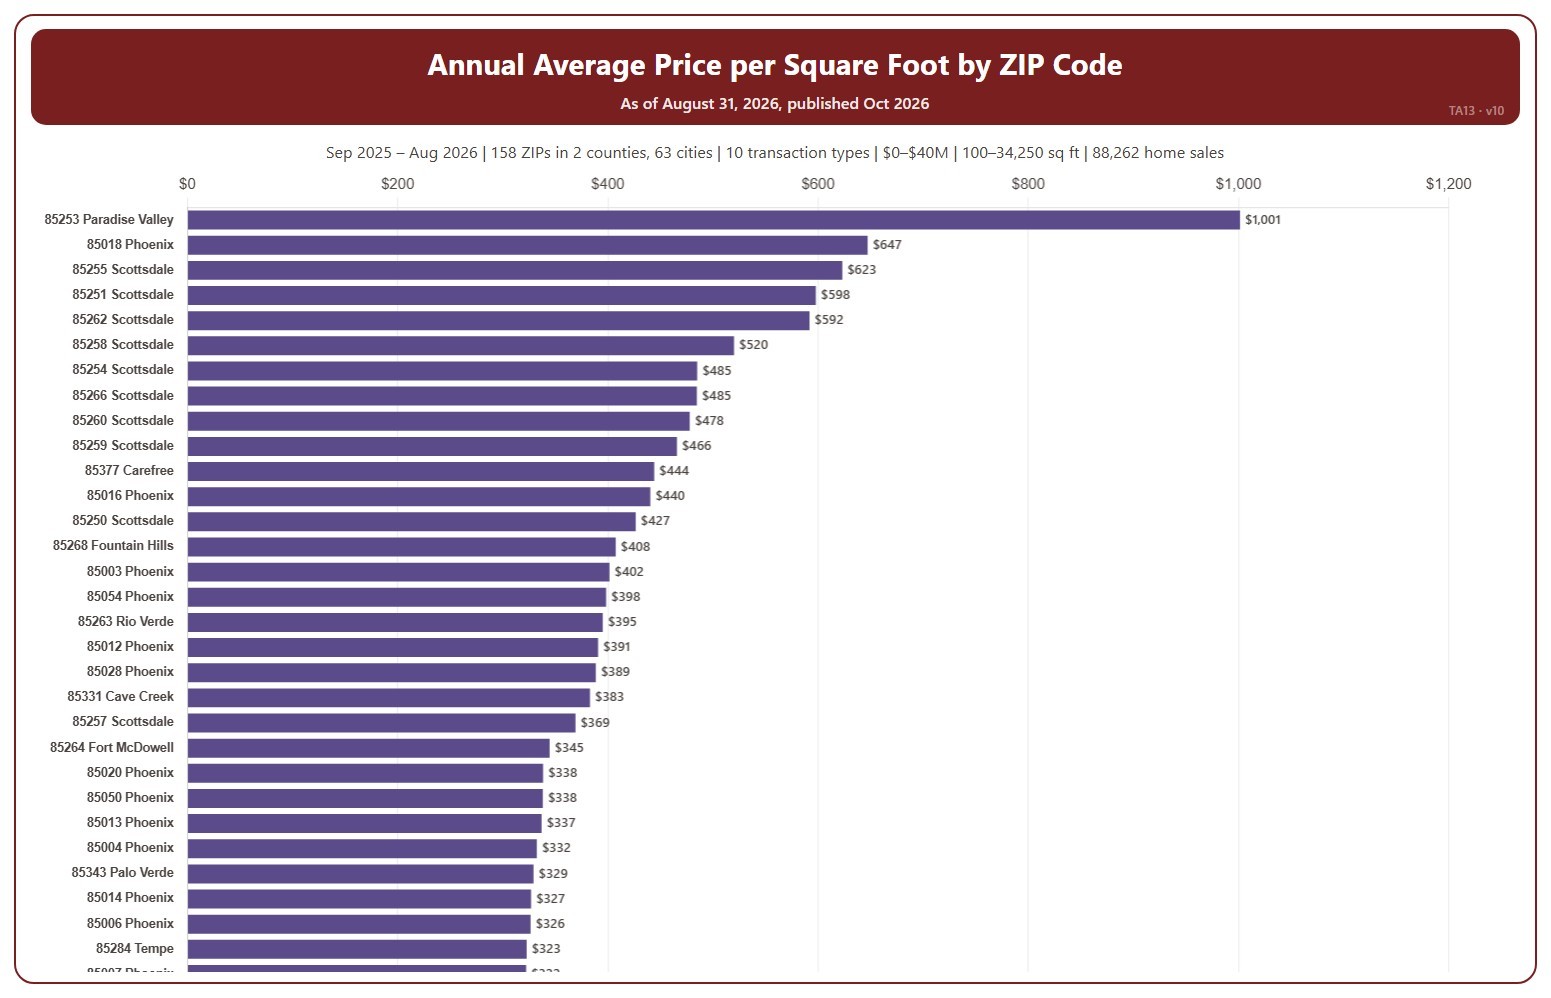
This chart ranks ZIP codes by the average price per square foot of the homes sold, from residential deeds recorded by Maricopa and Pinal Counties. Price per square foot lets you compare homes of different sizes. Because it is built from recorded deeds, it covers every recorded sale, not just homes listed on ARMLS: new homes, private sales, and investor deals are all included.

It opens on the last 12 months of records; use the Recording Month slider to choose the months covered. The list scrolls.

It opens on Maricopa and Pinal Counties with everything included. Narrow it with the County, City, and ZIP panels, the Transaction Type, Property Type, and 55+ Communities boxes, and the sale price and home size sliders.

Hover over a bar to see the exact figure for that ZIP code.
Annual Home Sales by ZIP Code

About this chart

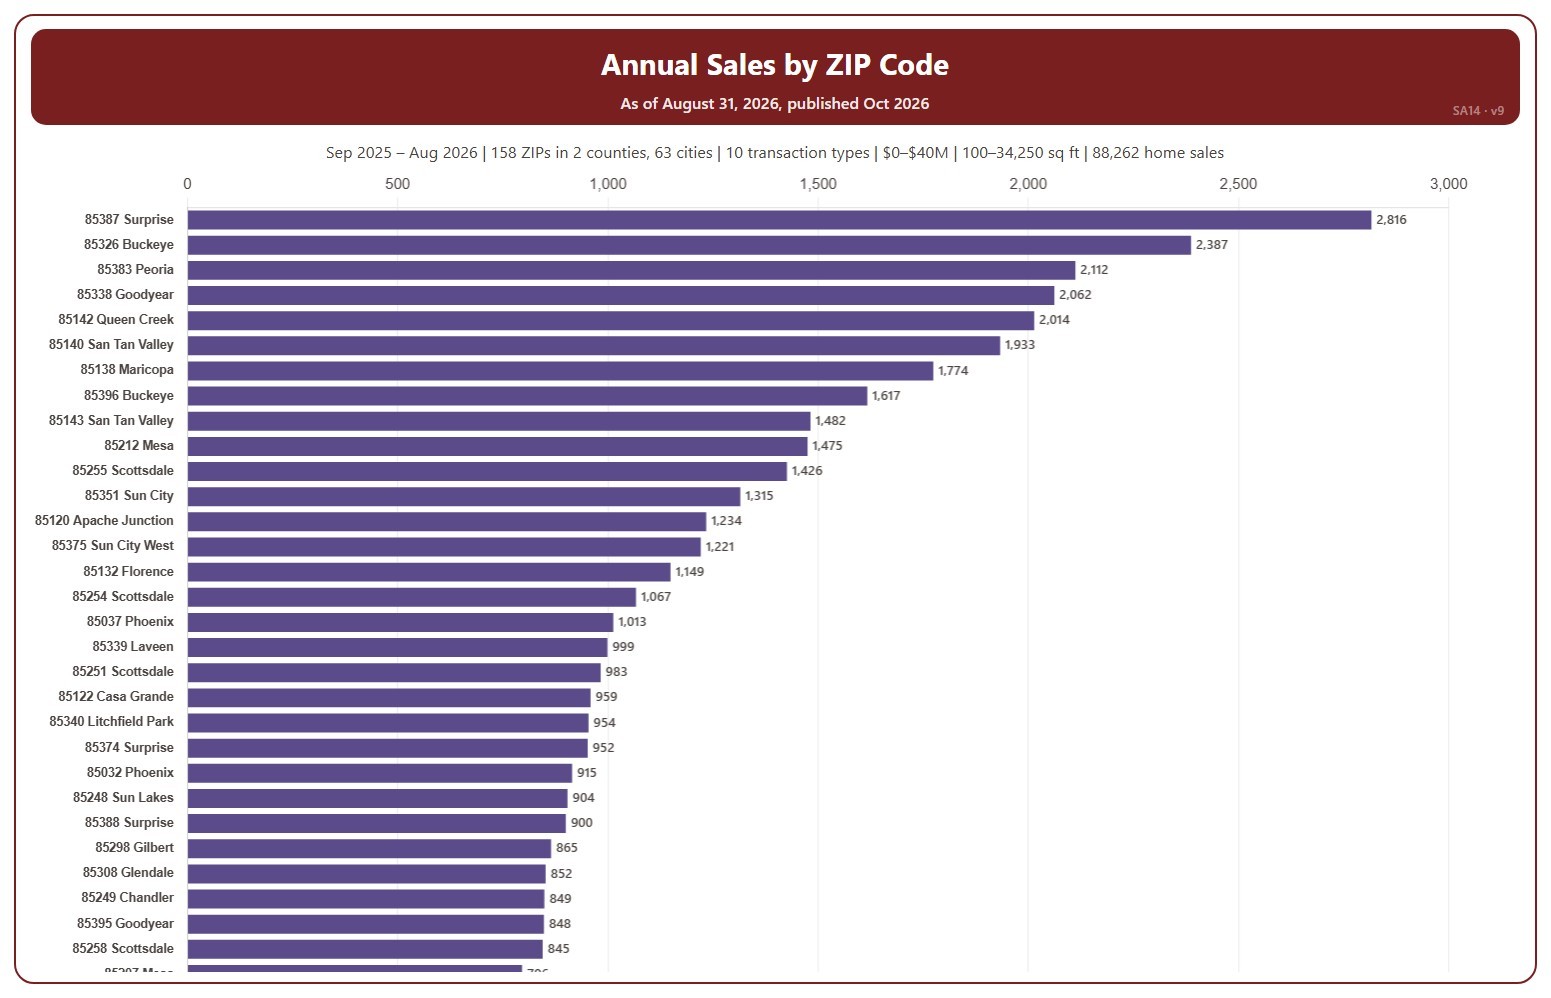
This chart ranks ZIP codes by the number of homes sold, from residential deeds recorded by Maricopa and Pinal Counties. Because it is built from recorded deeds, it covers every recorded sale, not just homes listed on ARMLS: new homes, private sales, and investor deals are all included.

It opens on the last 12 months of records; use the Recording Month slider to choose the months covered. The list scrolls.

It opens on Maricopa and Pinal Counties with everything included. Narrow it with the County, City, and ZIP panels, the Transaction Type, Property Type, and 55+ Communities boxes, and the sale price and home size sliders.

Hover over a bar to see the exact figure for that ZIP code.
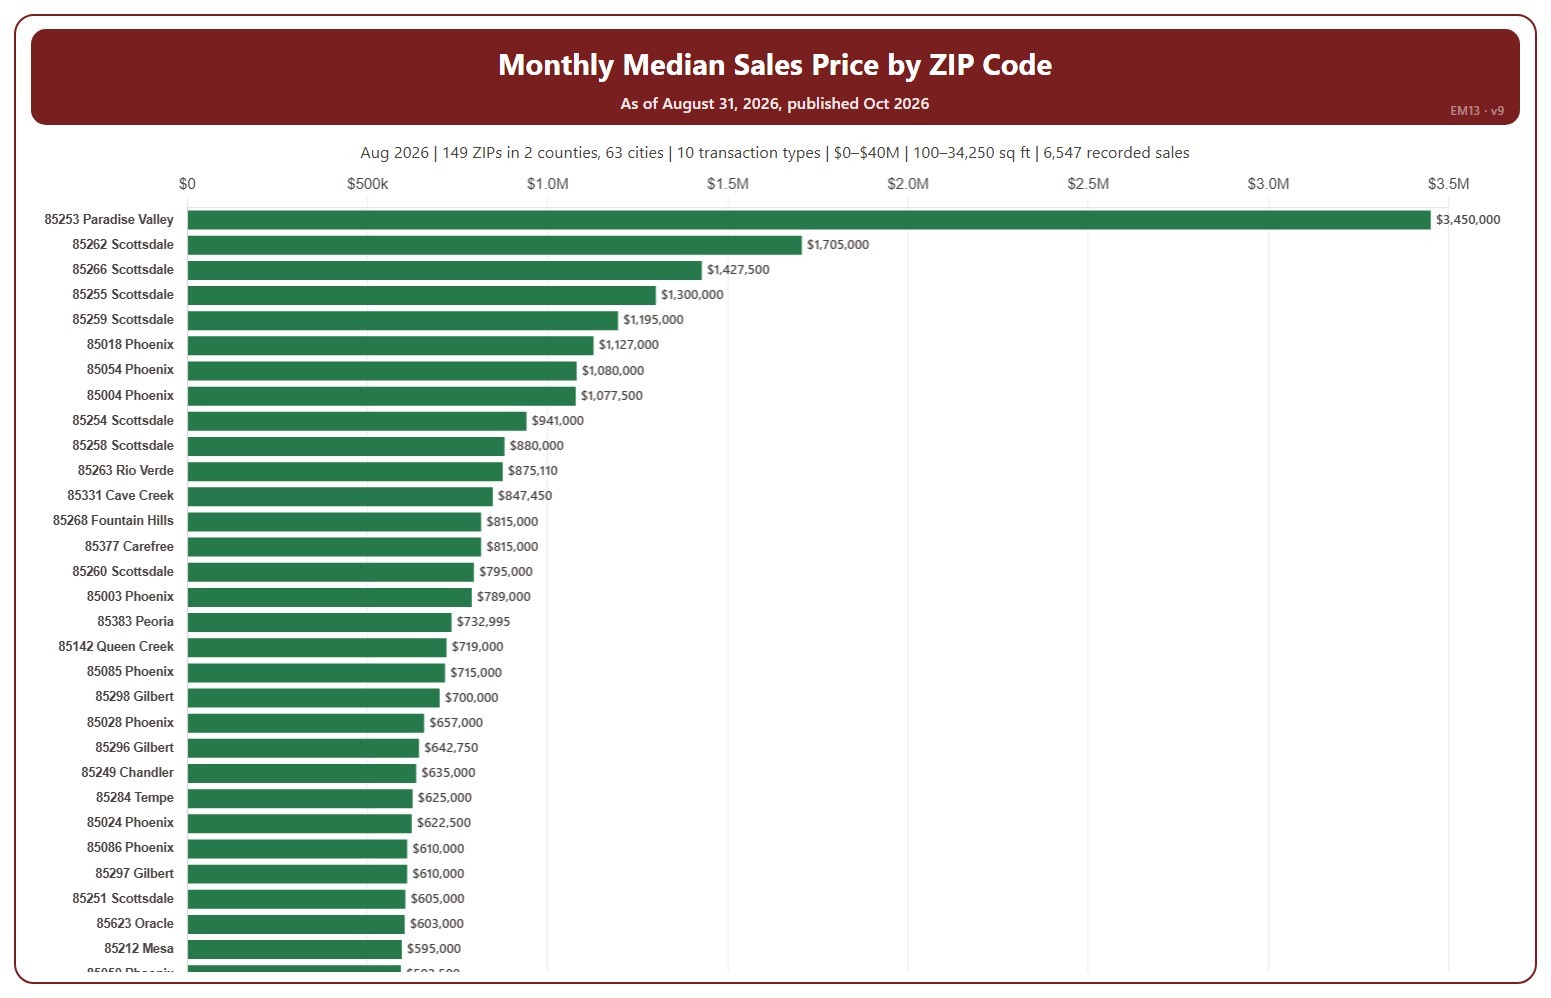
Monthly Median Sales Price by ZIP Code

About this chart

This chart ranks ZIP codes by the median sale price of the homes sold, from residential deeds recorded by Maricopa and Pinal Counties. The median is the price in the middle: half sold for more and half for less. Because it is built from recorded deeds, it covers every recorded sale, not just homes listed on ARMLS: new homes, private sales, and investor deals are all included.

It opens on the latest month recorded; use the Recording Month slider to widen it to more months. The list scrolls to show every ZIP code.

It opens on Maricopa and Pinal Counties with everything included. Narrow it with the County, City, and ZIP panels, the Transaction Type, Property Type, and 55+ Communities boxes, and the sale price and home size sliders.

Hover over a bar to see the exact figure for that ZIP code.
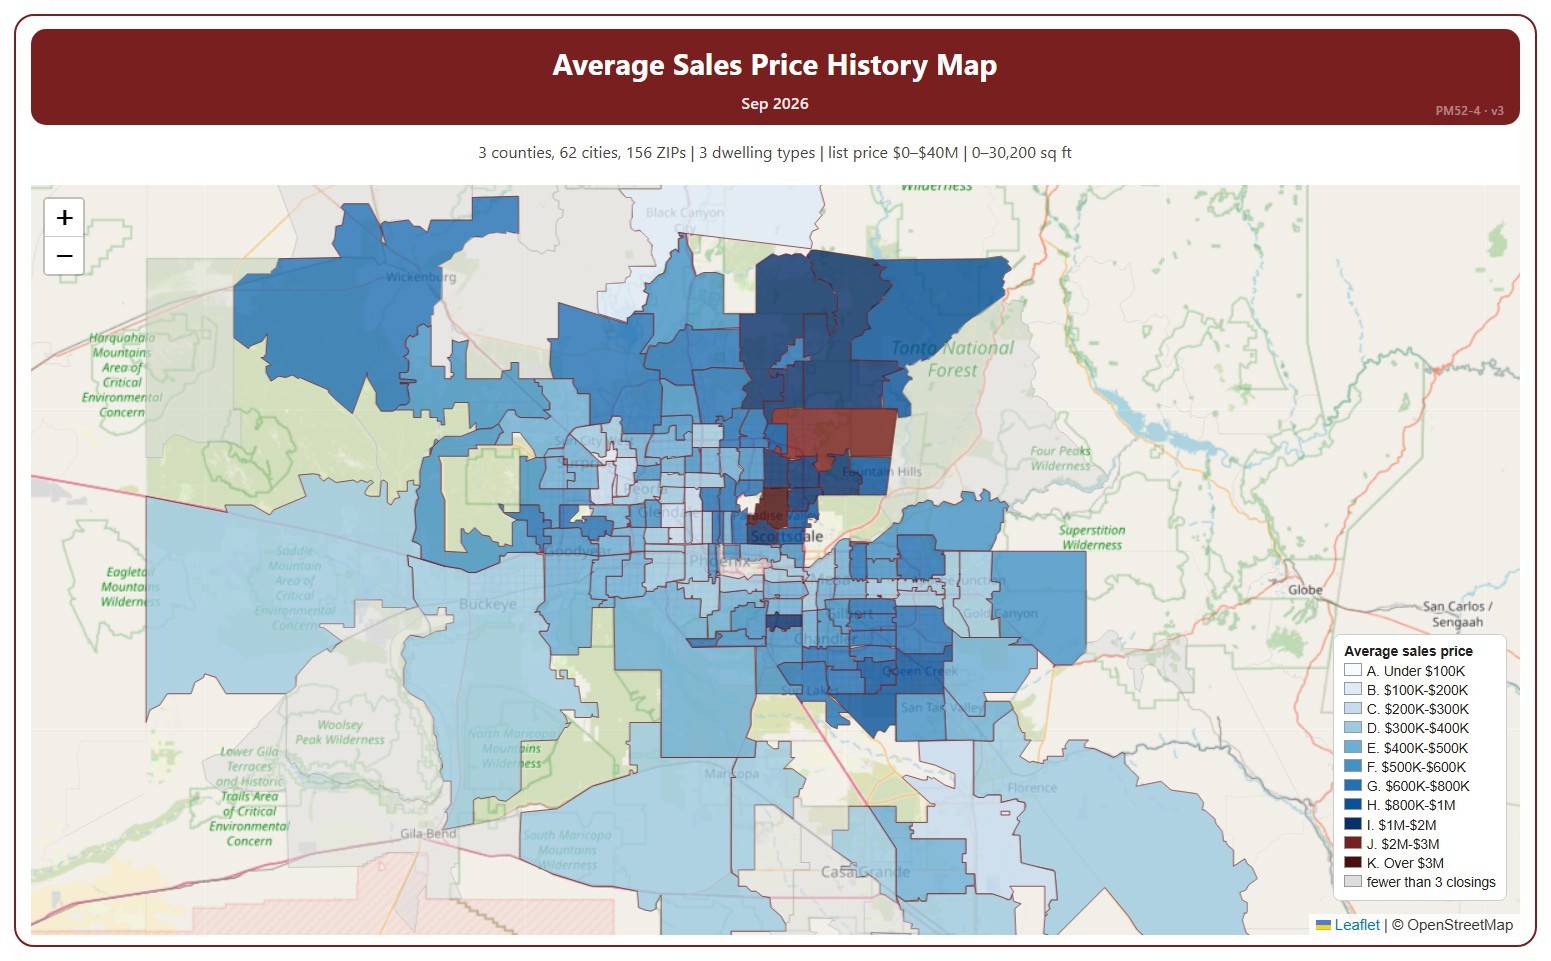
Average Sales Price History Map

About this chart

This map shades each ZIP code by the average sale price of the homes that closed in one month, in price ranges from under $100K to over $3M.

It opens on the latest complete month. Use the Month panel, or its arrows, to step back through earlier months as far as 2008. ZIP codes with fewer than 3 closings in the month are shown in grey.

It opens on the Greater Phoenix area: the counties, cities, and ZIP codes that make it up are ticked to start with. Tick or untick any of them to change the area, including counties beyond Greater Phoenix. Narrow it further with the Dwelling Type, Transaction Type, and New / Resale boxes and the list price, home size, and year built sliders.

Hover over a ZIP code to see its average price and number of closings.

Lease Price by ZIP Code

About this chart

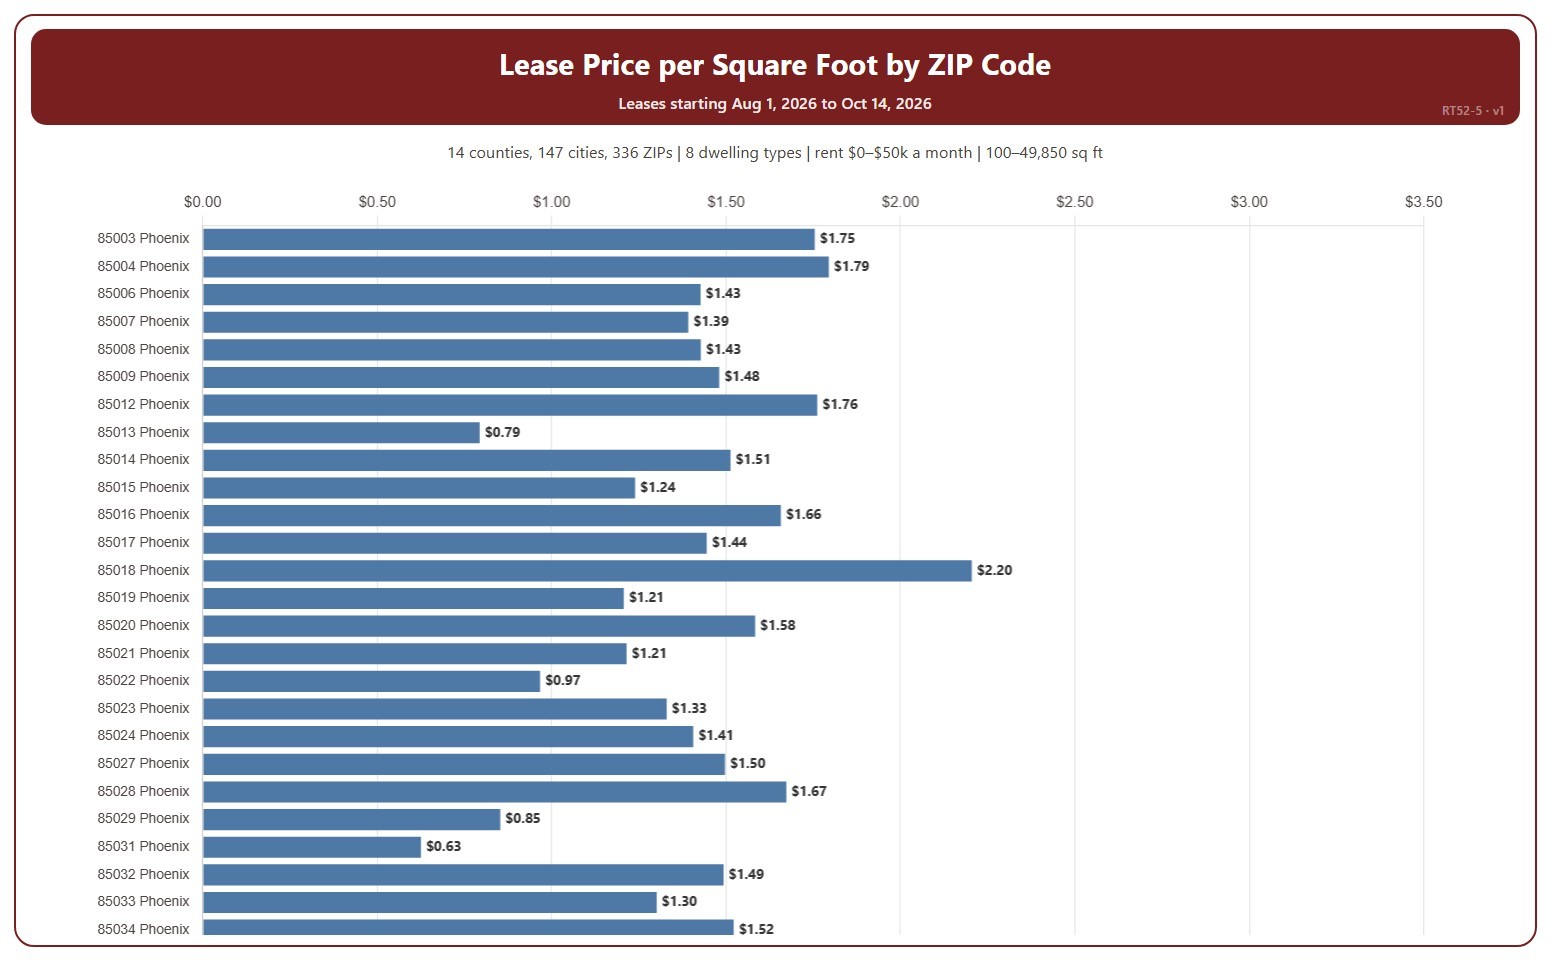
This chart shows the average monthly rent per square foot of recent leases in each ZIP code. It covers residential rentals leased through ARMLS, using the monthly rent each lease closed at, and places each lease in the month its tenancy starts.

It covers the last three calendar months up to the latest data; the heading shows the exact dates. The chart is updated every day. A ZIP code with only a few leases can be pulled up or down by a single home; the tooltip gives the number of leases. Scroll inside the chart to see every ZIP code.

It opens on every area in ARMLS; tick or untick counties, cities, and ZIP codes to narrow it. Narrow it further with the Dwelling Type and Furnished boxes and the monthly rent, home size, and year built sliders.

Hover over a bar to see the rent per square foot, the average rent, and the number of leases.

Average Sales Price per Square Foot by ZIP Code

About this chart

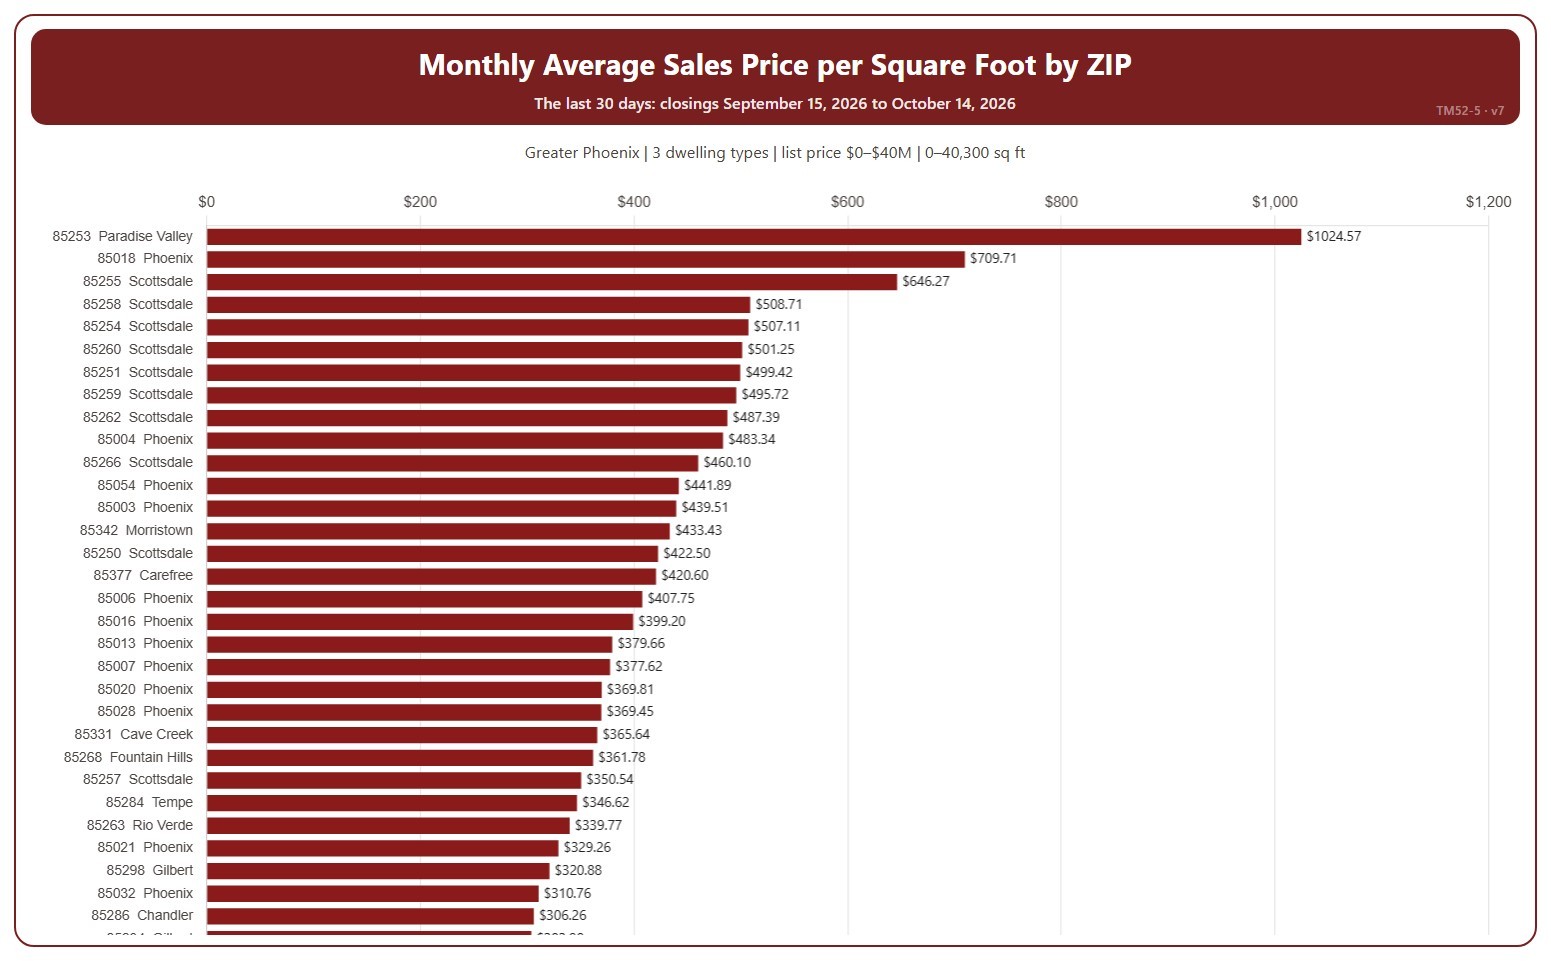
This chart ranks ZIP codes by the average sales price per square foot of their recent closings, highest first. Sales price per square foot is the total of the sale prices divided by the total of the homes’ square footage, over the homes that closed on ARMLS in the period.

It covers the 30 days of closings up to the newest one; the heading shows the exact dates. The chart is updated every day. A ZIP code with only a few closings can be pulled up or down by a single home. Scroll inside the chart to see every ZIP code.

It opens on the Greater Phoenix area: the counties, cities, and ZIP codes that make it up are ticked to start with. Tick or untick any of them to change the area, including counties beyond Greater Phoenix. Narrow it further with the Dwelling Type, Transaction Type, and New / Resale boxes and the list price, home size, and year built sliders.

Hover over a bar to see the figure and the number of closings.