About this chart
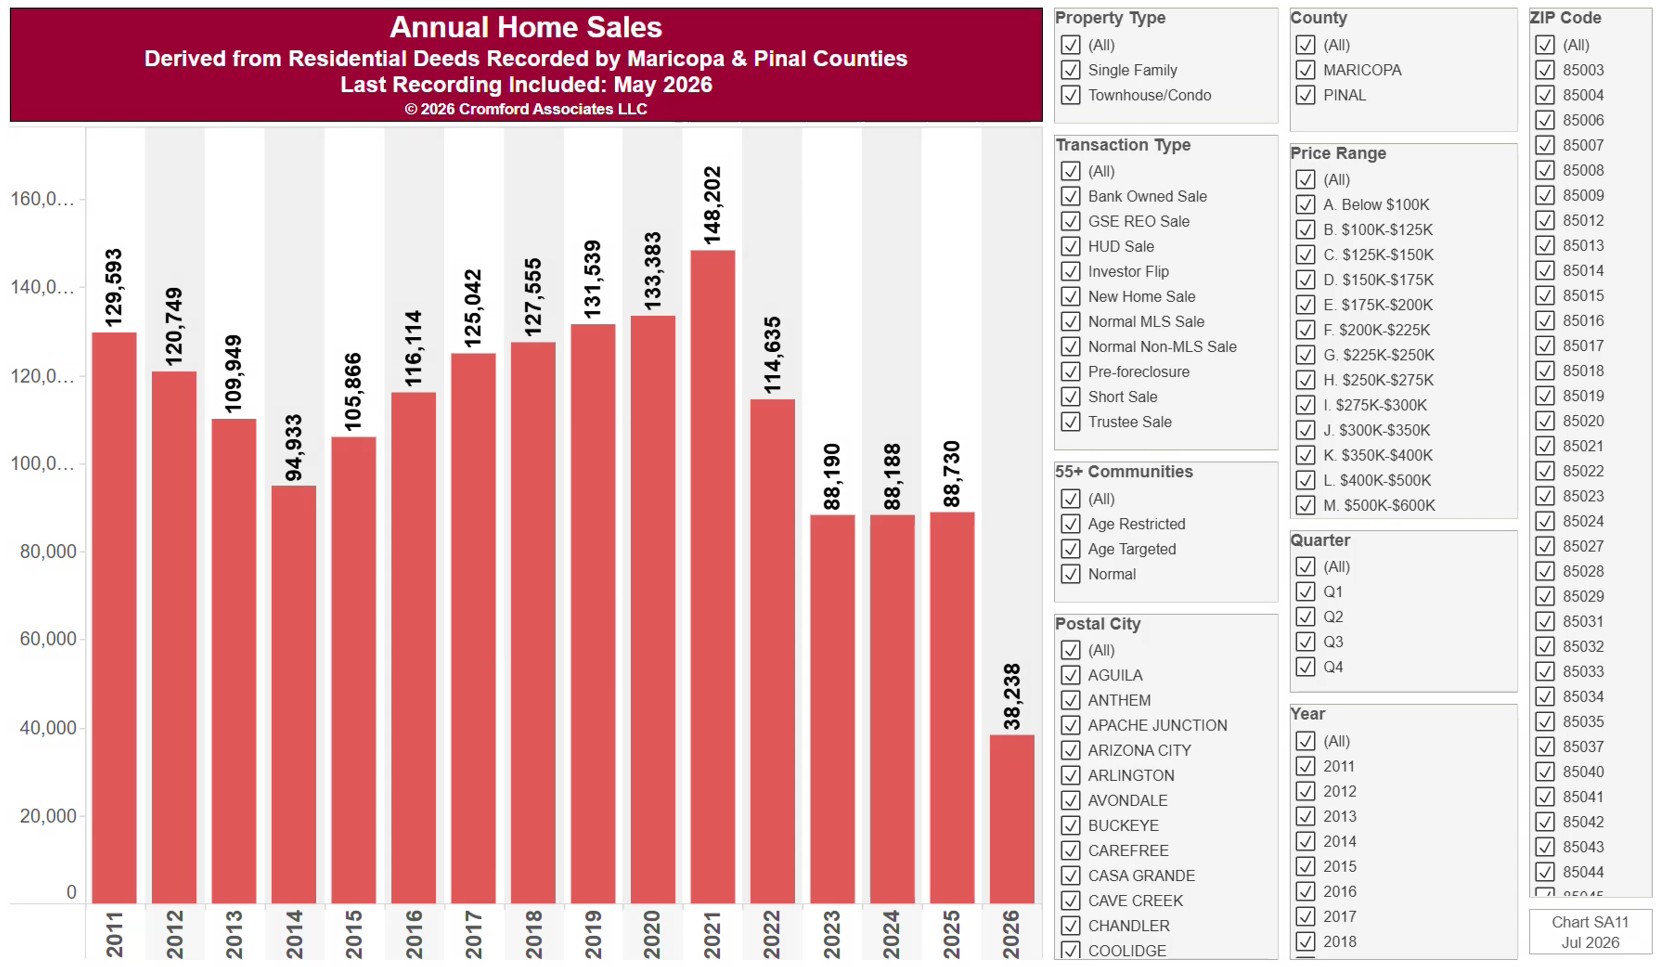
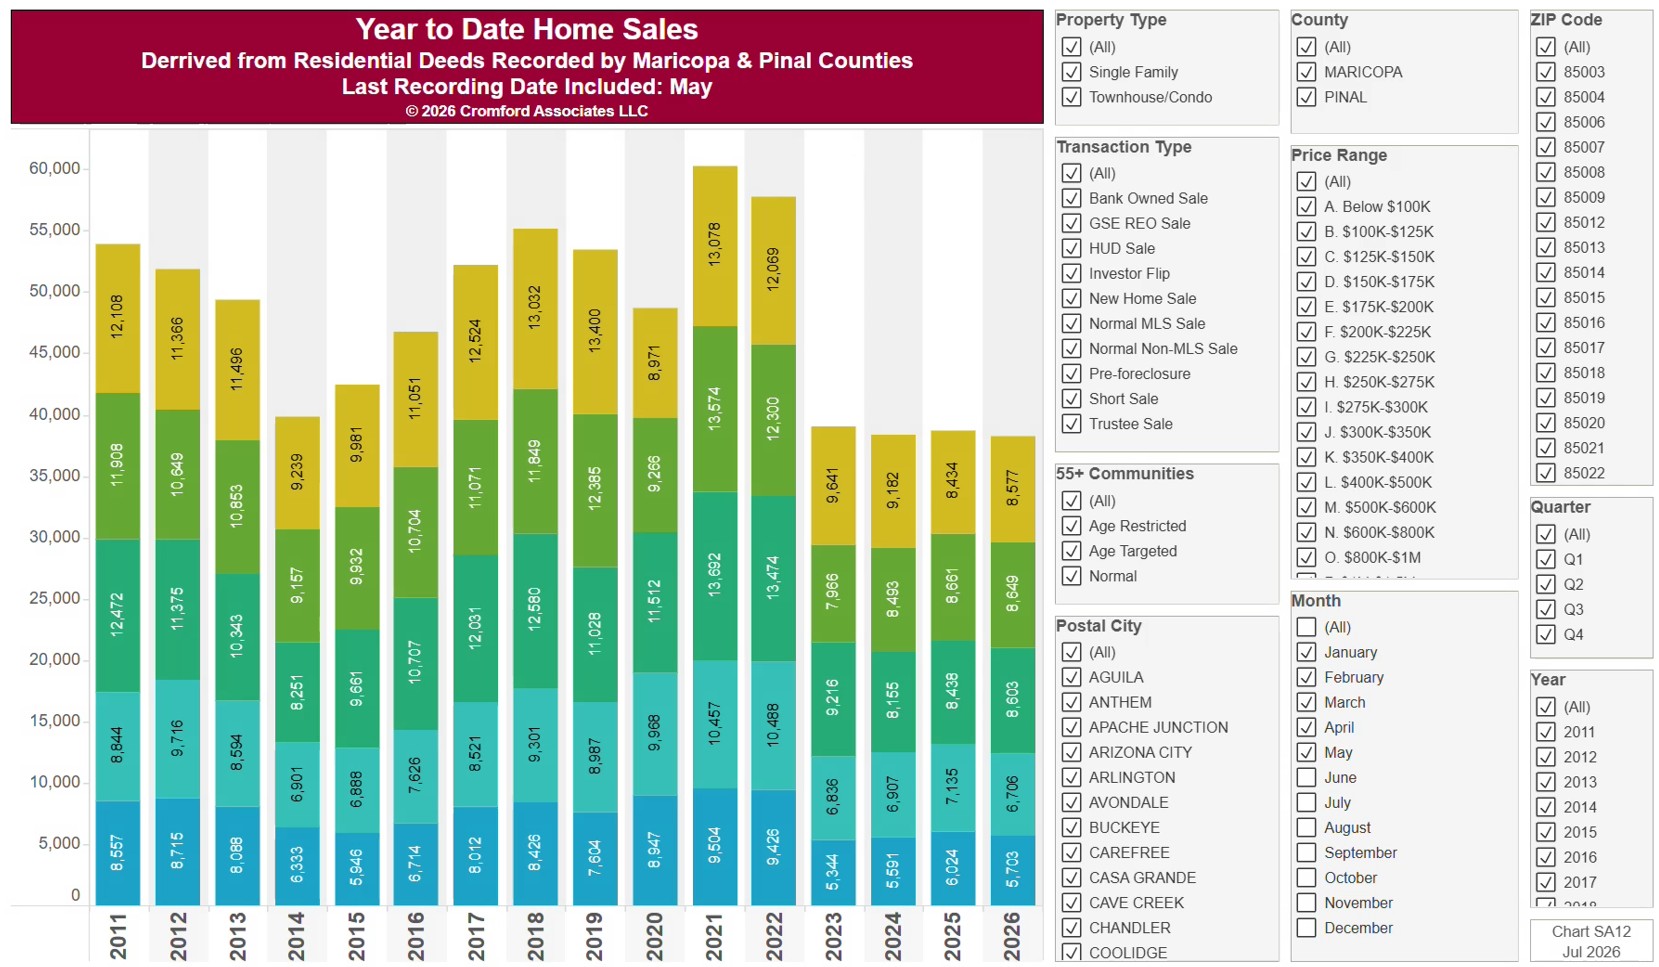
This chart counts the homes sold each year since 2011, from residential deeds recorded by Maricopa and Pinal Counties, with every year cut to the same months (January to the latest month recorded), so the current year can be compared fairly with earlier ones. Because it is built from recorded deeds, it covers every recorded sale, not just homes listed on ARMLS: new homes, private sales, and investor deals are all included.
It opens on Maricopa and Pinal Counties with everything included. Narrow it with the County, City, and ZIP panels, the Transaction Type, Property Type, and 55+ Communities boxes, and the sale price slider.
The records run to the end of last month and are updated monthly. Hover over a bar to see the exact figure for that year.