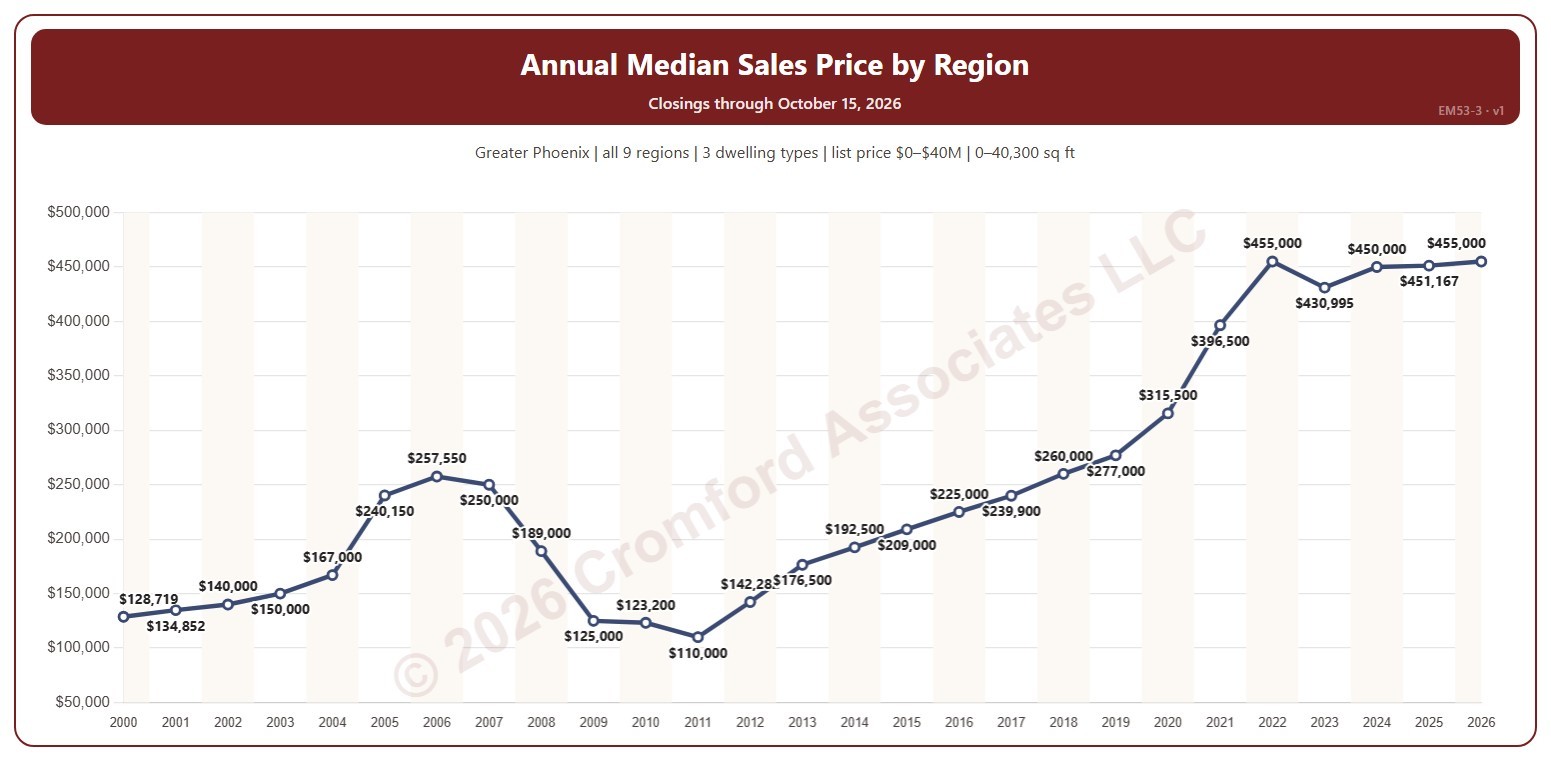
Annual Median Sales Price by Region

About this chart

This chart shows the median sales price each year, every year labeled. The median sales price is the middle sale price of the homes that closed on ARMLS in the period: half sold for more and half for less.

It opens on 2000 to date; drag the handles of the date slider under the chart to choose the years shown. The newest year is the year so far. The chart is updated every day.

It opens on the Greater Phoenix area: the counties, cities, and ZIP codes that make it up are ticked to start with. Tick or untick any of them to change the area, including counties beyond Greater Phoenix. Use the Region boxes to pick any of the nine Greater Phoenix regions; Other areas (unticked to start with) adds ZIP codes outside them, needed if you widen the area beyond Greater Phoenix. Narrow it further with the Dwelling Type, Transaction Type, and New / Resale boxes and the list price, home size, and year built sliders.

Hover over the line to see the median and the number of closings that year.
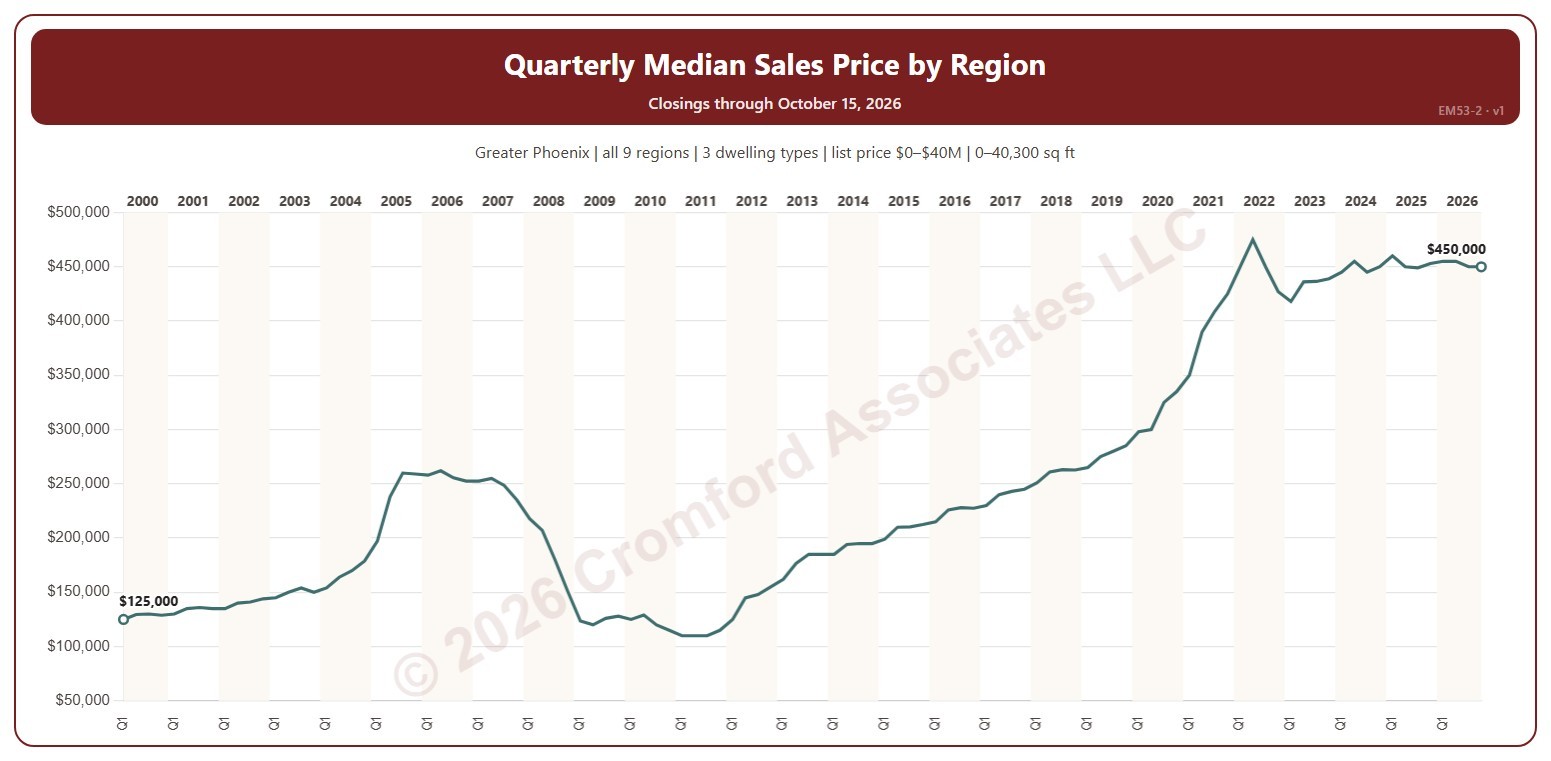
Quarterly Median Sales Price by Region

About this chart

This chart shows the median sales price each quarter. The median sales price is the middle sale price of the homes that closed on ARMLS in the period: half sold for more and half for less.

It opens on the first quarter of 2000 to date; drag the handles of the date slider under the chart to choose the quarters shown. The newest quarter is the quarter so far. The chart is updated every day.

It opens on the Greater Phoenix area: the counties, cities, and ZIP codes that make it up are ticked to start with. Tick or untick any of them to change the area, including counties beyond Greater Phoenix. Use the Region boxes to pick any of the nine Greater Phoenix regions; Other areas (unticked to start with) adds ZIP codes outside them, needed if you widen the area beyond Greater Phoenix. Narrow it further with the Dwelling Type, Transaction Type, and New / Resale boxes and the list price, home size, and year built sliders.

Hover over the line to see the median and the number of closings that quarter.

Monthly Median Sales Price by Region

About this chart

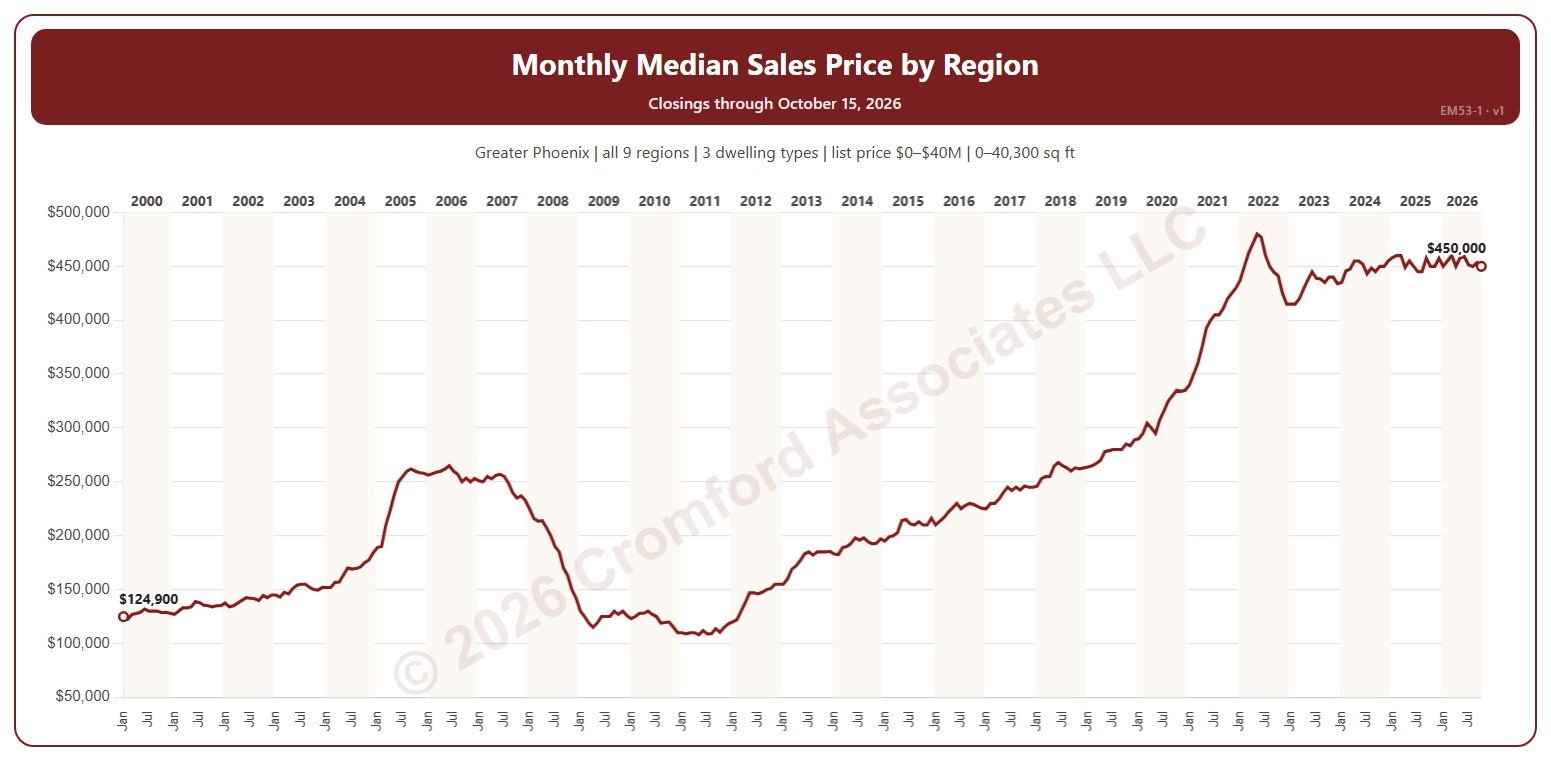
This chart shows the median sales price each month. The median sales price is the middle sale price of the homes that closed on ARMLS in the period: half sold for more and half for less.

It opens on January 2000 to date; drag the handles of the date slider under the chart to choose the months shown. The newest month is the month so far. The chart is updated every day.

It opens on the Greater Phoenix area: the counties, cities, and ZIP codes that make it up are ticked to start with. Tick or untick any of them to change the area, including counties beyond Greater Phoenix. Use the Region boxes to pick any of the nine Greater Phoenix regions; Other areas (unticked to start with) adds ZIP codes outside them, needed if you widen the area beyond Greater Phoenix. Narrow it further with the Dwelling Type, Transaction Type, and New / Resale boxes and the list price, home size, and year built sliders.

Hover over the line to see the median and the number of closings that month.

Year-over-Year Percent Change in List Price per Square Foot – Active Listings

About this chart

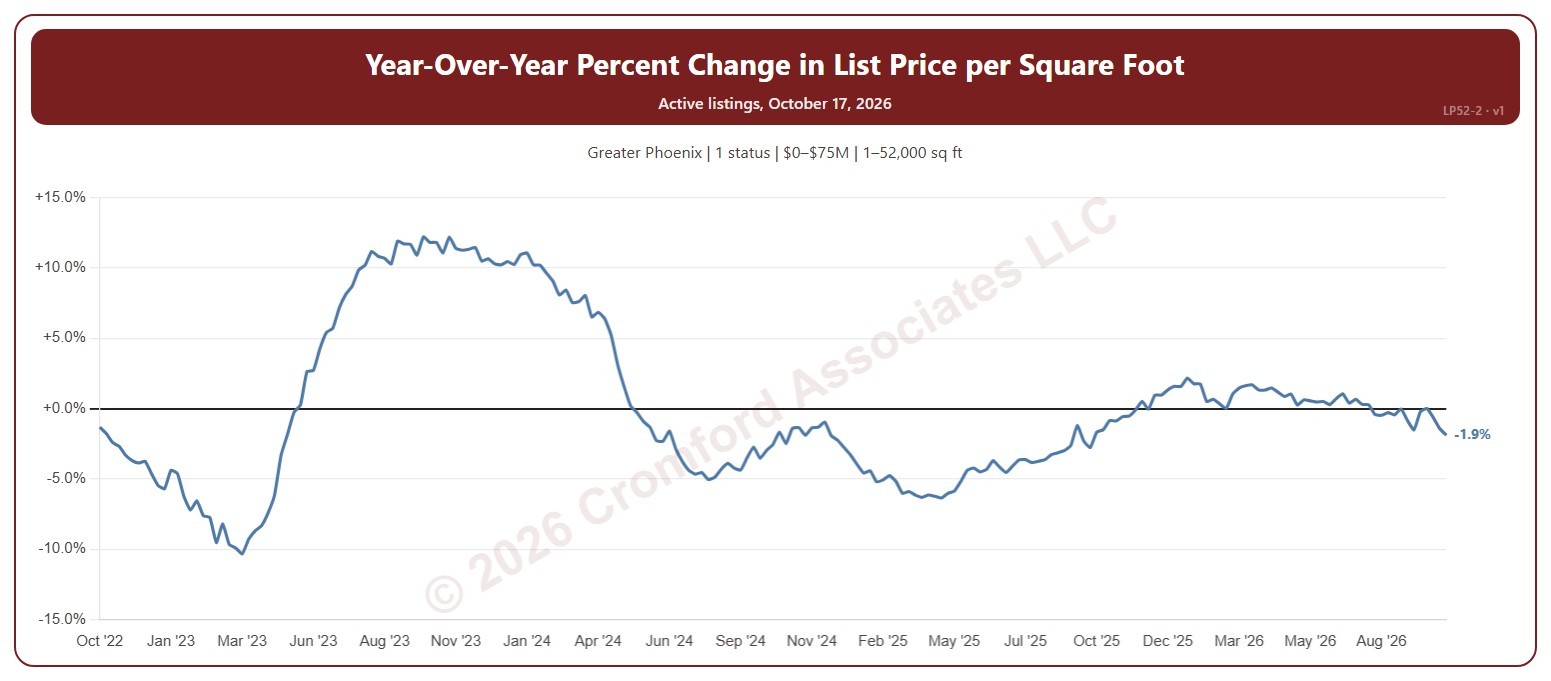
This chart shows how the average asking price per square foot of the homes for sale compares with the same Saturday a year earlier, as a percentage. The average is the total asking price of the active listings divided by their total square feet, taken every Saturday, so larger homes count for more.

It opens on the last 4 years; choose a longer period in the Period box, back to 2012. The chart is updated every day.

It opens on the Greater Phoenix area and on Active listings; tick UCB / CCBS or Coming Soon in the Status box to add them. Tick or untick counties, cities, and ZIP codes to change the area, including counties beyond Greater Phoenix. Narrow it further with the Dwelling Type, Transaction Type, and New / Resale boxes and the list price, home size, year built, and days on market sliders.

Hover over the line to see the change and the two prices per square foot it compares, each with its Saturday.

Listing Success Rate by Price Range

About this chart

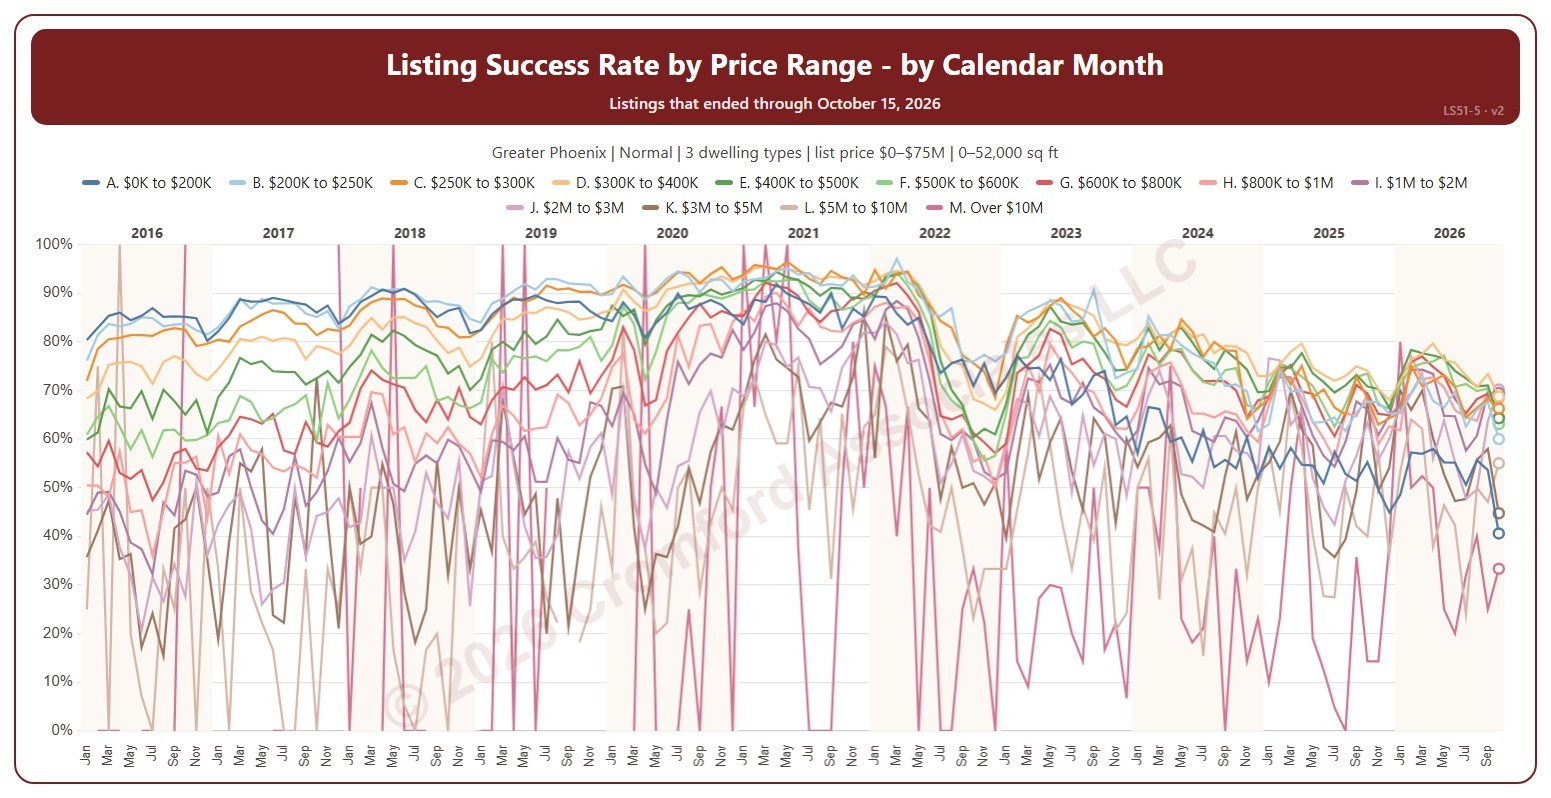
This chart shows the listing success rate each month for each list price range, a line per range. The listing success rate is the share of listings that closed, out of all the listings that ended: closed, expired, or cancelled. Each listing counts once, in the month (or window) its listing ended: the closing date for a closing, the expiration for an expired listing, the cancellation for a cancelled one. The highest price ranges have few listings, so their lines swing widely.

It opens on January 2016 to date; drag the handles of the date slider under the chart to choose the months shown, as far back as January 2004. The newest month is the month so far, shown as a hollow point. The chart is updated every day. Click a price range in the legend to hide or show its line.

It opens on the Greater Phoenix area: the counties, cities, and ZIP codes that make it up are ticked to start with. Tick or untick any of them to change the area, including counties beyond Greater Phoenix. It opens on normal sales; tick other transaction types to add them. Narrow it further with the Dwelling Type and New / Resale boxes and the list price, home size, and year built sliders.

Hover over the chart to see each range’s rate that month and how many listings closed out of all that ended.

Listing Success Rate by Calendar Month

About this chart

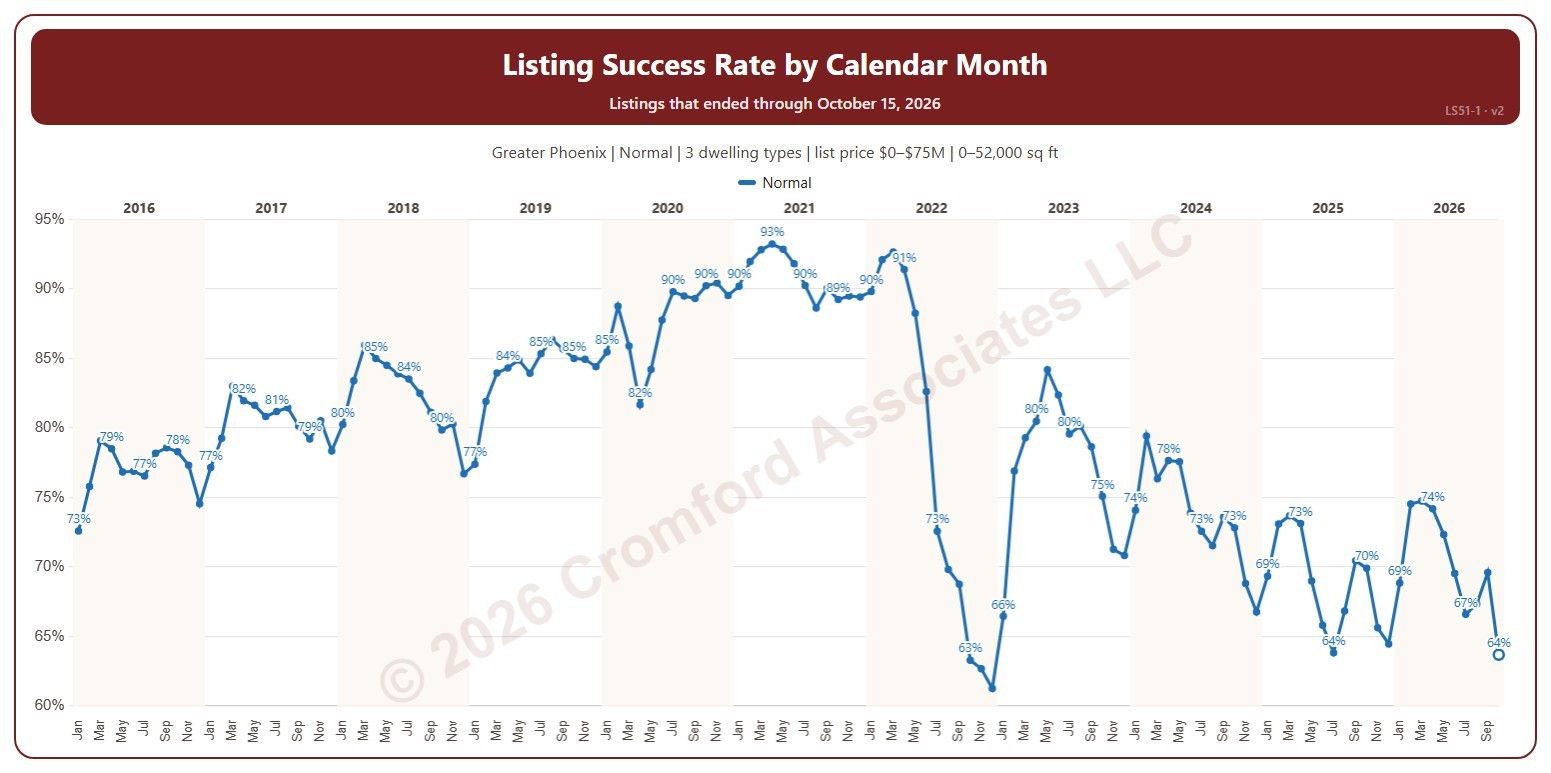
This chart shows the listing success rate each month. The listing success rate is the share of listings that closed, out of all the listings that ended: closed, expired, or cancelled. Each listing counts once, in the month (or window) its listing ended: the closing date for a closing, the expiration for an expired listing, the cancellation for a cancelled one. Tick more transaction types to see a line for each.

It opens on January 2016 to date; drag the handles of the date slider under the chart to choose the months shown, as far back as January 2004. The newest month is the month so far, shown as a hollow point. The chart is updated every day.

It opens on the Greater Phoenix area: the counties, cities, and ZIP codes that make it up are ticked to start with. Tick or untick any of them to change the area, including counties beyond Greater Phoenix. It opens on normal sales; tick other transaction types to add them. Narrow it further with the Dwelling Type and New / Resale boxes and the list price, home size, and year built sliders.

Hover over the line to see the rate and how many listings closed out of all that ended.

Months of Supply – Excluding UCB and CCBS Listings

About this chart

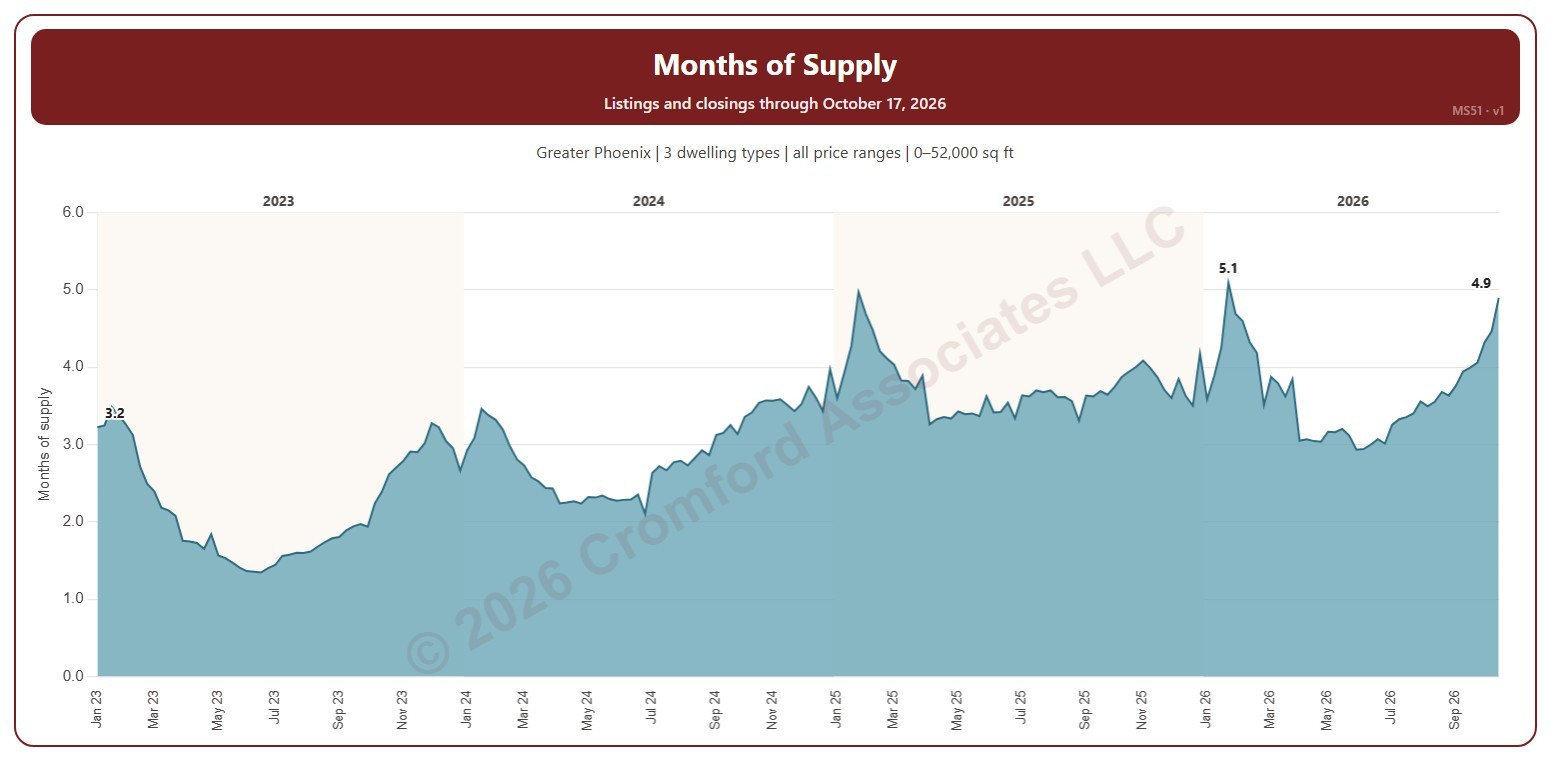
This chart shows months of supply each Saturday: the active listings on ARMLS that day divided by the homes that closed in the month up to the day before, so it says how many months the listings for sale would last at the current pace of sales. Listings under contract that are still taking backup offers (UCB / CCBS) are not counted as supply.

It opens on January three years back to date; drag the handles of the date slider under the chart to choose the weeks shown, as far back as January 2011. The chart is updated every day.

It opens on the Greater Phoenix area: the counties, cities, and ZIP codes that make it up are ticked to start with. Tick or untick any of them to change the area, including counties beyond Greater Phoenix. Narrow it further with the Price Range boxes, the Dwelling Type, Transaction Type, and New / Resale boxes, and the home size and year built sliders; the listings and the closings are narrowed the same way (a listing by its list price that day, a closing by its list price).

Hover over the chart to see the week’s months of supply, the active listings, and the closings in its month.

Months of Supply – including UCB/CCBS Listings

About this chart

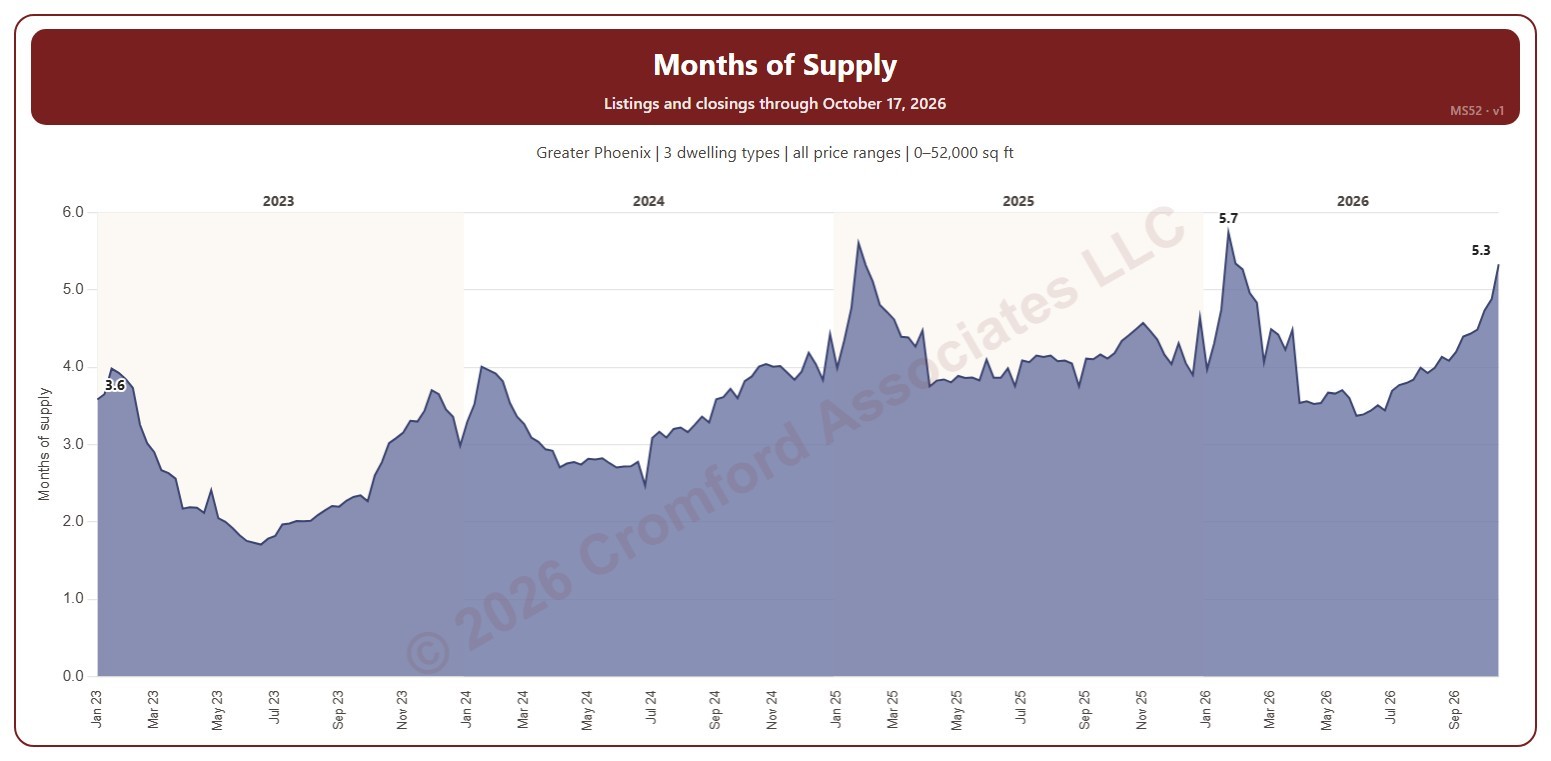
This chart shows months of supply each Saturday: the listings on ARMLS that day that are active or under contract but still taking backup offers (UCB / CCBS), divided by the homes that closed in the month up to the day before, so it says how many months that supply would last at the current pace of sales. MS51 is the same measure without the UCB / CCBS listings.

It opens on January three years back to date; drag the handles of the date slider under the chart to choose the weeks shown, as far back as January 2011. The chart is updated every day.

It opens on the Greater Phoenix area: the counties, cities, and ZIP codes that make it up are ticked to start with. Tick or untick any of them to change the area, including counties beyond Greater Phoenix. Narrow it further with the Price Range boxes, the Dwelling Type, Transaction Type, and New / Resale boxes, and the home size and year built sliders; the listings and the closings are narrowed the same way (a listing by its list price that day, a closing by its list price).

Hover over the chart to see the week’s months of supply, the listings, and the closings in its month.

Flip Sales – Median Measures by City

About this chart

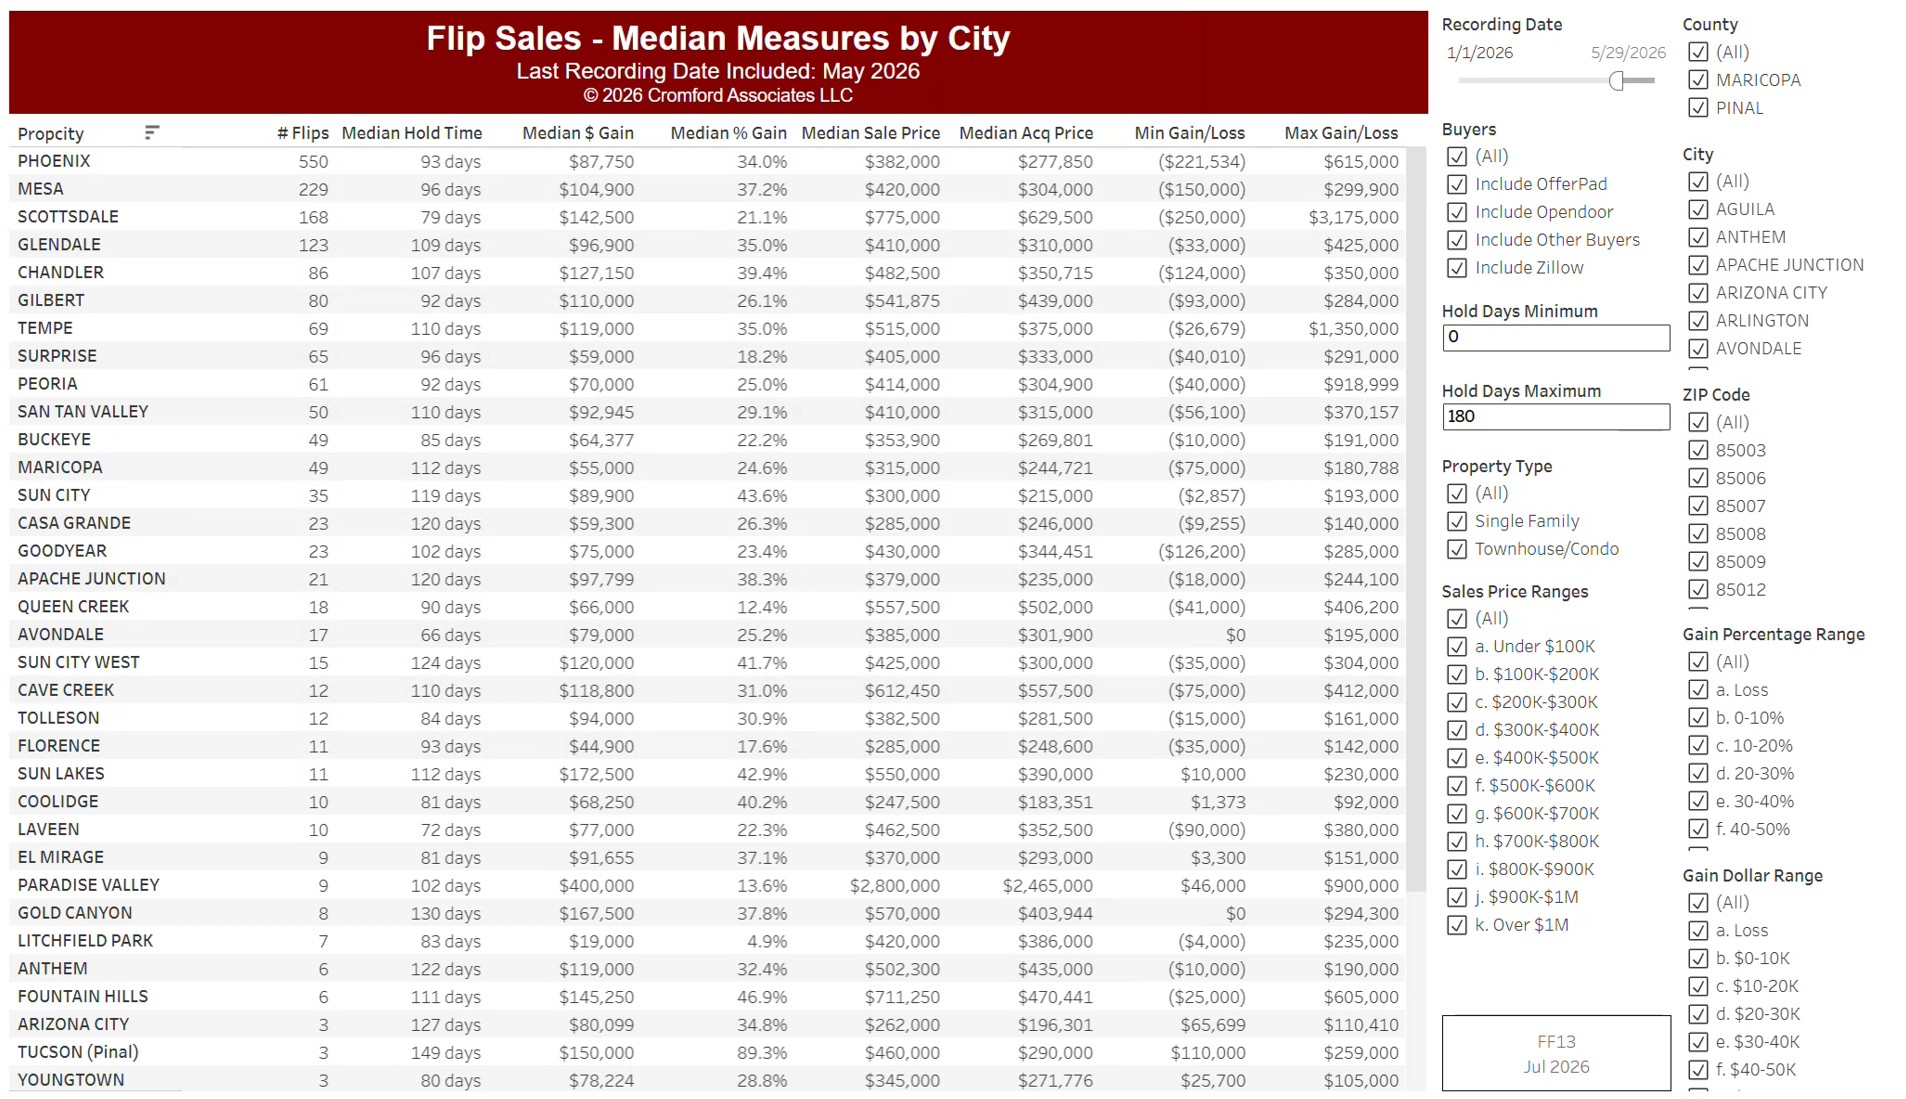
This table compares fix-and-flip sales by city, from residential deeds recorded by Maricopa and Pinal Counties: homes bought and resold by an investor. Each row is a city, with the number of flips, the median hold time in days, the median gross profit in dollars and as a percentage, the median sale and purchase prices, and the smallest and largest gross profit.

It opens on the months recorded so far this year; use the Recording Month slider to choose the period. It is sorted by the number of flips. Narrow it with the County, City, and ZIP panels, the Buyers and Property Type boxes, and the sale price, hold days, gross profit, and gross profit % sliders.

Gross profit is the difference between the purchase and resale prices, before renovation and selling costs.

Multi-Family Permits – Monthly Counts

About this chart

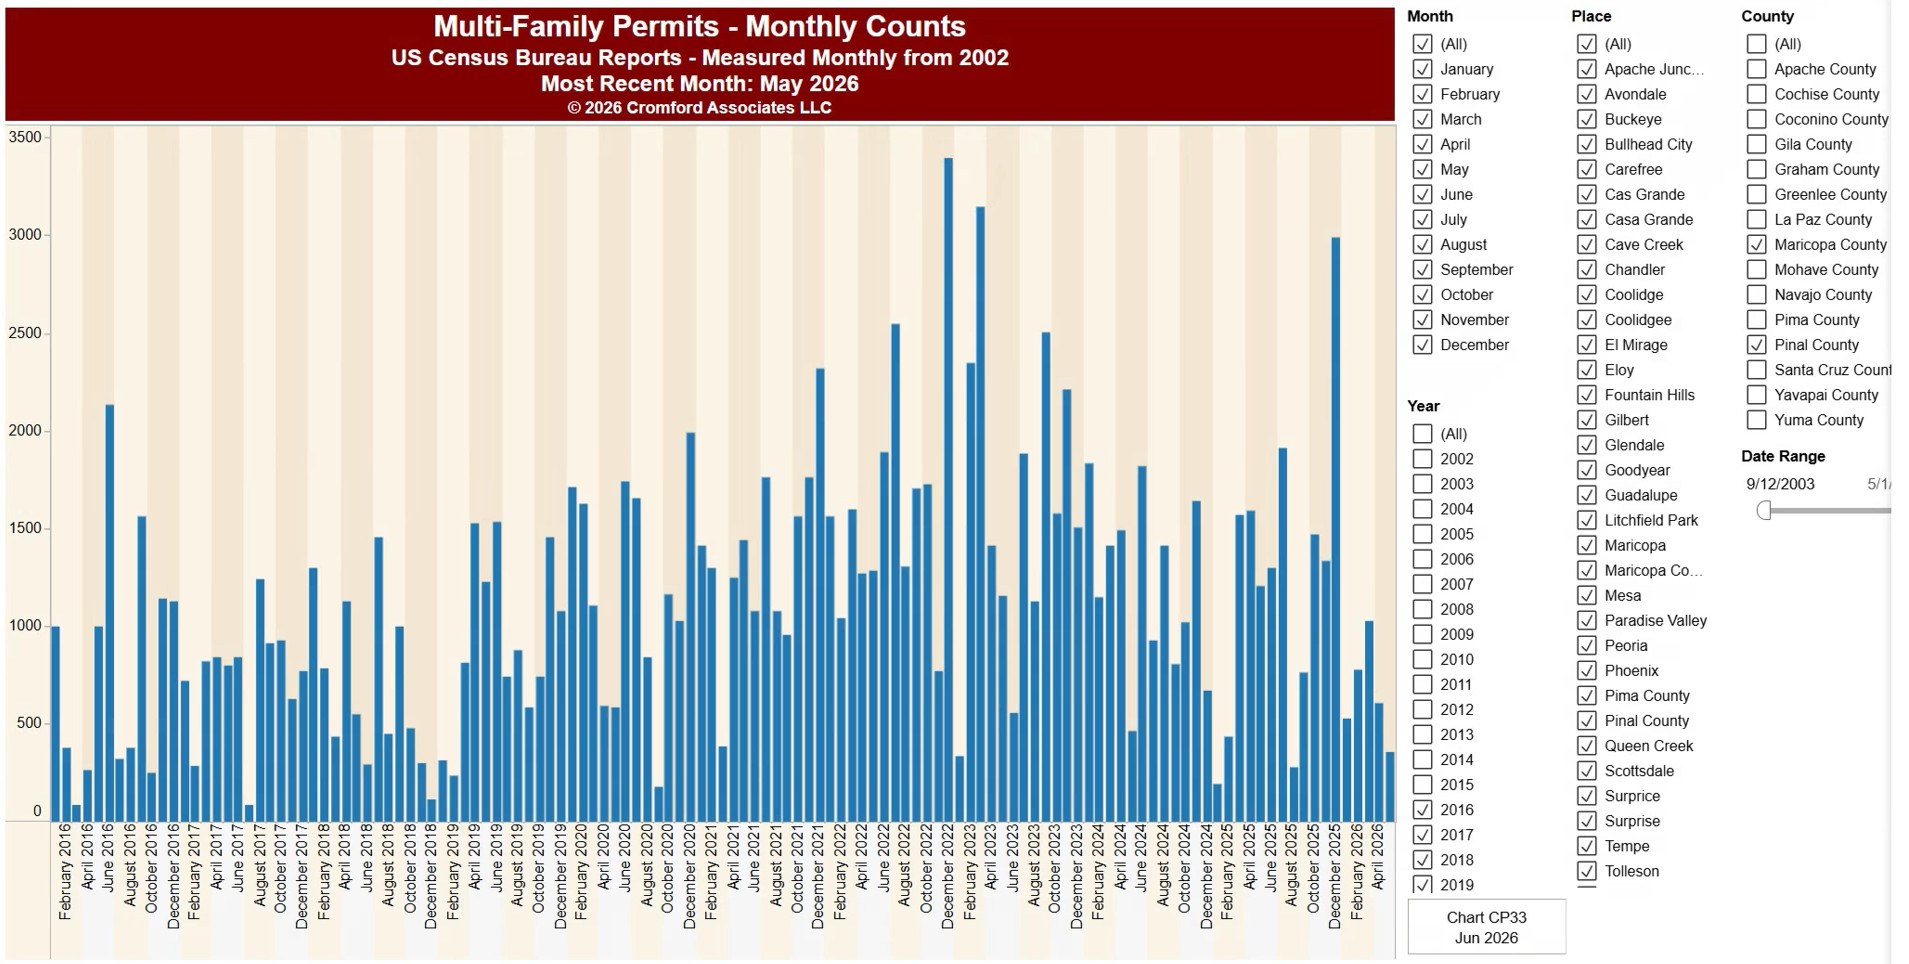
This chart shows the number of multi-family homes (apartments, condos, and other units in buildings with more than one home) authorized by building permits, from the US Census Bureau’s Building Permits Survey. Each bar is the total for one month.

It opens on Arizona with Maricopa and Pinal Counties and every city and town in them, from 2017 onwards. Choose any US state from the State list, pick counties and places, and use the Date range control to look back as far as 1996. The most recent month available is shown under the title.

Permits are an early sign of new construction, so this shows how much new multi-family housing is on the way. Hover over a bar to see its value.